| Param | Original file | Final file |
|---|---|---|
| Filename | modeM0/AS1A04_075T03_9000001780_12027cztM0_level2.evt | modeM0/AS1A04_075T03_9000001780_12027cztM0_level2_quad_clean.evt |
| Size (bytes) | 227,972,160 | 58,985,280 |
| Size | 217.4 MB | 56.3 MB |
| Events in quadrant A | 1,526,722 | 401,212 |
| Events in quadrant B | 1,901,230 | 397,506 |
| Events in quadrant C | 1,379,572 | 393,189 |
| Events in quadrant D | 1,883,708 | 373,169 |
| Mode M9 | |||
|---|---|---|---|
| Quadrant | BADHDUFLAG | Total packets | Discarded packets |
| A | 0 | 6 | 0 |
| B | 0 | 6 | 0 |
| C | 0 | 6 | 0 |
| D | 0 | 6 | 0 |
| Mode SS | |||
|---|---|---|---|
| Quadrant | BADHDUFLAG | Total packets | Discarded packets |
| A | 0 | 64 | 0 |
| B | 0 | 64 | 0 |
| C | 0 | 64 | 0 |
| D | 0 | 64 | 0 |
| Mode M0 | |||
|---|---|---|---|
| Quadrant | BADHDUFLAG | Total packets | Discarded packets |
| A | 0 | 6592 | 0 |
| B | 0 | 7556 | 0 |
| C | 0 | 6367 | 0 |
| D | 0 | 7563 | 0 |
| Quadrant | Total seconds | Saturated seconds | Saturation percentage |
|---|---|---|---|
| A | 3105 | 69 | 2.222222% |
| B | 3105 | 167 | 5.378422% |
| C | 3105 | 45 | 1.449275% |
| D | 3105 | 93 | 2.995169% |
Noise dominated data is calculated using 1-second bins in cleaned event files. If a bin has >2000 counts, and if more than 50% of those come from <1% of pixels, then it is considered to be noise-dominated and hence unusable.
| Quadrant | # 1 sec bins | Bins with >0 counts | Bins with >2000 counts | High rate bins dominated by noise | Noise dominated (total time) | Noise dominated (detector-on time) | Marked lightcurve |
|---|---|---|---|---|---|---|---|
| A | 3105 | 3105 | 3 | 3 | 0.10% | 0.10% | 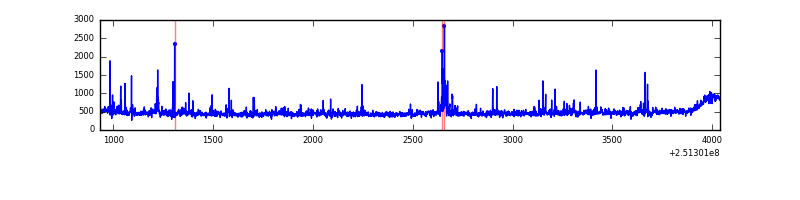 |
| B | 3105 | 3105 | 78 | 78 | 2.51% | 2.51% | 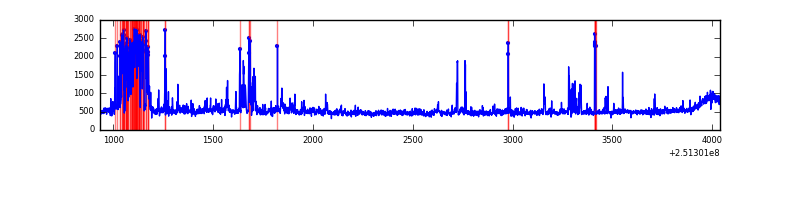 |
| C | 3105 | 3105 | 0 | 0 | 0.00% | 0.00% | 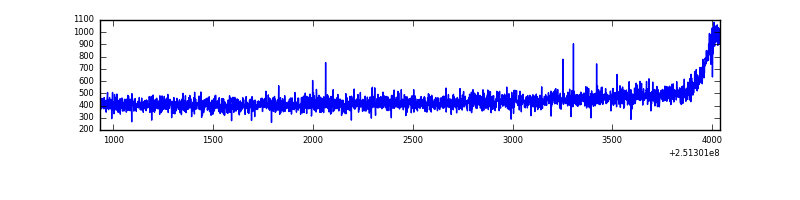 |
| D | 3105 | 3105 | 44 | 44 | 1.42% | 1.42% | 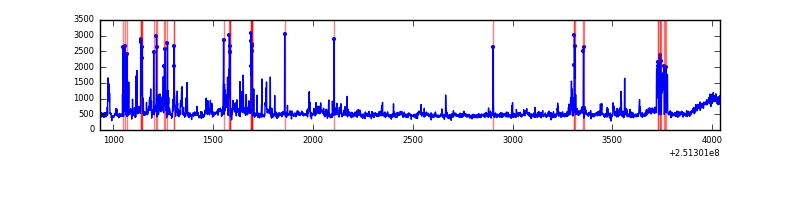 |
Top three noisy pixels from each quadrant. If the there are fewer than three noisy pixels in the level2.evt file, extra rows are filled as -1
| Pixel properties | Quadrant properties | ||||||
|---|---|---|---|---|---|---|---|
| Quadrant | DetID | PixID | Counts | Sigma | Mean | Median | Sigma |
| A | 1 | 162 | 36900 | 483.97 | 361 | 354 | 75.5 |
| A | 4 | 2 | 29450 | 385.31 | 361 | 354 | 75.5 |
| A | 1 | 178 | 18333 | 238.09 | 361 | 354 | 75.5 |
| B | 0 | 85 | 221632 | 3165.18 | 361 | 352 | 69.9 |
| B | 4 | 239 | 116920 | 1667.38 | 361 | 352 | 69.9 |
| B | 15 | 204 | 52617 | 747.6 | 361 | 352 | 69.9 |
| C | 13 | 61 | 2692 | 28.08 | 353 | 355 | 83.2 |
| C | 14 | 234 | 1033 | 8.15 | 353 | 355 | 83.2 |
| C | 3 | 202 | 893 | 6.46 | 353 | 355 | 83.2 |
| D | 1 | 52 | 189712 | 2301.72 | 344 | 335 | 82.3 |
| D | 4 | 95 | 101026 | 1223.81 | 344 | 335 | 82.3 |
| D | 8 | 195 | 81294 | 983.99 | 344 | 335 | 82.3 |
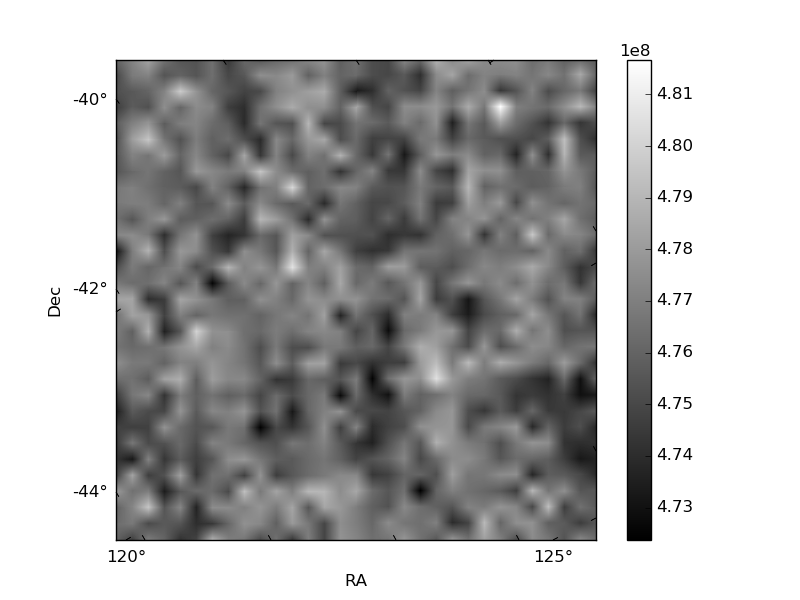
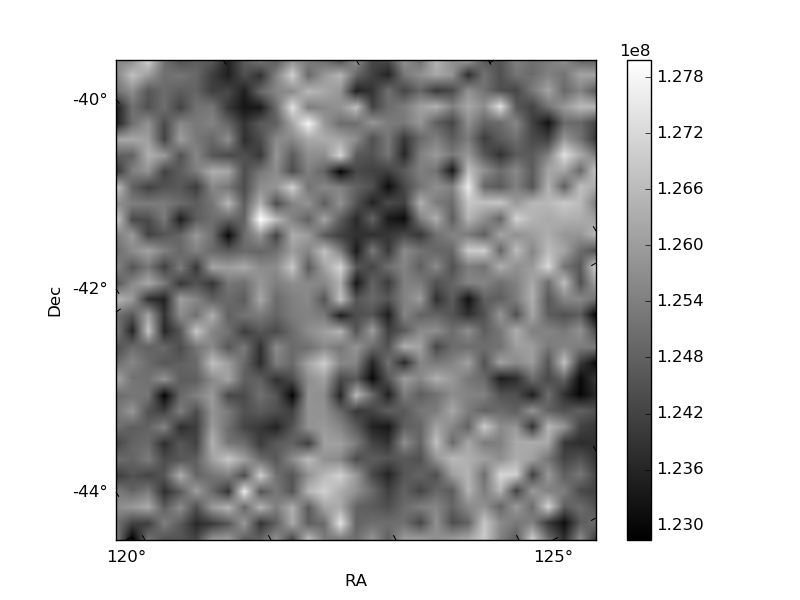
Histogram calculated using DETX and DETY for each event in the final _common_clean file
| Quadrant A | 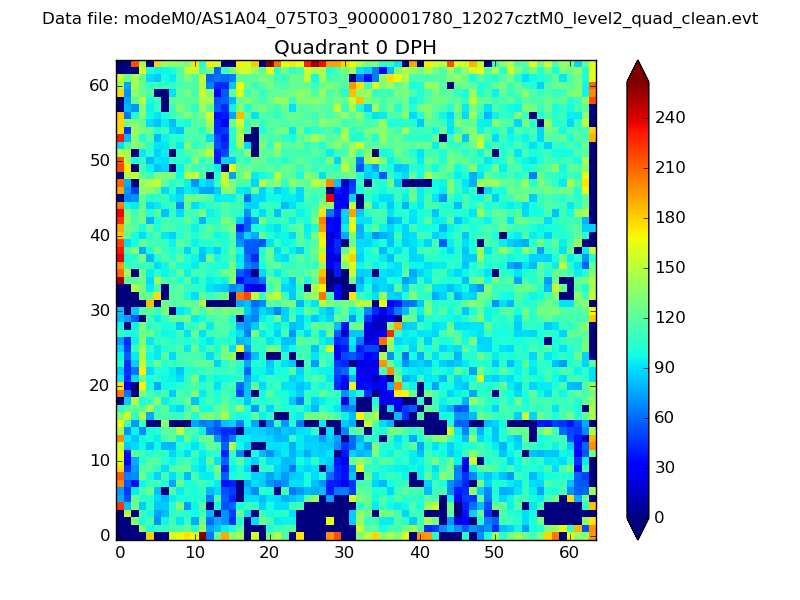 |
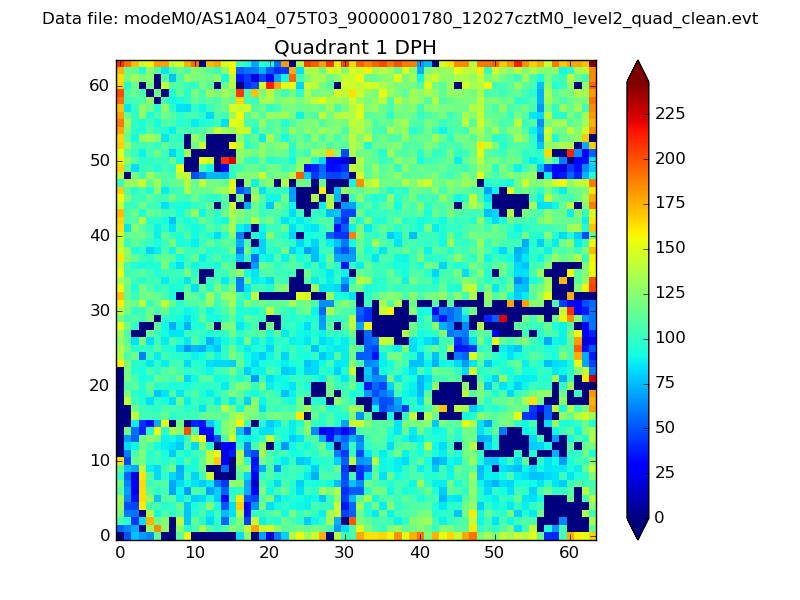 |
Quadrant B |
|---|---|---|---|
| Quadrant D | 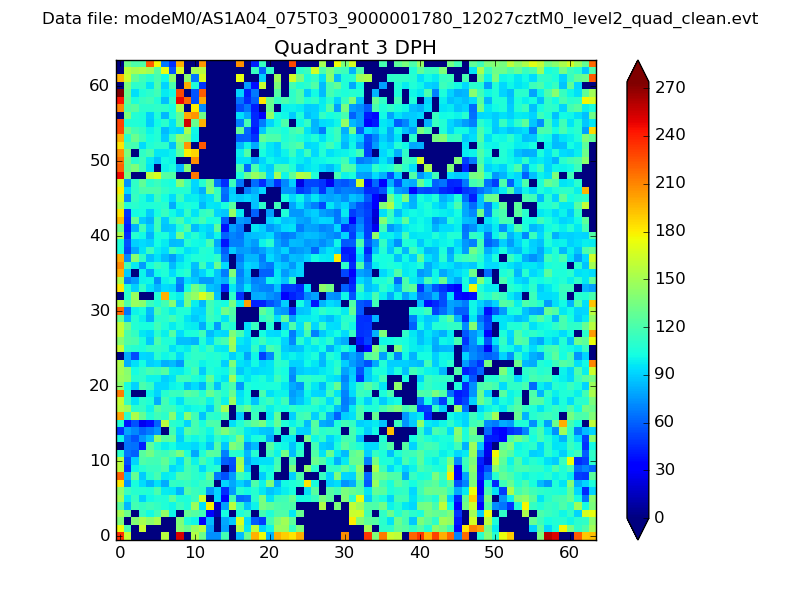 |
 |
Quadrant C |
| Plot type | Count rate plots | Images |
|---|---|---|
| Comparison with Poisson distribution Blue bars denote a histogram of data divided into 1 sec bins. Red curve is a Poisson curve with rate = median count rate of data. |
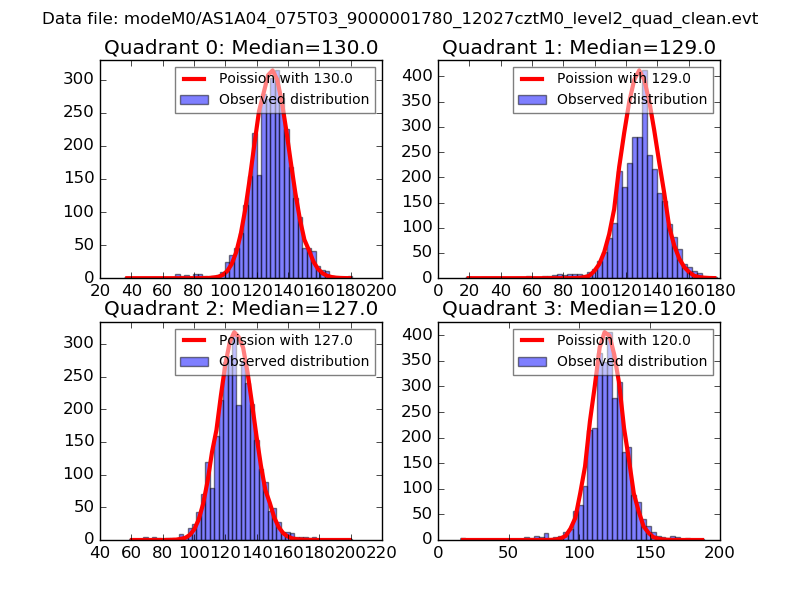 |
 |
| Quadrant-wise count rates Data is divided into 100 sec bins |
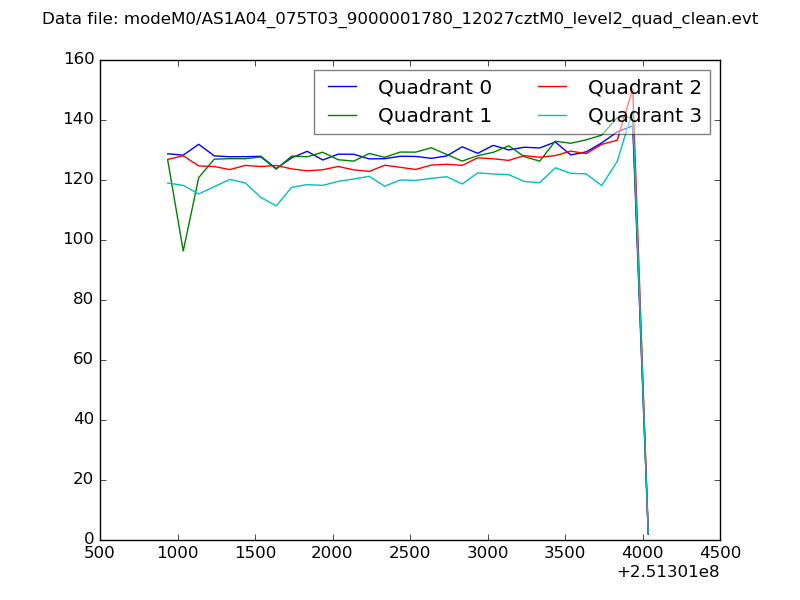 |
|
| Module-wise count rates for Quadrant A Data is divided into 100 sec bins |
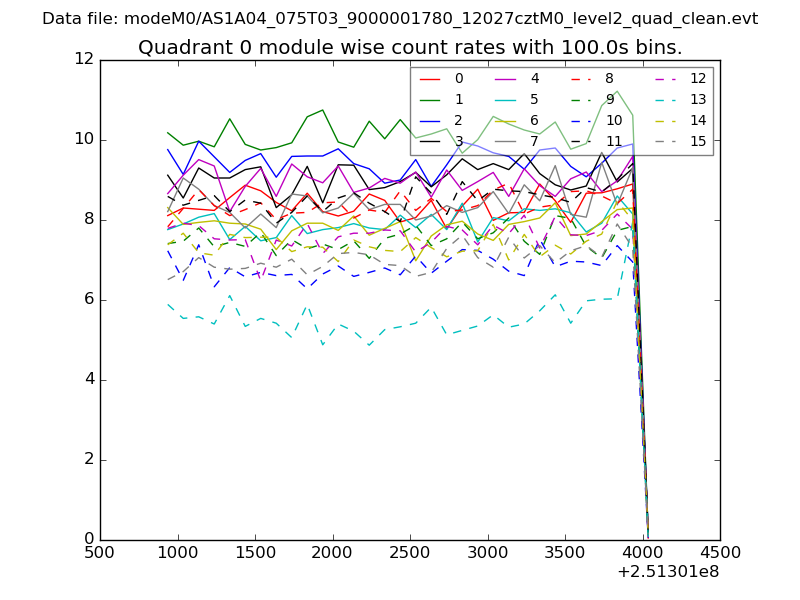 |
 |
| Module-wise count rates for Quadrant B Data is divided into 100 sec bins |
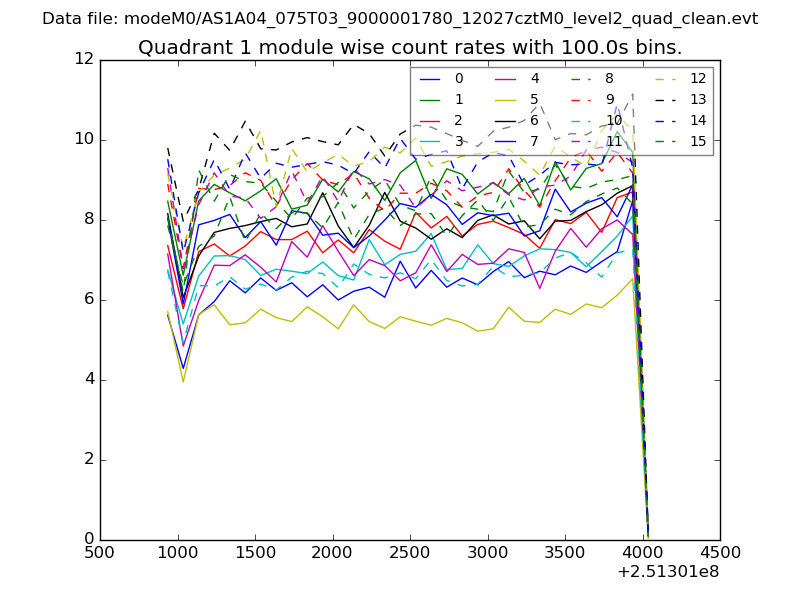 |
 |
| Module-wise count rates for Quadrant C Data is divided into 100 sec bins |
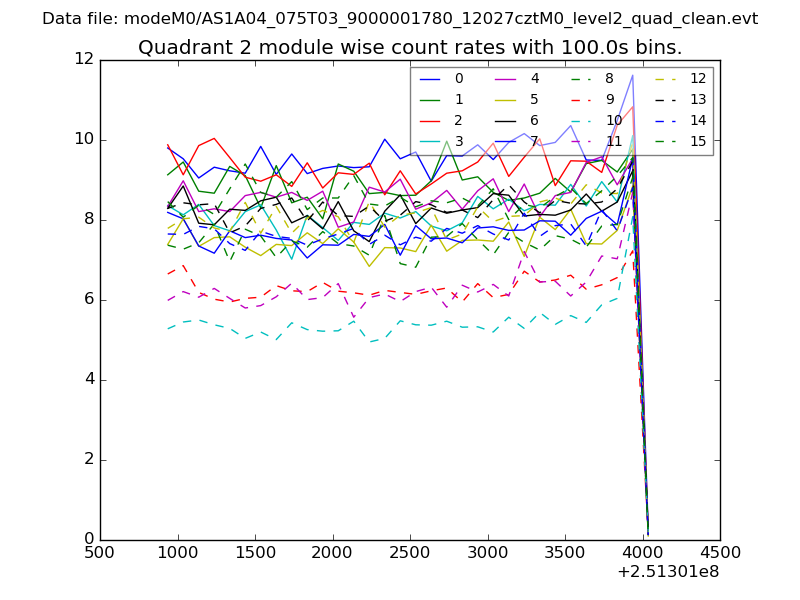 |
 |
| Module-wise count rates for Quadrant D Data is divided into 100 sec bins |
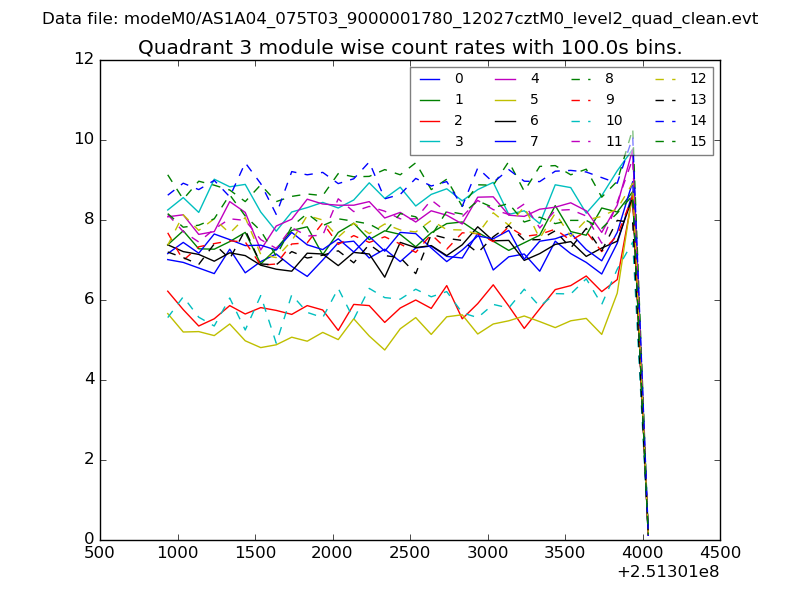 |
 |
| Parameter | Plot |
|---|---|
| CZT HV Monitor | 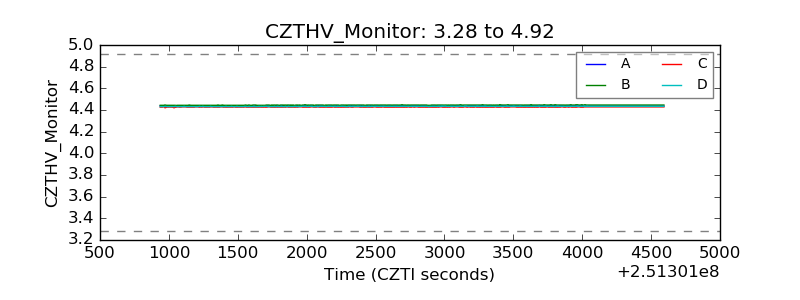 |
| D_VDD | 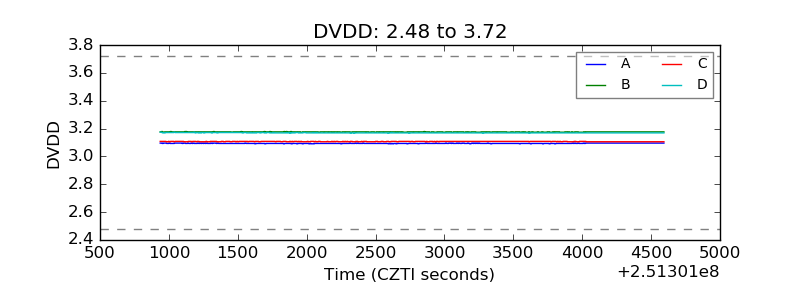 |
| Temperature 1 | 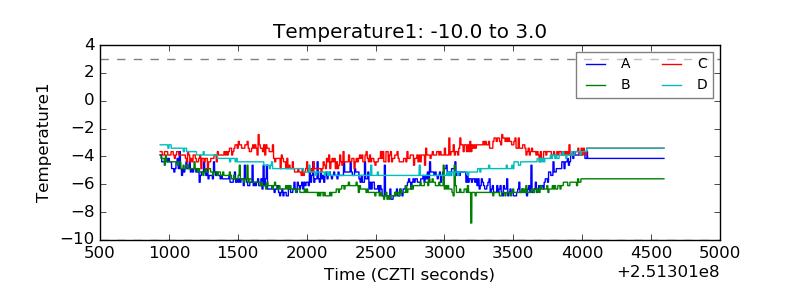 |
| Veto HV Monitor | 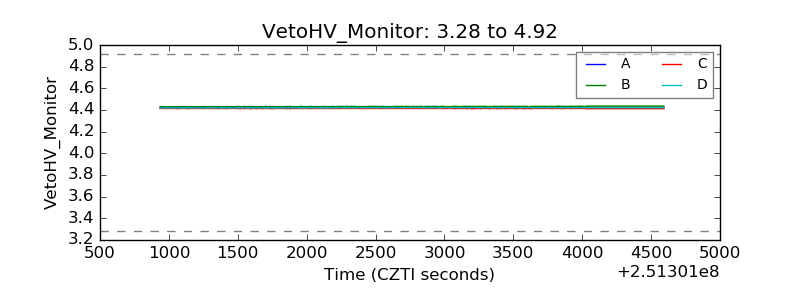 |
| Veto LLD | 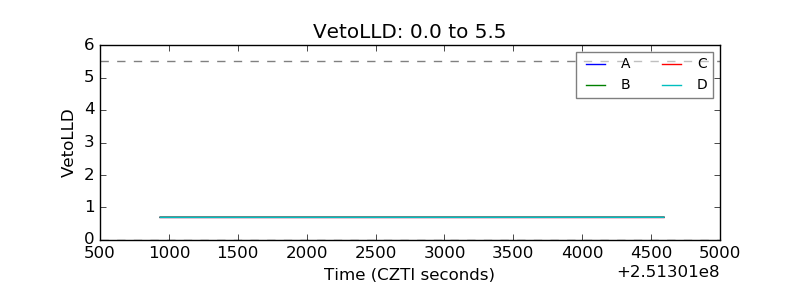 |
| Alpha Counter | 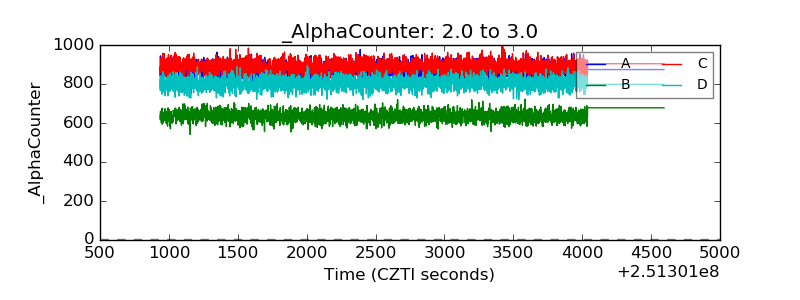 |
| _CPM_Rate | 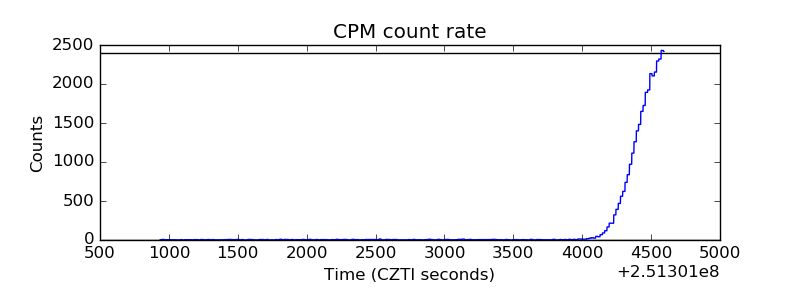 |
| CZT Counter | 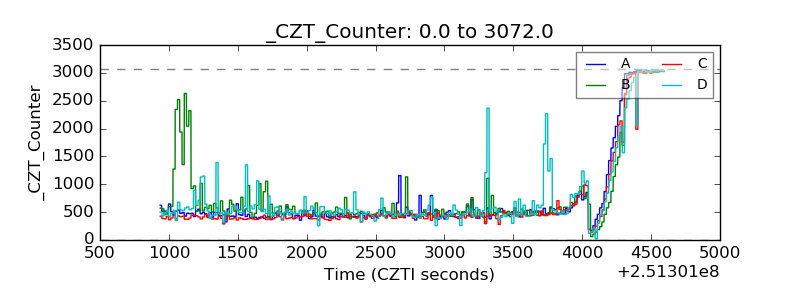 |
| +2.5 Volts monitor |  |
| +5 Volts monitor |  |
| _ROLL_ROT | 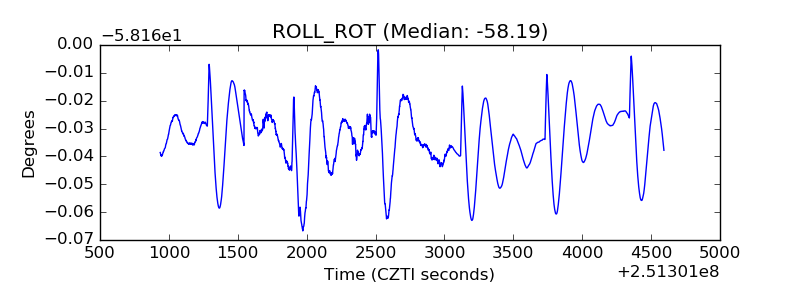 |
| _Roll_DEC | 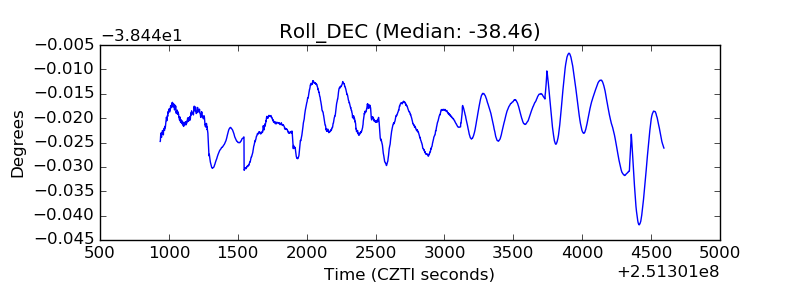 |
| _Roll_RA | 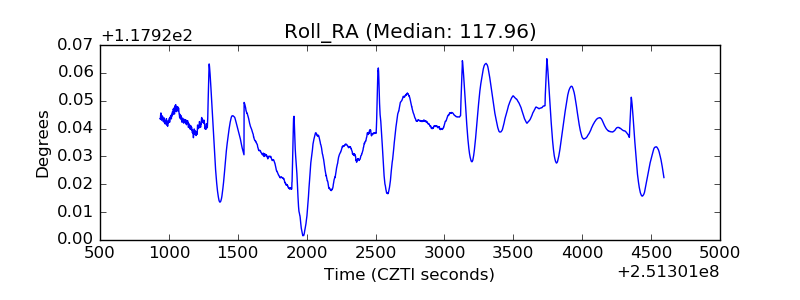 |
| Veto Counter | 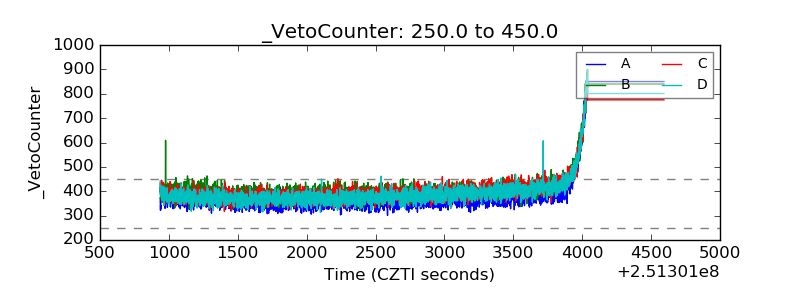 |