| Param | Original file | Final file |
|---|---|---|
| Filename | modeM0/AS1A03_085T02_9000001784_12039cztM0_level2.evt | modeM0/AS1A03_085T02_9000001784_12039cztM0_level2_quad_clean.evt |
| Size (bytes) | 238,708,800 | 27,708,480 |
| Size | 227.7 MB | 26.4 MB |
| Events in quadrant A | 1,384,886 | 169,706 |
| Events in quadrant B | 1,766,622 | 170,059 |
| Events in quadrant C | 1,326,101 | 168,269 |
| Events in quadrant D | 2,576,121 | 146,600 |
| Mode M9 | |||
|---|---|---|---|
| Quadrant | BADHDUFLAG | Total packets | Discarded packets |
| A | 0 | 11 | 0 |
| B | 0 | 11 | 0 |
| C | 0 | 11 | 0 |
| D | 0 | 11 | 0 |
| Mode SS | |||
|---|---|---|---|
| Quadrant | BADHDUFLAG | Total packets | Discarded packets |
| A | 0 | 52 | 0 |
| B | 0 | 52 | 0 |
| C | 0 | 52 | 0 |
| D | 0 | 52 | 0 |
| Mode M0 | |||
|---|---|---|---|
| Quadrant | BADHDUFLAG | Total packets | Discarded packets |
| A | 0 | 5683 | 2 |
| B | 0 | 7016 | 1 |
| C | 0 | 5503 | 1 |
| D | 0 | 9472 | 1 |
| Quadrant | Total seconds | Saturated seconds | Saturation percentage |
|---|---|---|---|
| A | 2565 | 54 | 2.105263% |
| B | 2565 | 137 | 5.341131% |
| C | 2565 | 39 | 1.520468% |
| D | 2565 | 364 | 14.191033% |
Noise dominated data is calculated using 1-second bins in cleaned event files. If a bin has >2000 counts, and if more than 50% of those come from <1% of pixels, then it is considered to be noise-dominated and hence unusable.
| Quadrant | # 1 sec bins | Bins with >0 counts | Bins with >2000 counts | High rate bins dominated by noise | Noise dominated (total time) | Noise dominated (detector-on time) | Marked lightcurve |
|---|---|---|---|---|---|---|---|
| A | 3656 | 2566 | 0 | 0 | 0.00% | 0.00% | 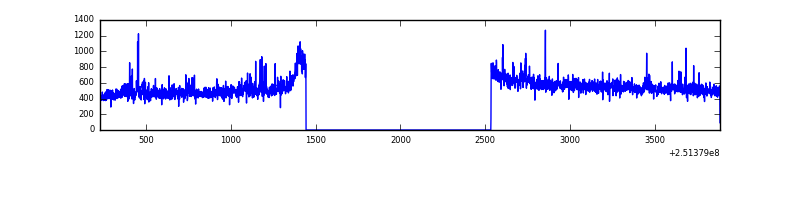 |
| B | 3656 | 2566 | 47 | 47 | 1.29% | 1.83% | 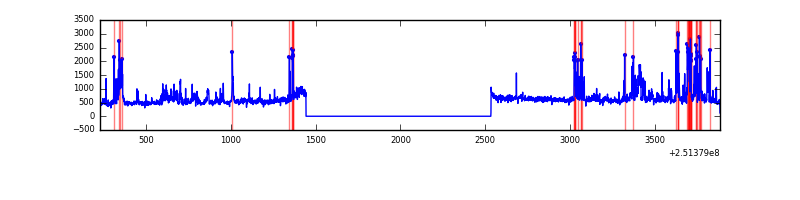 |
| C | 3656 | 2566 | 0 | 0 | 0.00% | 0.00% | 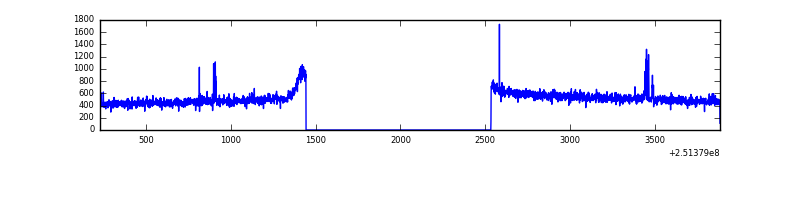 |
| D | 3656 | 2566 | 302 | 302 | 8.26% | 11.77% | 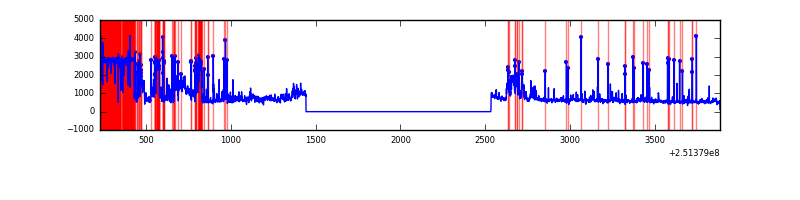 |
Top three noisy pixels from each quadrant. If the there are fewer than three noisy pixels in the level2.evt file, extra rows are filled as -1
| Pixel properties | Quadrant properties | ||||||
|---|---|---|---|---|---|---|---|
| Quadrant | DetID | PixID | Counts | Sigma | Mean | Median | Sigma |
| A | 1 | 162 | 20841 | 284.3 | 346 | 339 | 72.1 |
| A | 1 | 178 | 10058 | 134.77 | 346 | 339 | 72.1 |
| A | 1 | 161 | 8861 | 118.18 | 346 | 339 | 72.1 |
| B | 4 | 239 | 219301 | 3265.77 | 341 | 333 | 67.0 |
| B | 0 | 85 | 178951 | 2663.98 | 341 | 333 | 67.0 |
| B | 15 | 204 | 33217 | 490.44 | 341 | 333 | 67.0 |
| C | 14 | 234 | 11986 | 147.33 | 335 | 336 | 79.1 |
| C | 0 | 207 | 7189 | 86.67 | 335 | 336 | 79.1 |
| C | 13 | 61 | 2434 | 26.53 | 335 | 336 | 79.1 |
| D | 1 | 52 | 1094427 | 14472.98 | 313 | 304 | 75.6 |
| D | 8 | 195 | 137128 | 1809.9 | 313 | 304 | 75.6 |
| D | 5 | 222 | 121708 | 1605.92 | 313 | 304 | 75.6 |
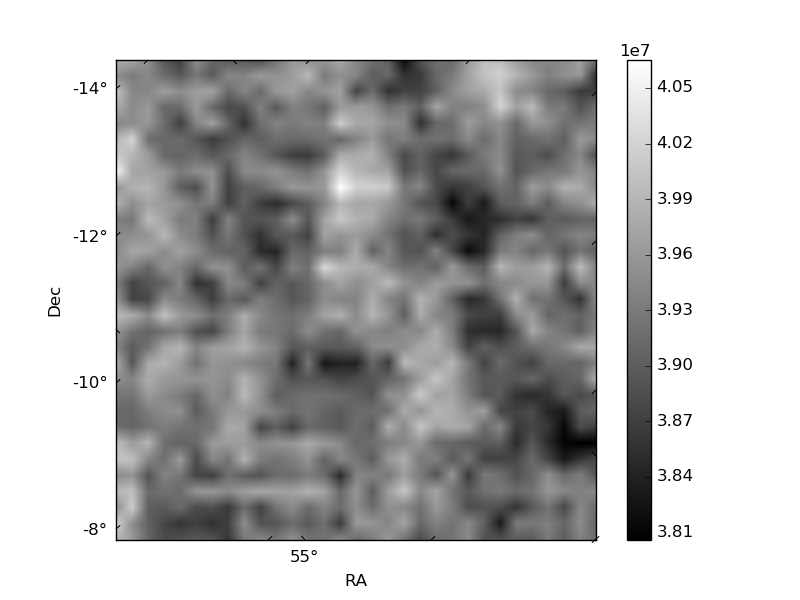
Histogram calculated using DETX and DETY for each event in the final _common_clean file
| Quadrant A | 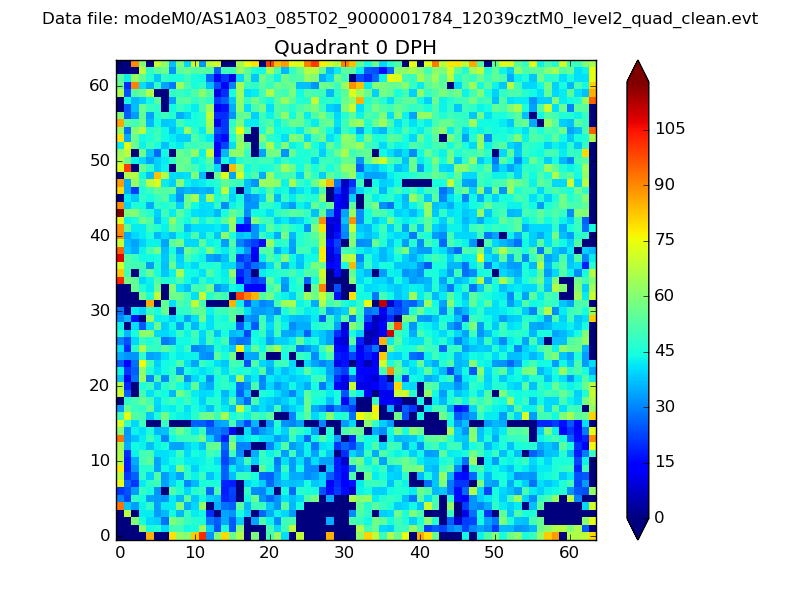 |
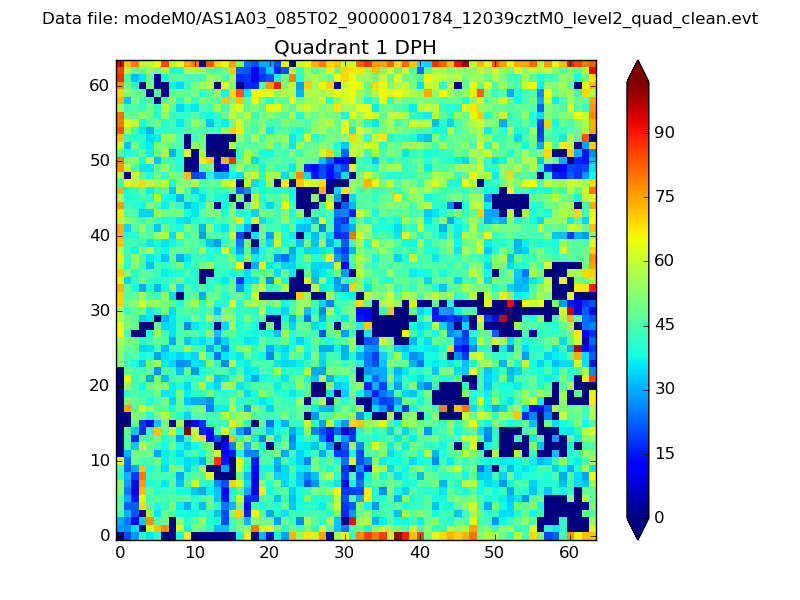 |
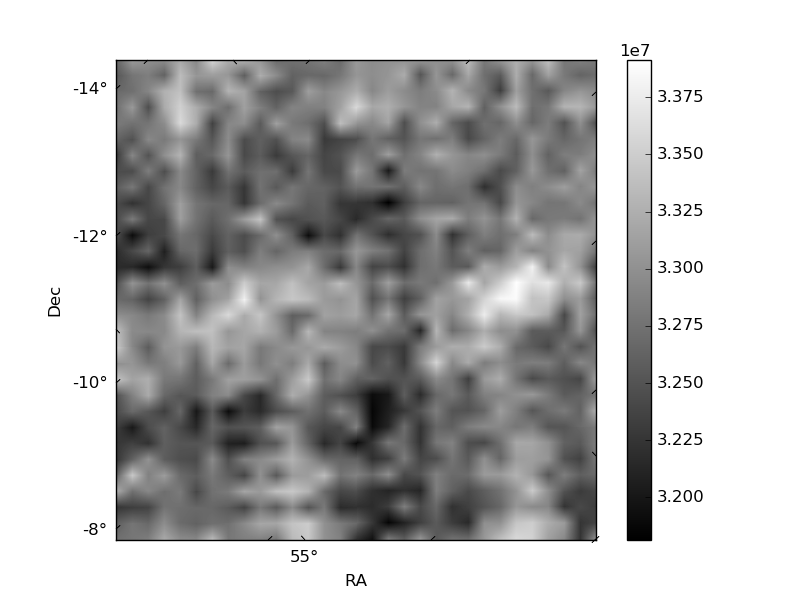
Quadrant B |
|---|---|---|---|
| Quadrant D | 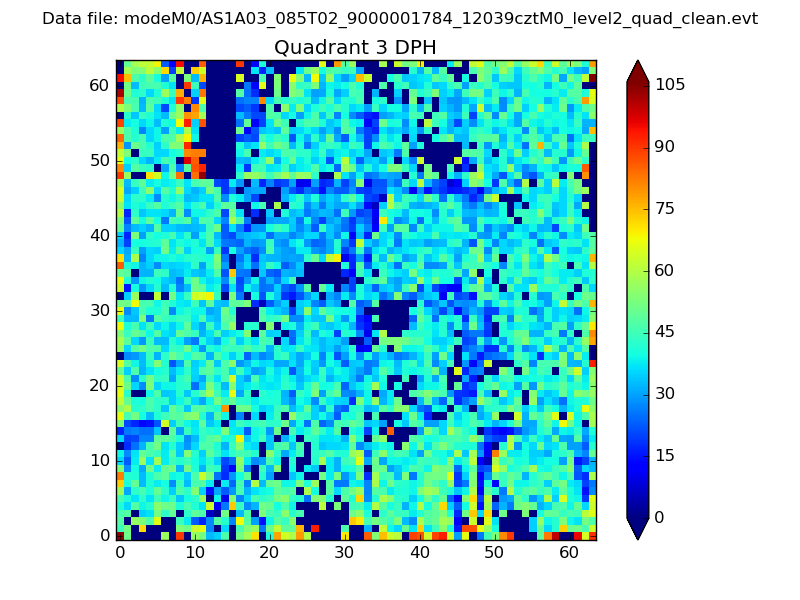 |
 |
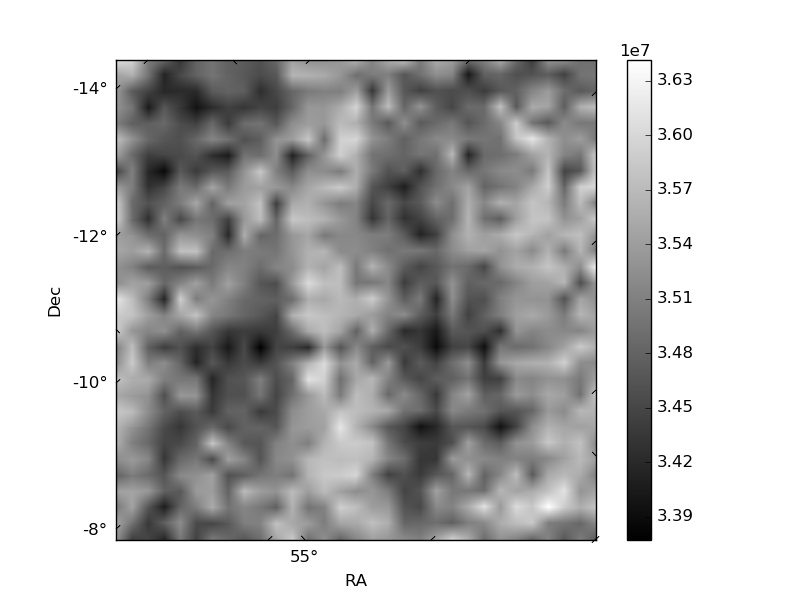
Quadrant C |
| Plot type | Count rate plots | Images |
|---|---|---|
| Comparison with Poisson distribution Blue bars denote a histogram of data divided into 1 sec bins. Red curve is a Poisson curve with rate = median count rate of data. |
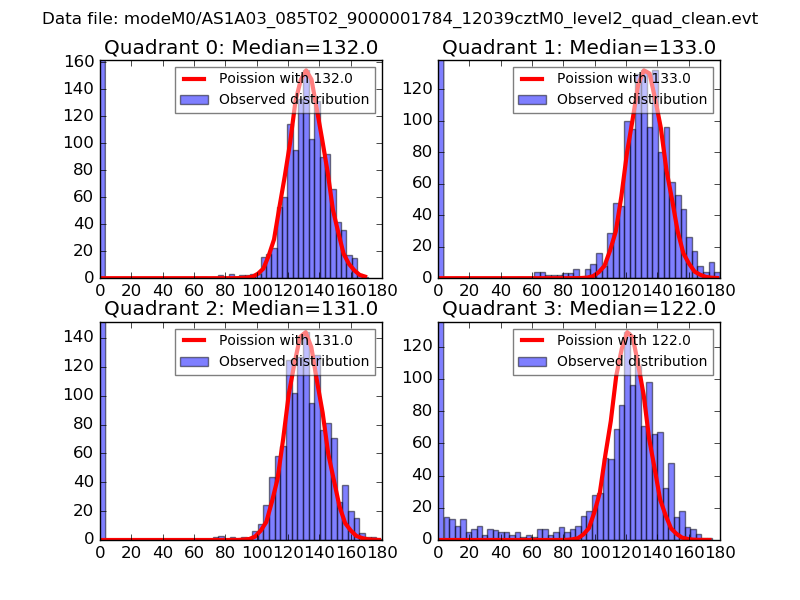 |
 |
| Quadrant-wise count rates Data is divided into 100 sec bins |
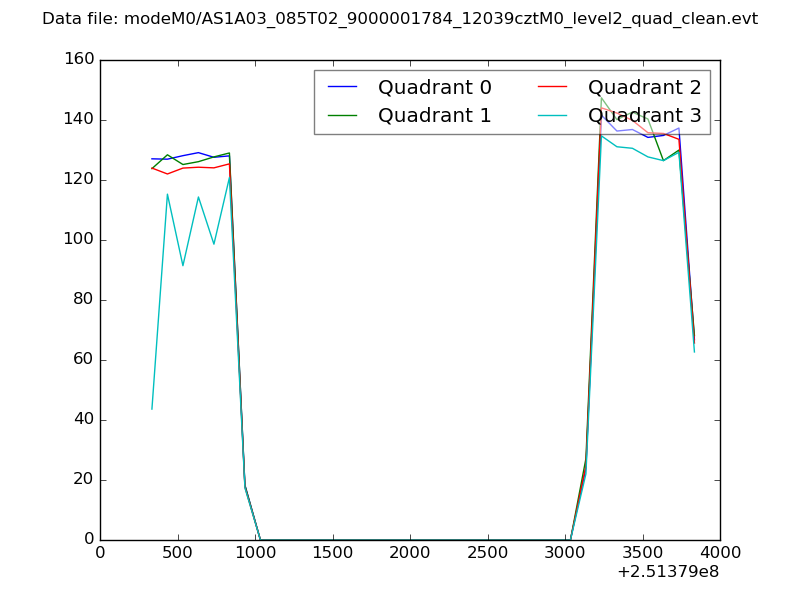 |
|
| Module-wise count rates for Quadrant A Data is divided into 100 sec bins |
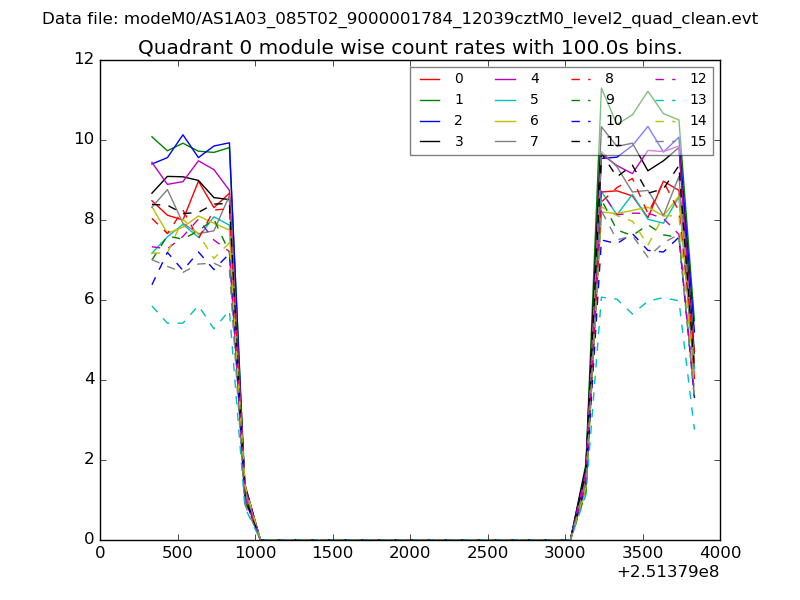 |
 |
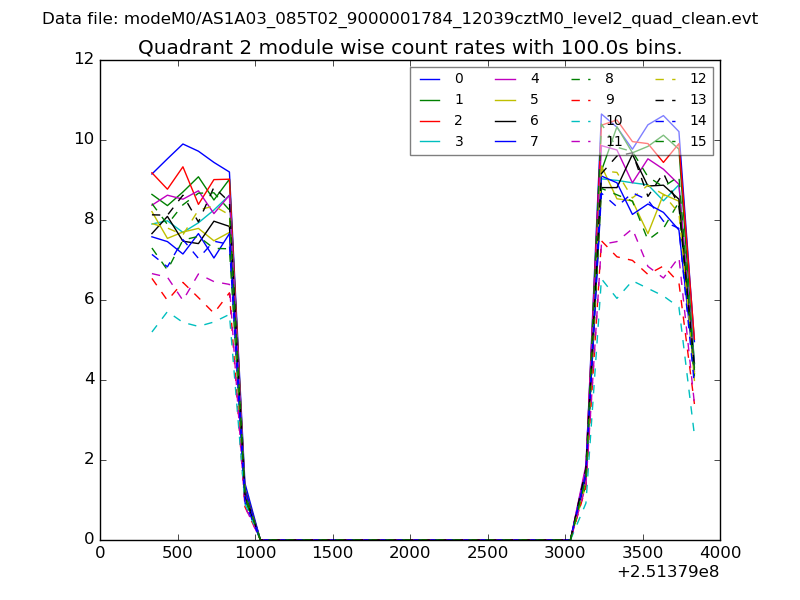
| Module-wise count rates for Quadrant B Data is divided into 100 sec bins |
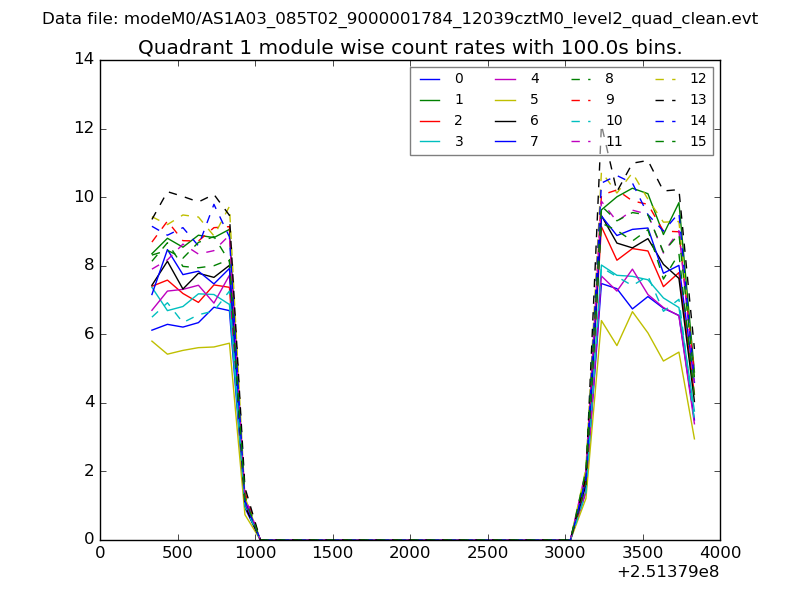 |
 |
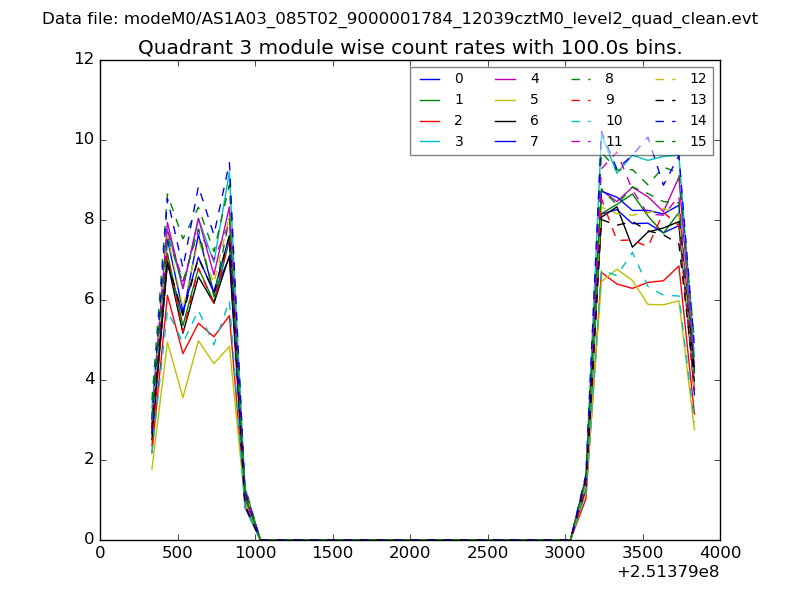
| Module-wise count rates for Quadrant C Data is divided into 100 sec bins |
 |
 |
| Module-wise count rates for Quadrant D Data is divided into 100 sec bins |
 |
 |
| Parameter | Plot |
|---|---|
| CZT HV Monitor | 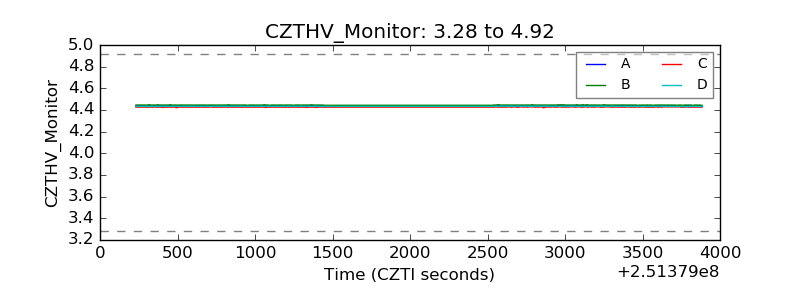 |
| D_VDD | 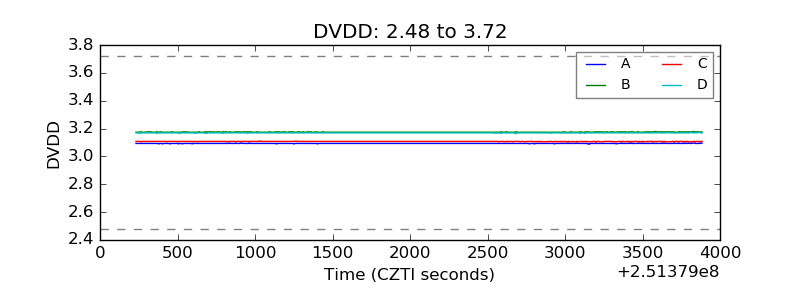 |
| Temperature 1 | 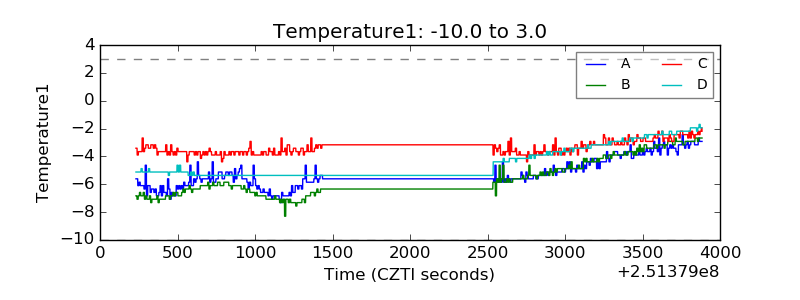 |
| Veto HV Monitor | 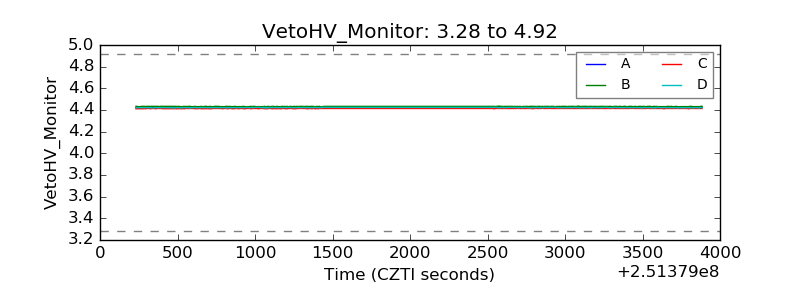 |
| Veto LLD | 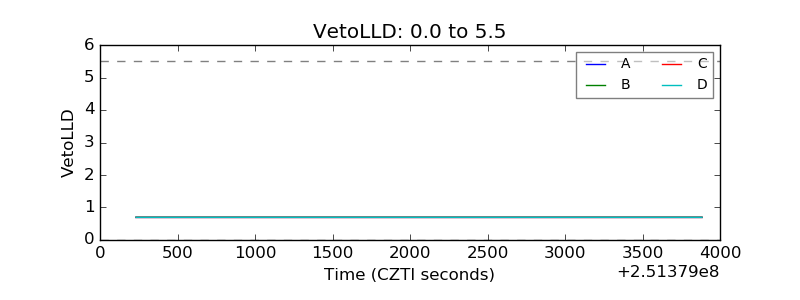 |
| Alpha Counter | 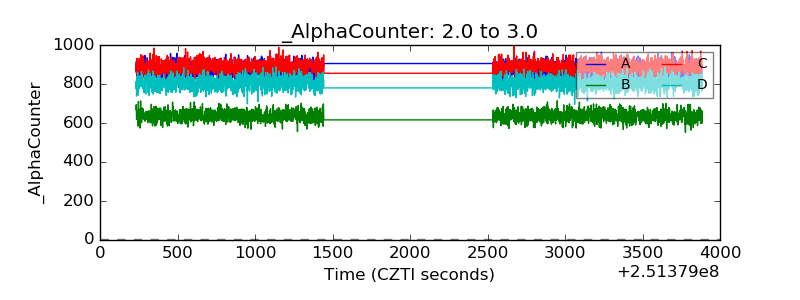 |
| _CPM_Rate | 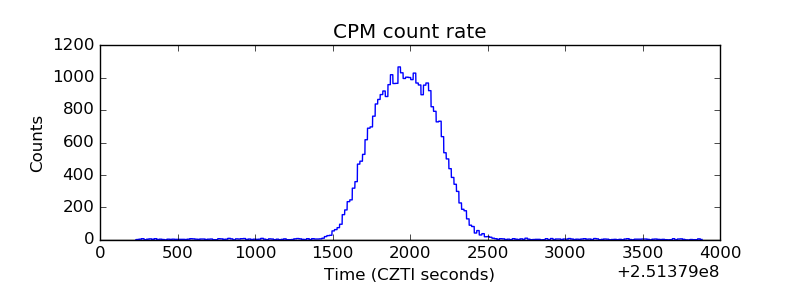 |
| CZT Counter |  |
| +2.5 Volts monitor |  |
| +5 Volts monitor |  |
| _ROLL_ROT | 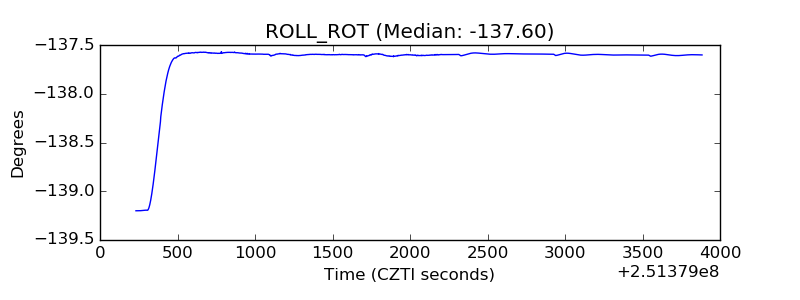 |
| _Roll_DEC | 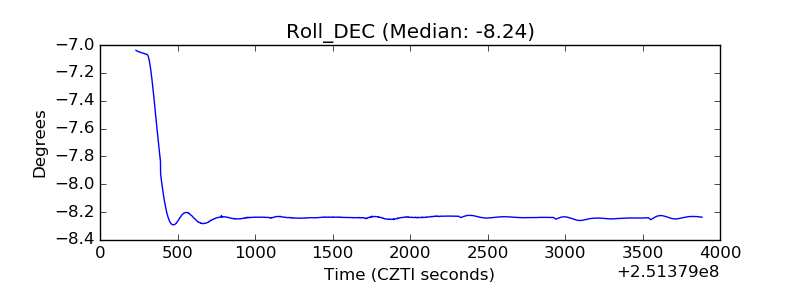 |
| _Roll_RA | 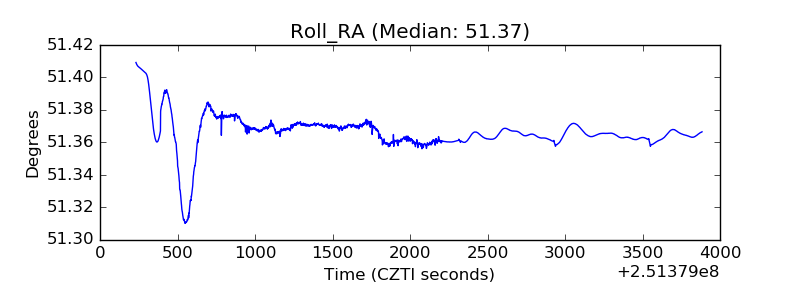 |
| Veto Counter | 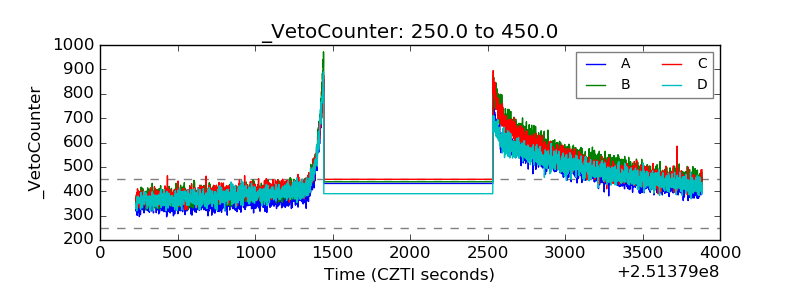 |