| Param | Original file | Final file |
|---|---|---|
| Filename | modeM0/AS1A03_085T02_9000001784_12040cztM0_level2.evt | modeM0/AS1A03_085T02_9000001784_12040cztM0_level2_quad_clean.evt |
| Size (bytes) | 764,352,000 | 88,704,000 |
| Size | 728.9 MB | 84.6 MB |
| Events in quadrant A | 3,385,383 | 631,549 |
| Events in quadrant B | 6,163,413 | 579,574 |
| Events in quadrant C | 3,152,612 | 615,069 |
| Events in quadrant D | 10,011,276 | 408,923 |
| Mode M9 | |||
|---|---|---|---|
| Quadrant | BADHDUFLAG | Total packets | Discarded packets |
| A | 0 | 11 | 0 |
| B | 0 | 11 | 0 |
| C | 0 | 11 | 0 |
| D | 0 | 12 | 0 |
| Mode SS | |||
|---|---|---|---|
| Quadrant | BADHDUFLAG | Total packets | Discarded packets |
| A | 0 | 132 | 0 |
| B | 0 | 132 | 0 |
| C | 0 | 132 | 0 |
| D | 0 | 132 | 0 |
| Mode M0 | |||
|---|---|---|---|
| Quadrant | BADHDUFLAG | Total packets | Discarded packets |
| A | 0 | 14291 | 3 |
| B | 0 | 22874 | 2 |
| C | 0 | 13672 | 2 |
| D | 0 | 34085 | 2 |
| Quadrant | Total seconds | Saturated seconds | Saturation percentage |
|---|---|---|---|
| A | 6445 | 82 | 1.272304% |
| B | 6445 | 1033 | 16.027929% |
| C | 6445 | 47 | 0.729247% |
| D | 6445 | 2711 | 42.063615% |
Noise dominated data is calculated using 1-second bins in cleaned event files. If a bin has >2000 counts, and if more than 50% of those come from <1% of pixels, then it is considered to be noise-dominated and hence unusable.
| Quadrant | # 1 sec bins | Bins with >0 counts | Bins with >2000 counts | High rate bins dominated by noise | Noise dominated (total time) | Noise dominated (detector-on time) | Marked lightcurve |
|---|---|---|---|---|---|---|---|
| A | 7616 | 6446 | 0 | 0 | 0.00% | 0.00% | 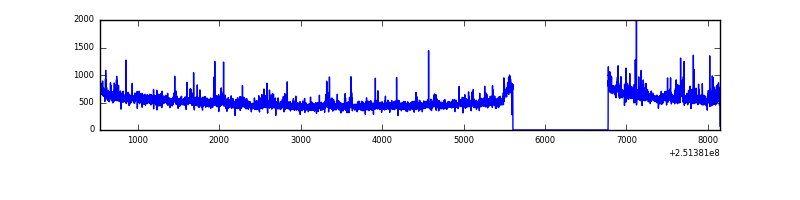 |
| B | 7616 | 6446 | 755 | 755 | 9.91% | 11.71% | 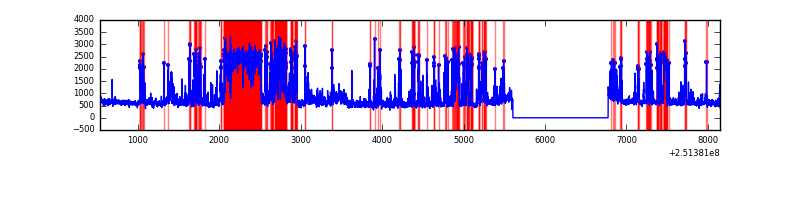 |
| C | 7616 | 6446 | 1 | 1 | 0.01% | 0.02% | 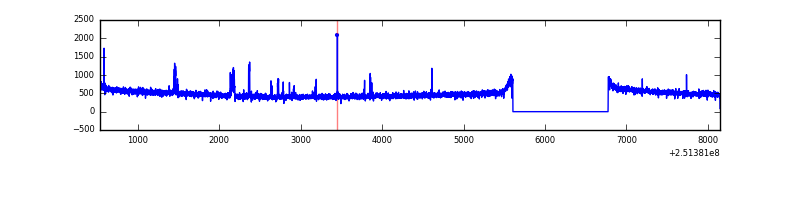 |
| D | 7616 | 6446 | 2596 | 2596 | 34.09% | 40.27% | 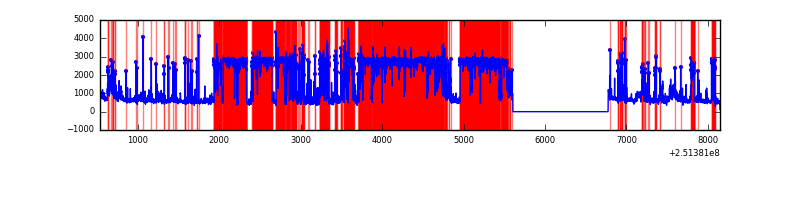 |
Top three noisy pixels from each quadrant. If the there are fewer than three noisy pixels in the level2.evt file, extra rows are filled as -1
| Pixel properties | Quadrant properties | ||||||
|---|---|---|---|---|---|---|---|
| Quadrant | DetID | PixID | Counts | Sigma | Mean | Median | Sigma |
| A | 1 | 162 | 46122 | 267.08 | 836 | 820 | 169.6 |
| A | 1 | 178 | 24033 | 136.85 | 836 | 820 | 169.6 |
| A | 5 | 112 | 22180 | 125.93 | 836 | 820 | 169.6 |
| B | 0 | 85 | 1472151 | 9835.79 | 786 | 767 | 149.6 |
| B | 4 | 239 | 1123911 | 7507.9 | 786 | 767 | 149.6 |
| B | 15 | 204 | 211006 | 1405.39 | 786 | 767 | 149.6 |
| C | 0 | 207 | 40607 | 217.09 | 793 | 796 | 183.4 |
| C | 14 | 234 | 22063 | 115.97 | 793 | 796 | 183.4 |
| C | 13 | 61 | 5798 | 27.28 | 793 | 796 | 183.4 |
| D | 1 | 52 | 7369537 | 51959.76 | 595 | 579 | 141.8 |
| D | 8 | 195 | 169498 | 1191.08 | 595 | 579 | 141.8 |
| D | 13 | 104 | 84727 | 593.34 | 595 | 579 | 141.8 |
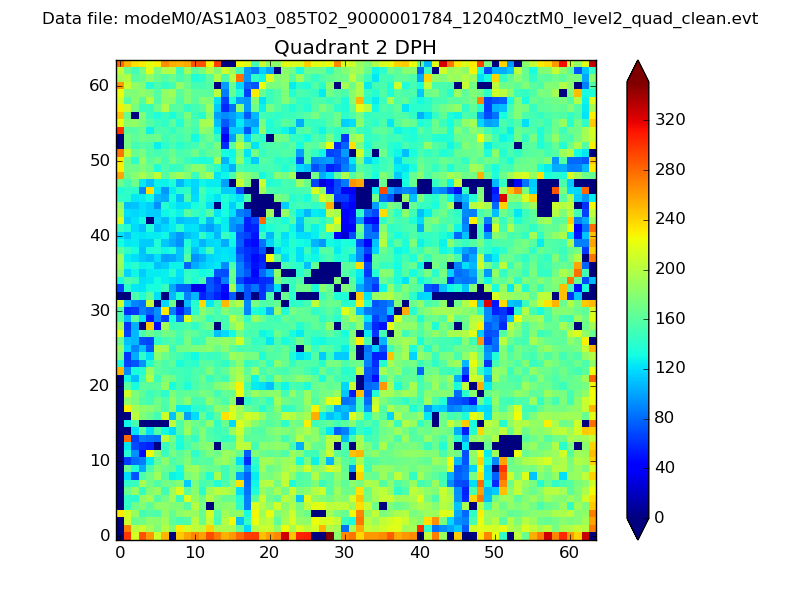
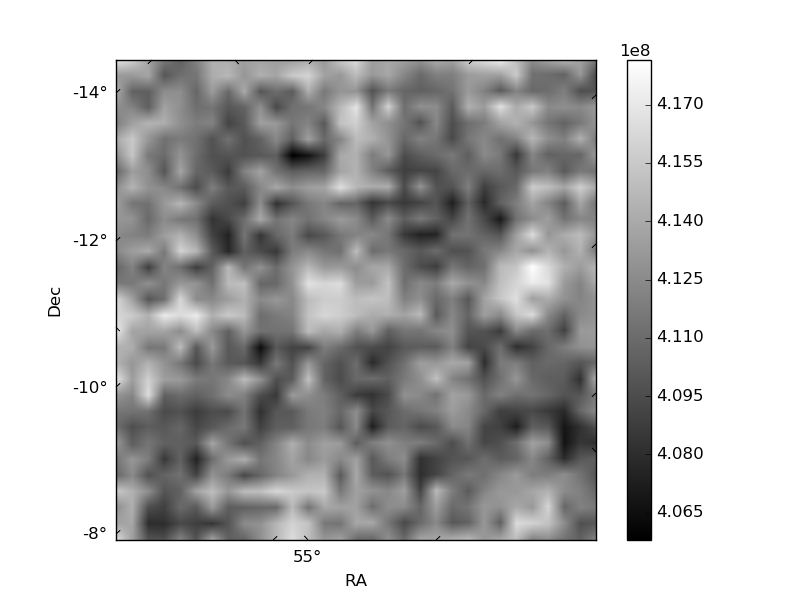
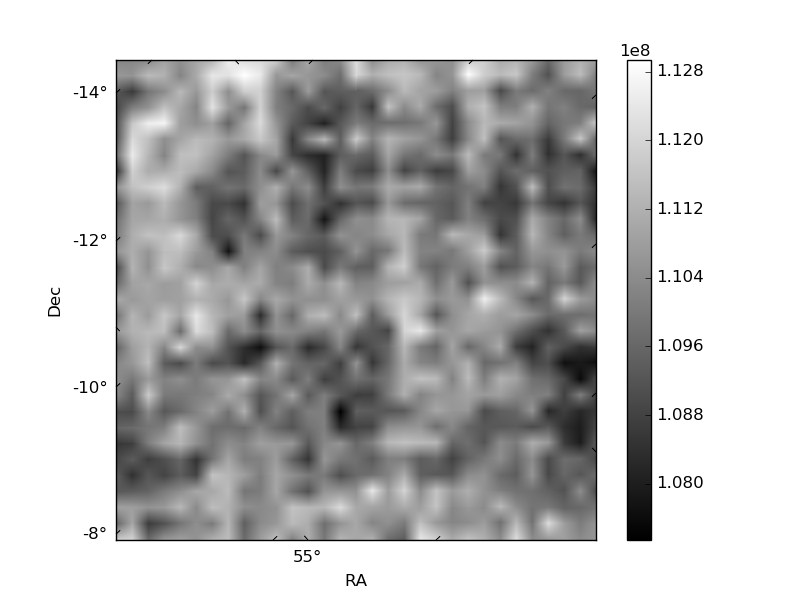
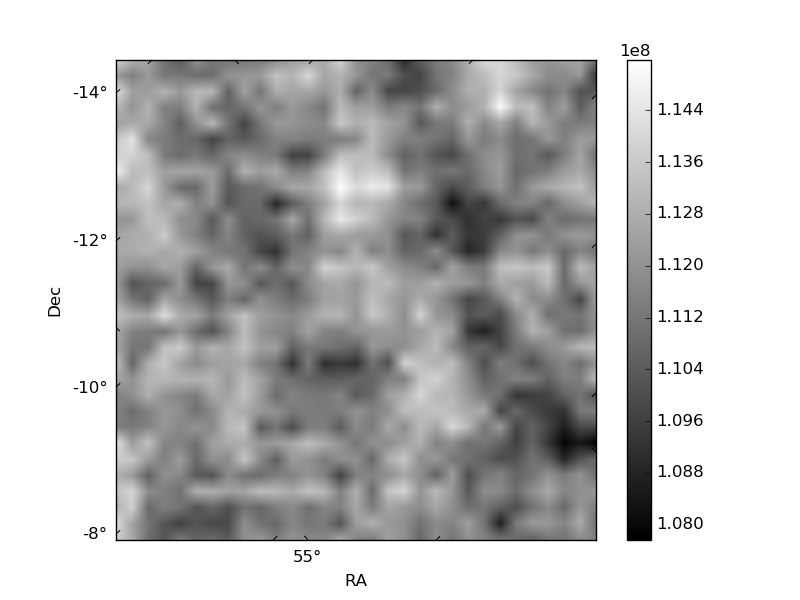
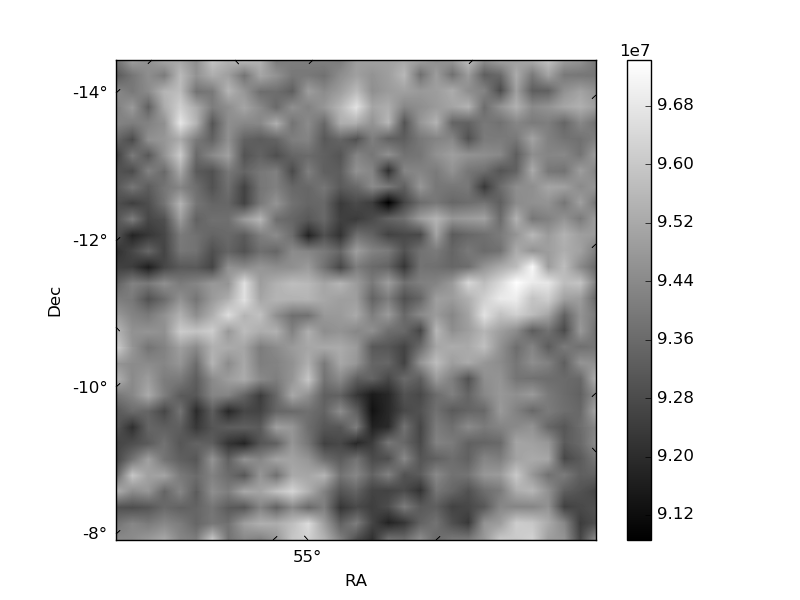
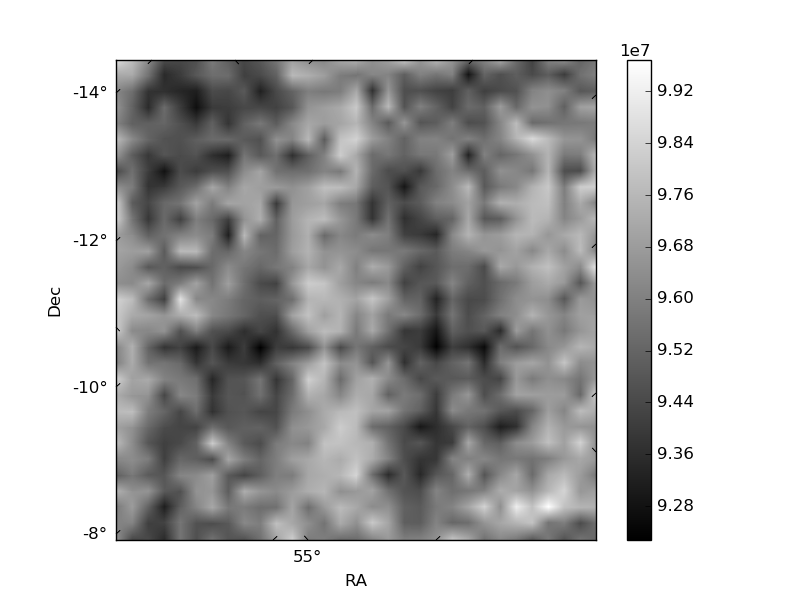
Histogram calculated using DETX and DETY for each event in the final _common_clean file
| Quadrant A | 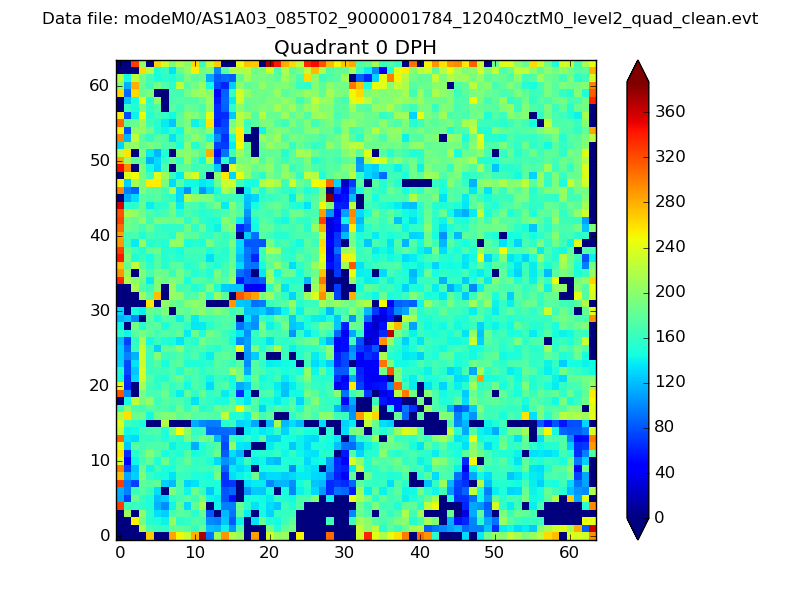 |
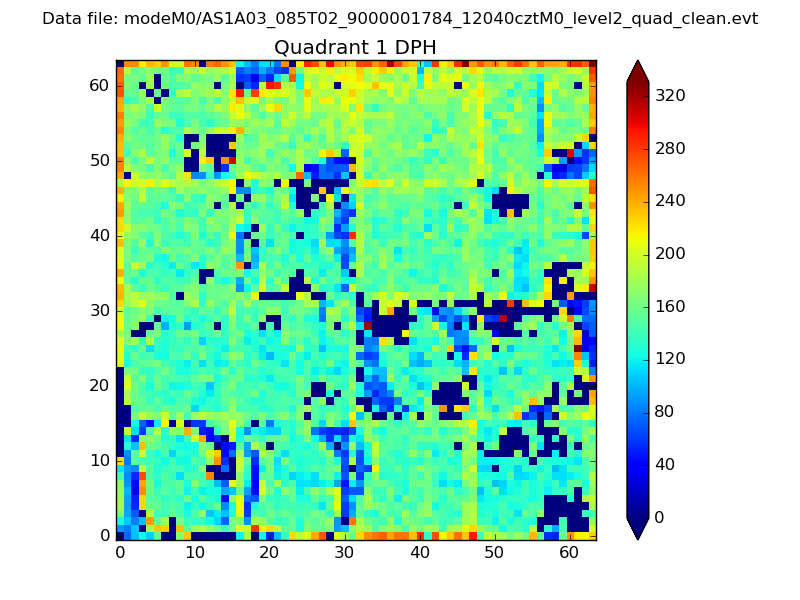 |
Quadrant B |
|---|---|---|---|
| Quadrant D | 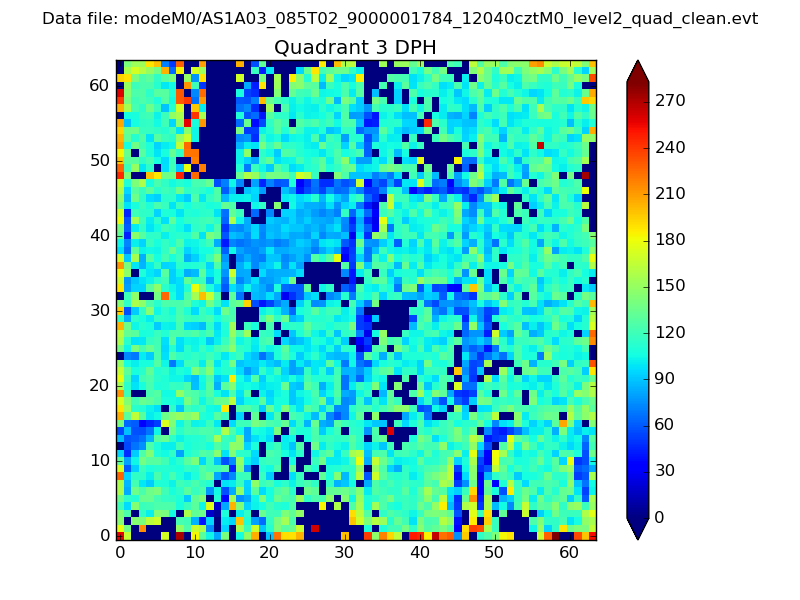 |
 |
Quadrant C |
| Plot type | Count rate plots | Images |
|---|---|---|
| Comparison with Poisson distribution Blue bars denote a histogram of data divided into 1 sec bins. Red curve is a Poisson curve with rate = median count rate of data. |
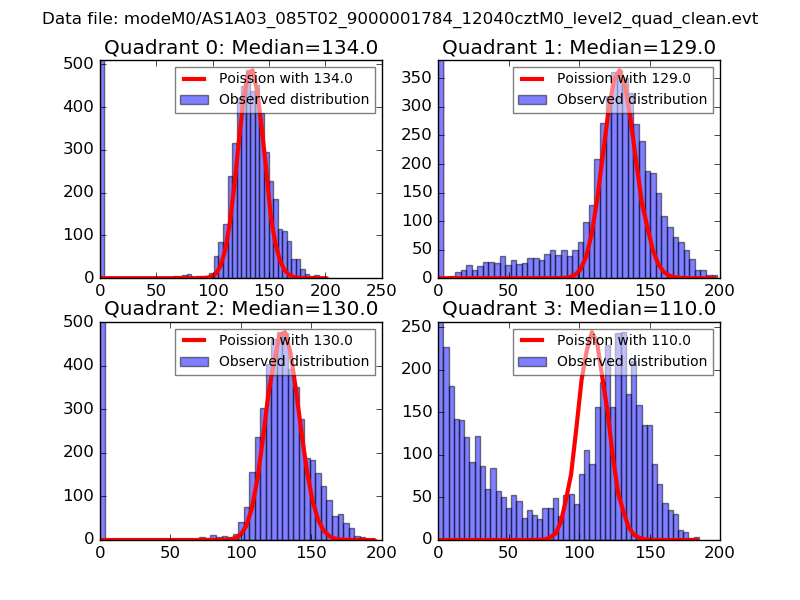 |
 |
| Quadrant-wise count rates Data is divided into 100 sec bins |
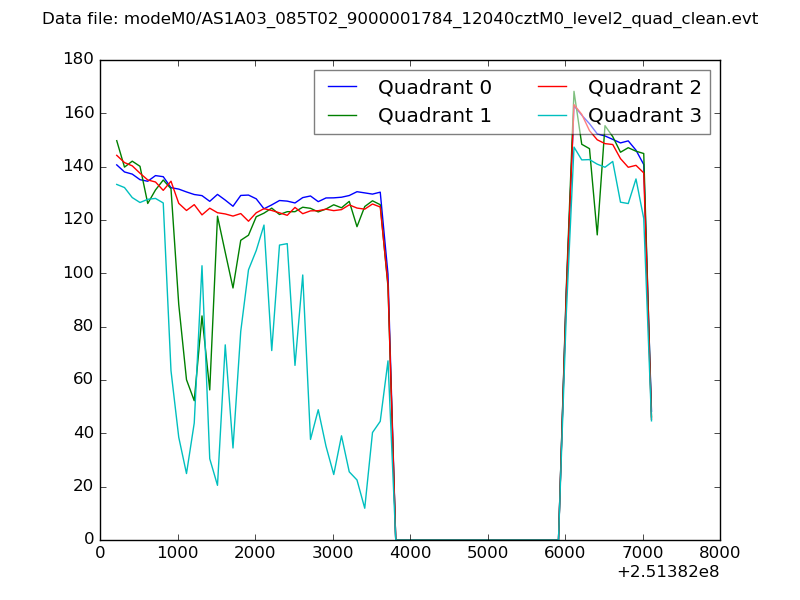 |
|
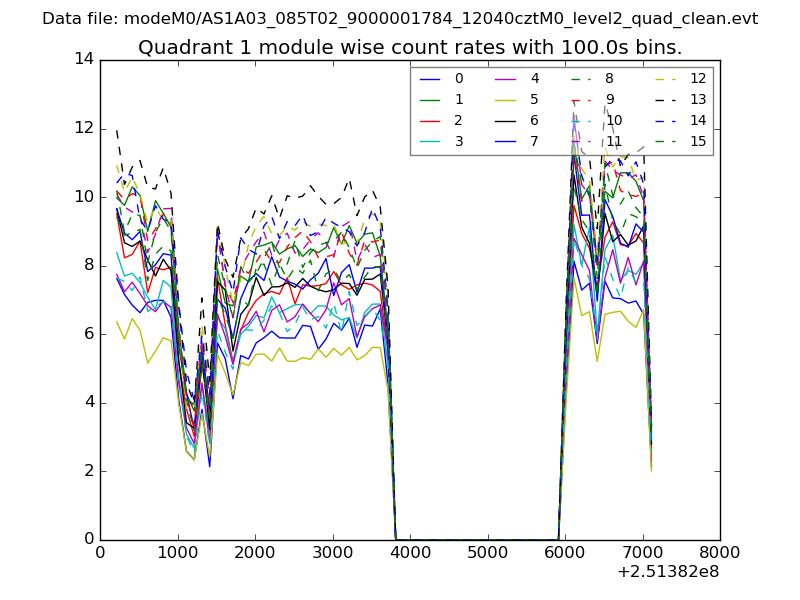
| Module-wise count rates for Quadrant A Data is divided into 100 sec bins |
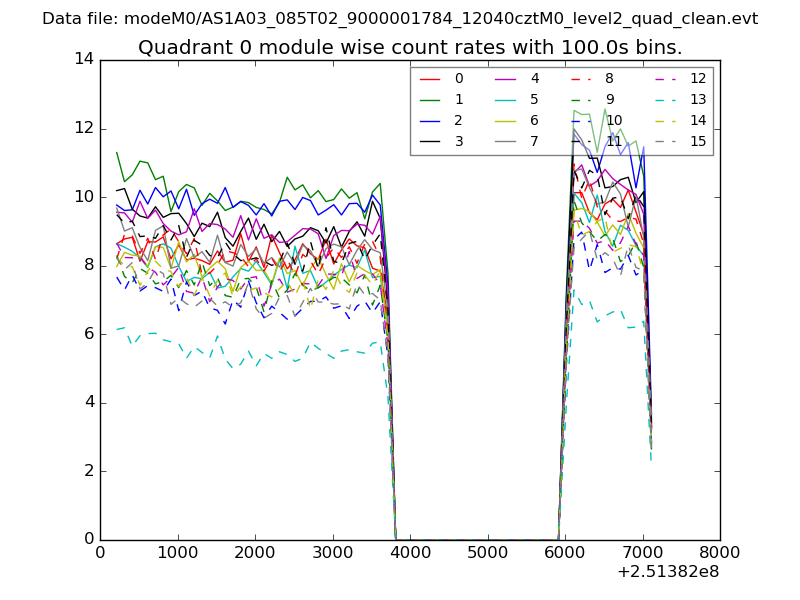 |
 |
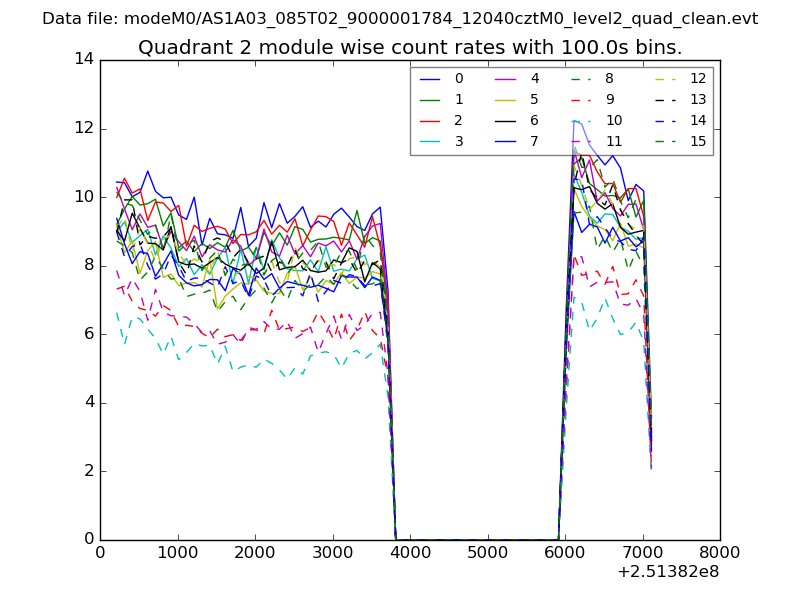
| Module-wise count rates for Quadrant B Data is divided into 100 sec bins |
 |
 |
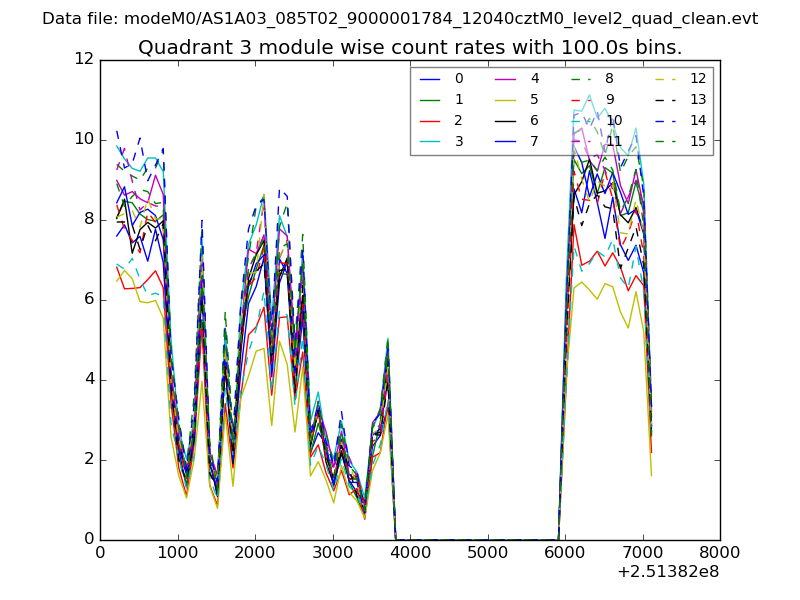
| Module-wise count rates for Quadrant C Data is divided into 100 sec bins |
 |
 |
| Module-wise count rates for Quadrant D Data is divided into 100 sec bins |
 |
 |
| Parameter | Plot |
|---|---|
| CZT HV Monitor | 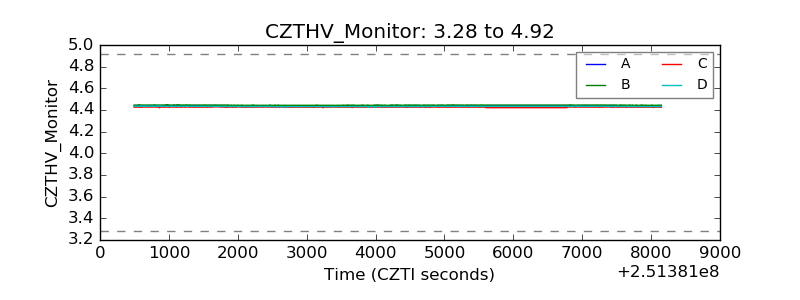 |
| D_VDD | 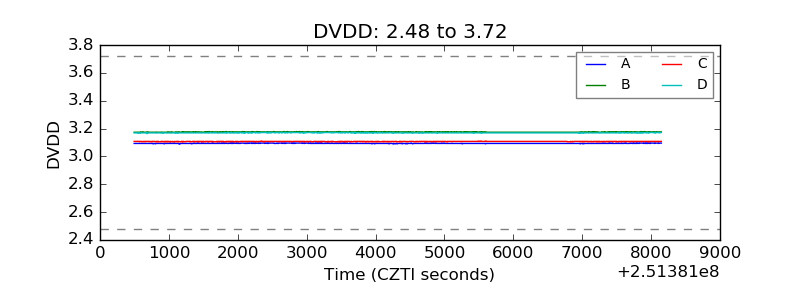 |
| Temperature 1 | 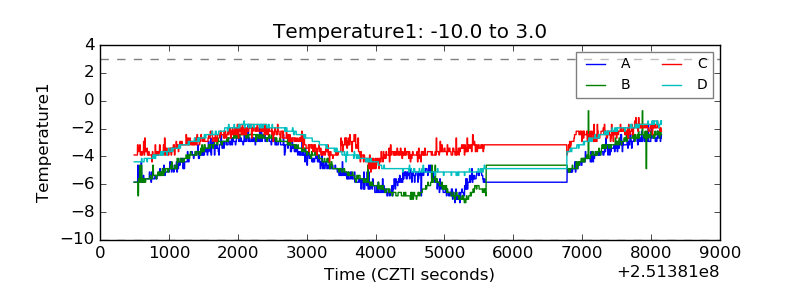 |
| Veto HV Monitor | 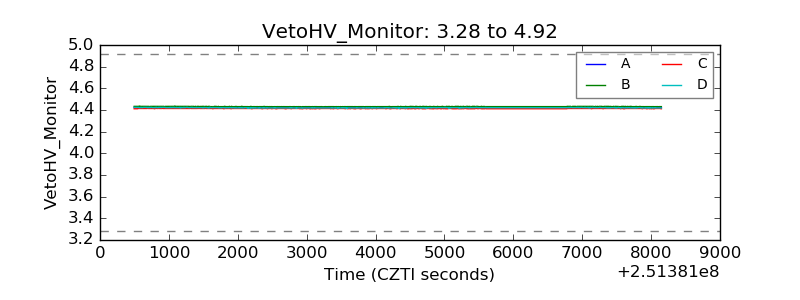 |
| Veto LLD | 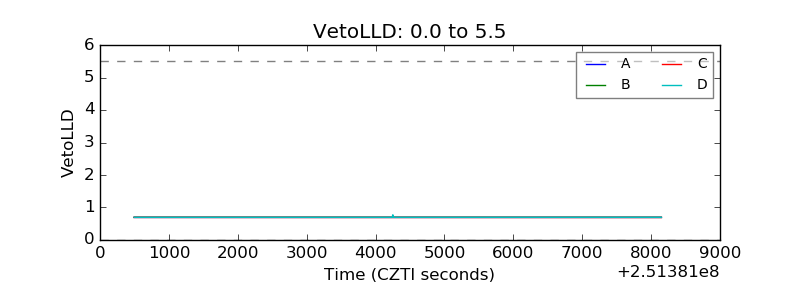 |
| Alpha Counter | 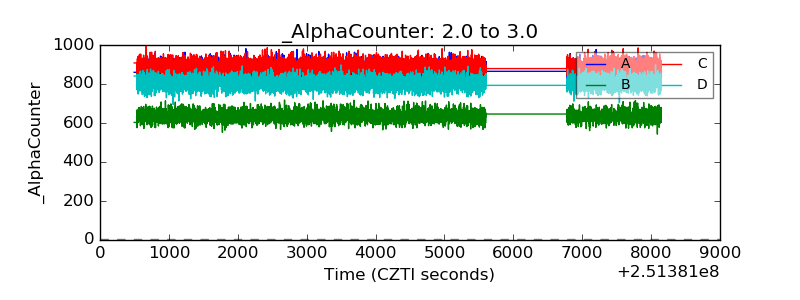 |
| _CPM_Rate | 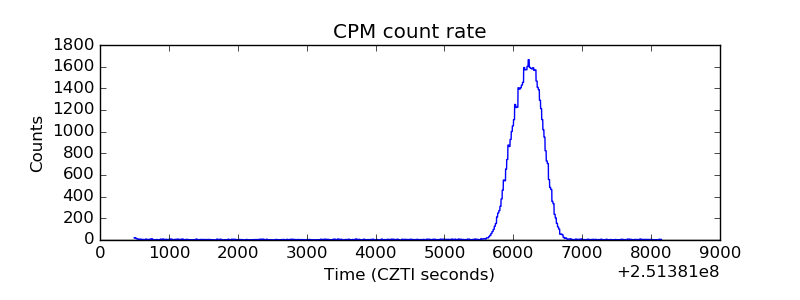 |
| CZT Counter | 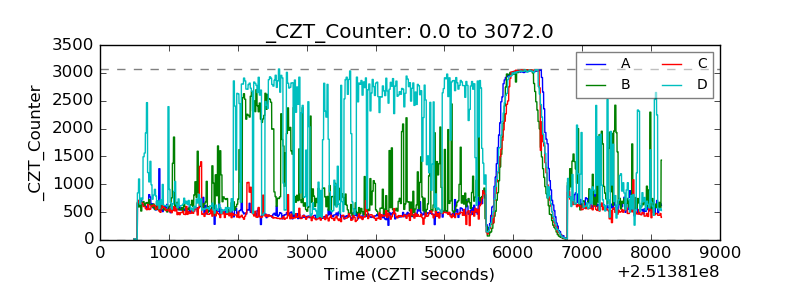 |
| +2.5 Volts monitor | 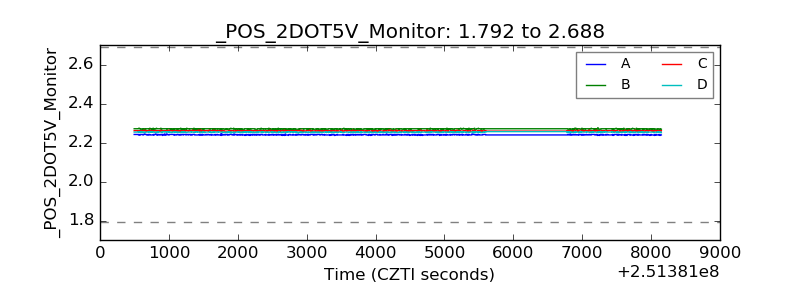 |
| +5 Volts monitor | 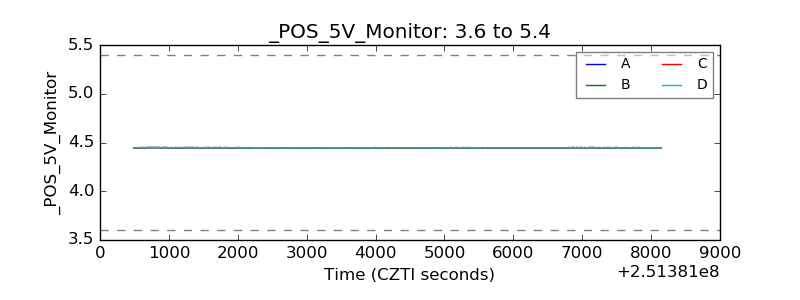 |
| _ROLL_ROT | 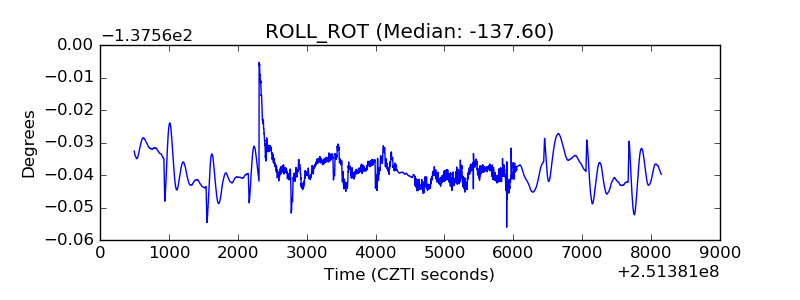 |
| _Roll_DEC | 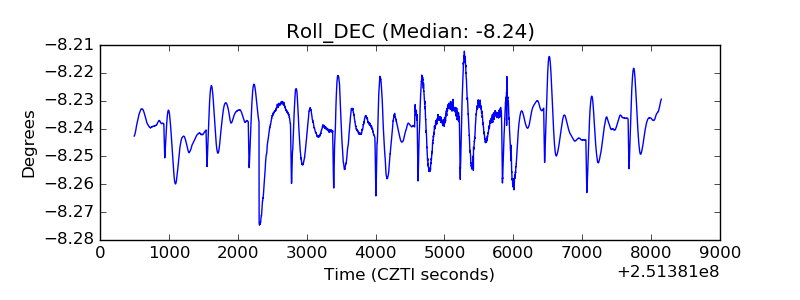 |
| _Roll_RA | 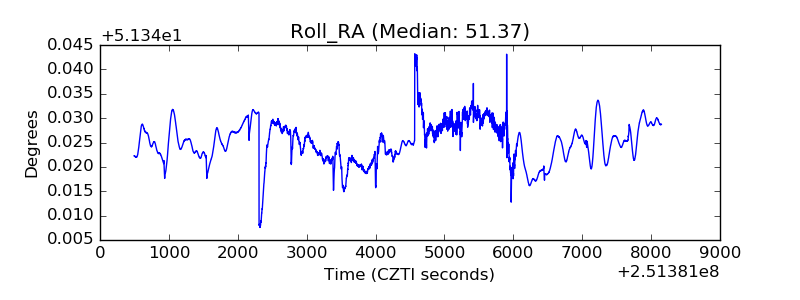 |
| Veto Counter | 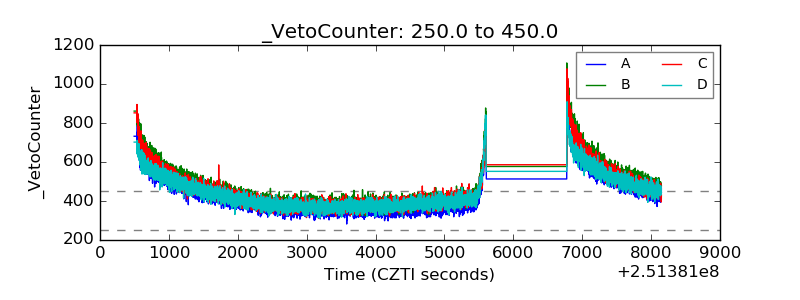 |