| Param | Original file | Final file |
|---|---|---|
| Filename | modeM0/AS1A03_085T02_9000001784_12042cztM0_level2.evt | modeM0/AS1A03_085T02_9000001784_12042cztM0_level2_quad_clean.evt |
| Size (bytes) | 544,705,920 | 112,248,000 |
| Size | 519.5 MB | 107.0 MB |
| Events in quadrant A | 3,720,039 | 754,152 |
| Events in quadrant B | 5,105,331 | 744,270 |
| Events in quadrant C | 3,279,819 | 729,242 |
| Events in quadrant D | 3,934,422 | 702,196 |
| Mode M9 | |||
|---|---|---|---|
| Quadrant | BADHDUFLAG | Total packets | Discarded packets |
| A | 0 | 26 | 0 |
| B | 0 | 26 | 0 |
| C | 0 | 26 | 0 |
| D | 0 | 26 | 0 |
| Mode SS | |||
|---|---|---|---|
| Quadrant | BADHDUFLAG | Total packets | Discarded packets |
| A | 0 | 140 | 0 |
| B | 0 | 140 | 0 |
| C | 0 | 140 | 0 |
| D | 0 | 140 | 0 |
| Mode M0 | |||
|---|---|---|---|
| Quadrant | BADHDUFLAG | Total packets | Discarded packets |
| A | 0 | 15423 | 3 |
| B | 0 | 19951 | 2 |
| C | 0 | 14186 | 2 |
| D | 0 | 16032 | 2 |
| Quadrant | Total seconds | Saturated seconds | Saturation percentage |
|---|---|---|---|
| A | 6735 | 156 | 2.316258% |
| B | 6735 | 450 | 6.681514% |
| C | 6735 | 44 | 0.653304% |
| D | 6735 | 100 | 1.484781% |
Noise dominated data is calculated using 1-second bins in cleaned event files. If a bin has >2000 counts, and if more than 50% of those come from <1% of pixels, then it is considered to be noise-dominated and hence unusable.
| Quadrant | # 1 sec bins | Bins with >0 counts | Bins with >2000 counts | High rate bins dominated by noise | Noise dominated (total time) | Noise dominated (detector-on time) | Marked lightcurve |
|---|---|---|---|---|---|---|---|
| A | 9326 | 6738 | 16 | 16 | 0.17% | 0.24% |  |
| B | 9326 | 6737 | 177 | 177 | 1.90% | 2.63% | 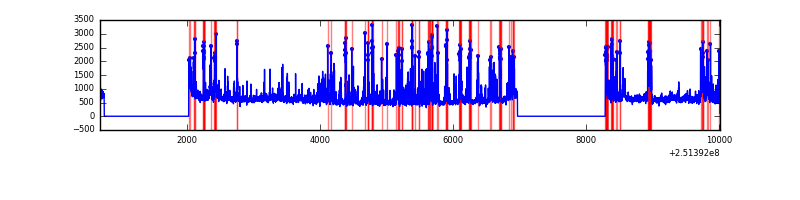 |
| C | 9326 | 6737 | 2 | 2 | 0.02% | 0.03% | 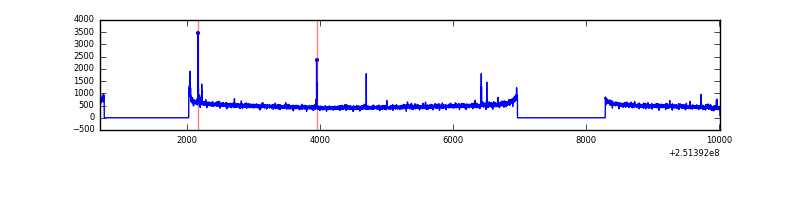 |
| D | 9326 | 6737 | 35 | 35 | 0.38% | 0.52% |  |
Top three noisy pixels from each quadrant. If the there are fewer than three noisy pixels in the level2.evt file, extra rows are filled as -1
| Pixel properties | Quadrant properties | ||||||
|---|---|---|---|---|---|---|---|
| Quadrant | DetID | PixID | Counts | Sigma | Mean | Median | Sigma |
| A | 1 | 162 | 106716 | 599.28 | 875 | 862 | 176.6 |
| A | 1 | 178 | 53588 | 298.5 | 875 | 862 | 176.6 |
| A | 1 | 161 | 47034 | 261.4 | 875 | 862 | 176.6 |
| B | 4 | 239 | 1156579 | 7047.92 | 858 | 840 | 164.0 |
| B | 4 | 206 | 189158 | 1148.4 | 858 | 840 | 164.0 |
| B | 15 | 204 | 157330 | 954.31 | 858 | 840 | 164.0 |
| C | 14 | 234 | 41054 | 210.34 | 830 | 839 | 191.2 |
| C | 13 | 61 | 6030 | 27.15 | 830 | 839 | 191.2 |
| C | 3 | 202 | 2003 | 6.09 | 830 | 839 | 191.2 |
| D | 1 | 52 | 315848 | 1590.94 | 833 | 810 | 198.0 |
| D | 8 | 195 | 241512 | 1215.54 | 833 | 810 | 198.0 |
| D | 13 | 104 | 99913 | 500.47 | 833 | 810 | 198.0 |
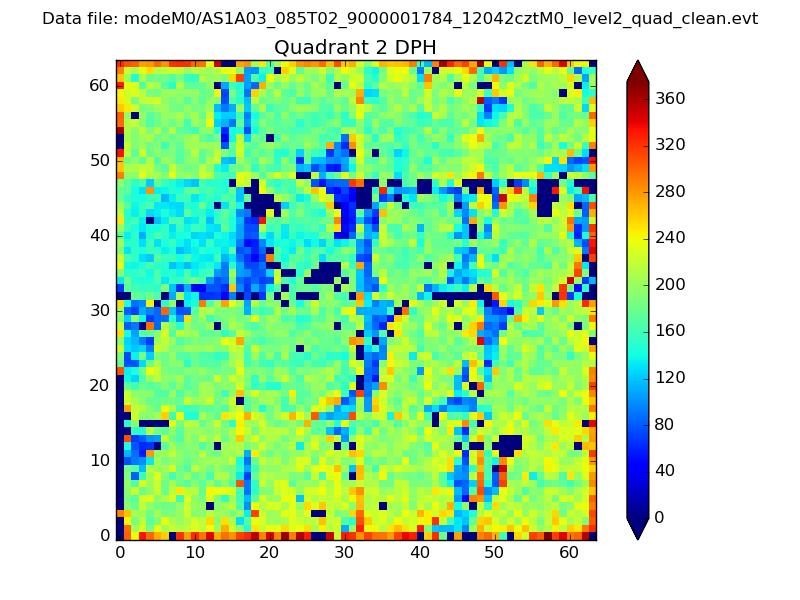
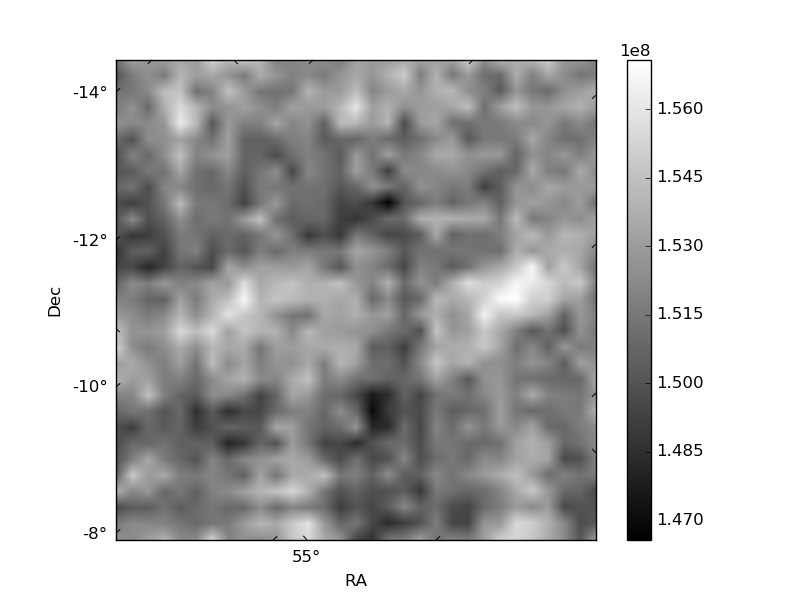
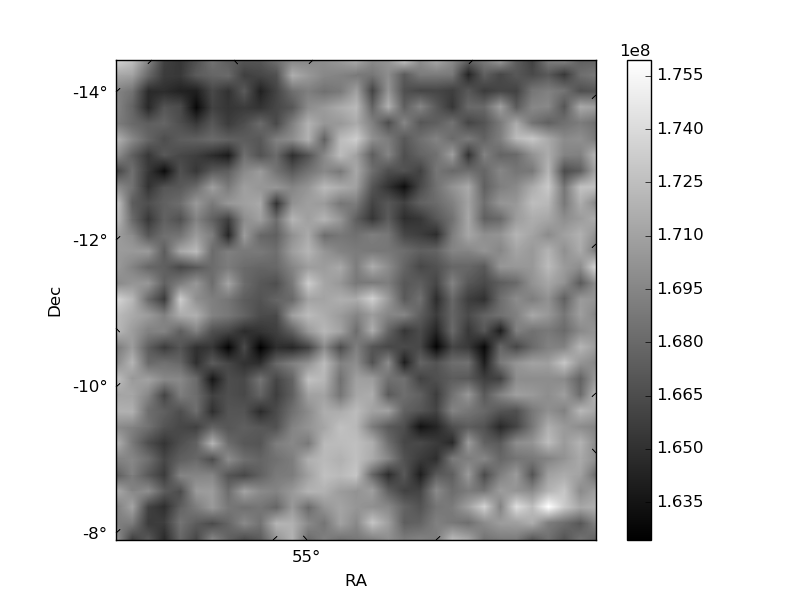
Histogram calculated using DETX and DETY for each event in the final _common_clean file
| Quadrant A | 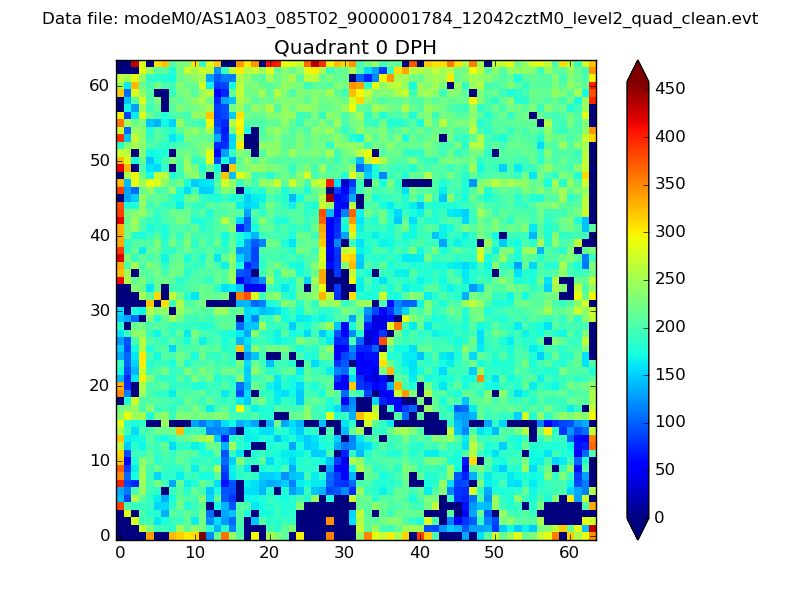 |
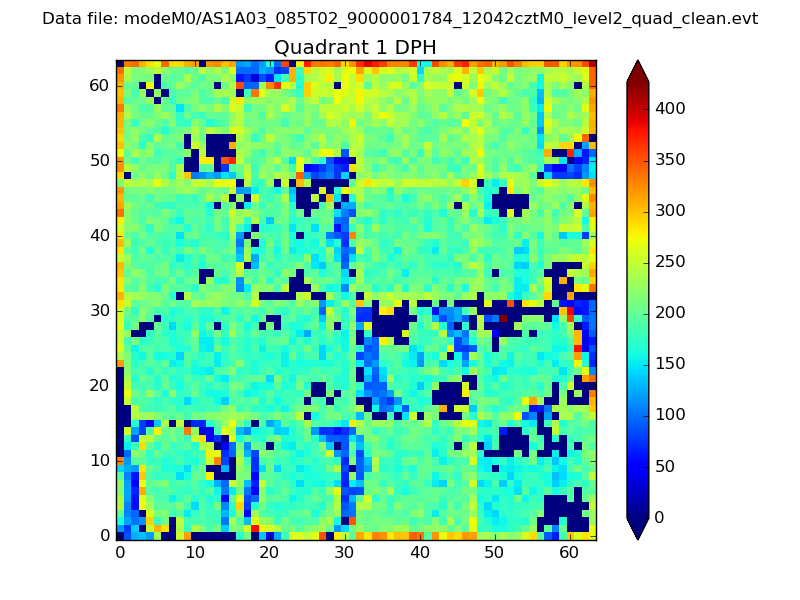 |
Quadrant B |
|---|---|---|---|
| Quadrant D | 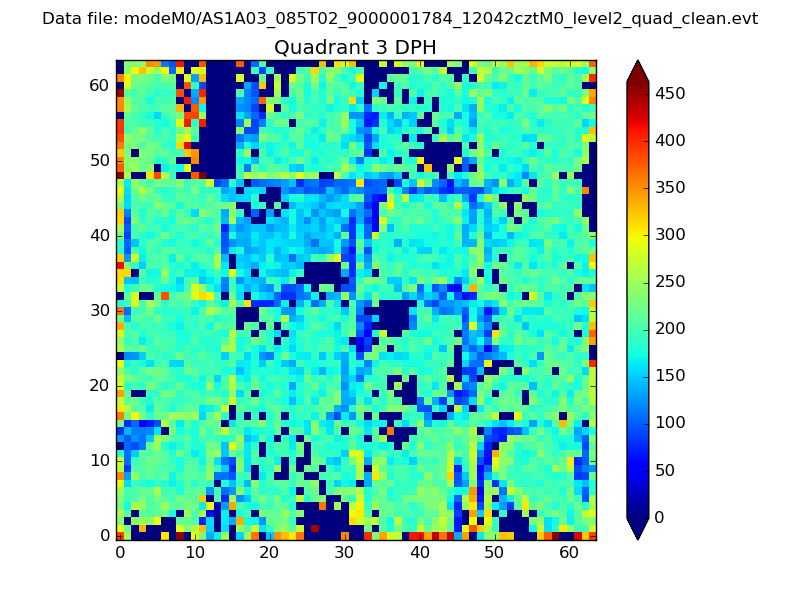 |
 |
Quadrant C |
| Plot type | Count rate plots | Images |
|---|---|---|
| Comparison with Poisson distribution Blue bars denote a histogram of data divided into 1 sec bins. Red curve is a Poisson curve with rate = median count rate of data. |
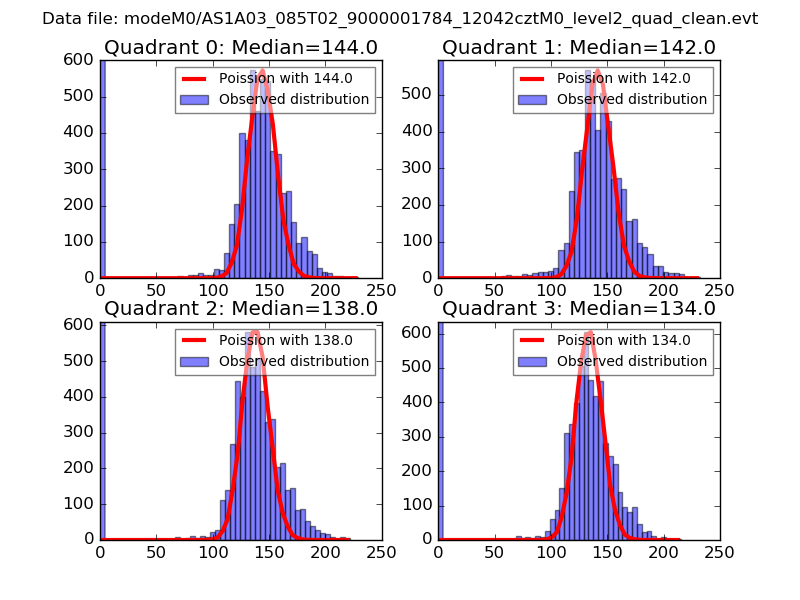 |
 |
| Quadrant-wise count rates Data is divided into 100 sec bins |
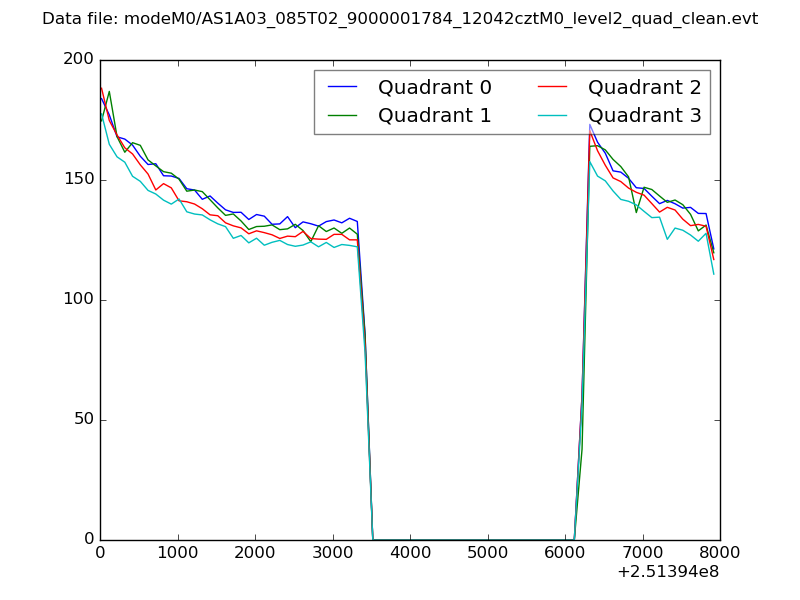 |
|
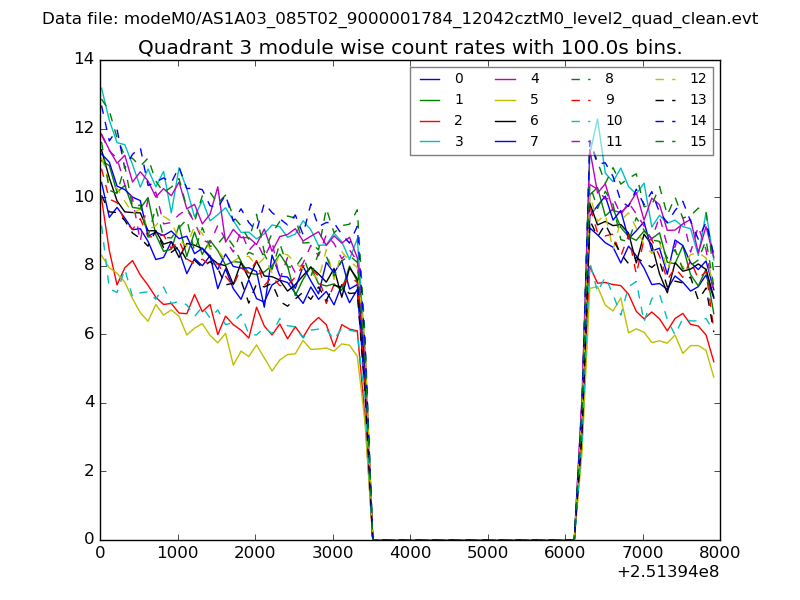
| Module-wise count rates for Quadrant A Data is divided into 100 sec bins |
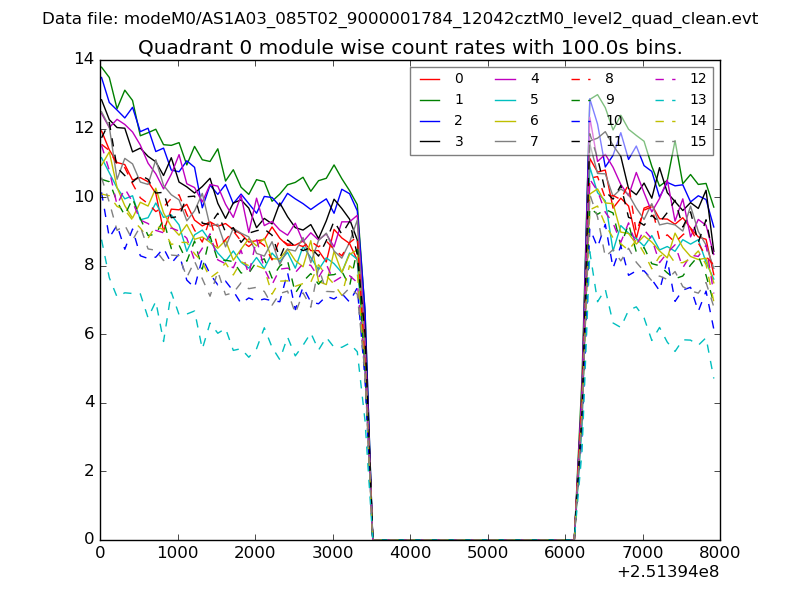 |
 |
| Module-wise count rates for Quadrant B Data is divided into 100 sec bins |
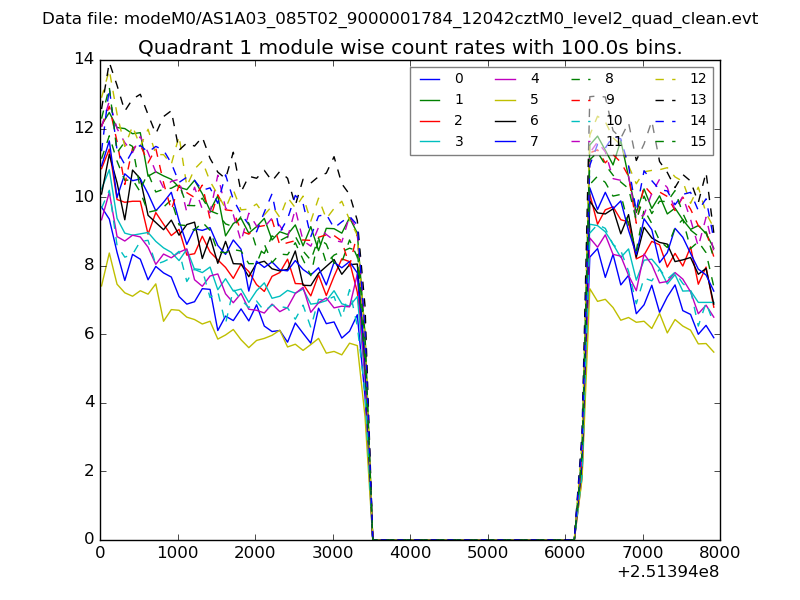 |
 |
| Module-wise count rates for Quadrant C Data is divided into 100 sec bins |
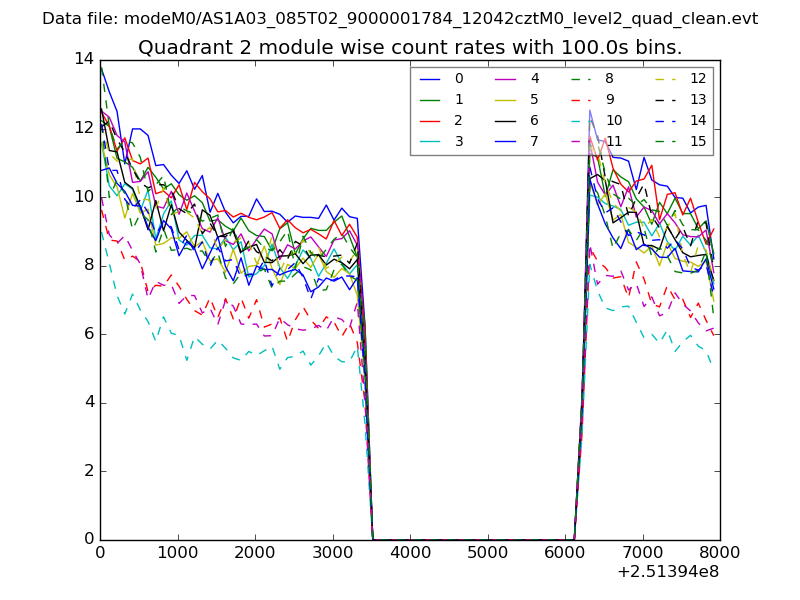 |
 |
| Module-wise count rates for Quadrant D Data is divided into 100 sec bins |
 |
 |
| Parameter | Plot |
|---|---|
| CZT HV Monitor | 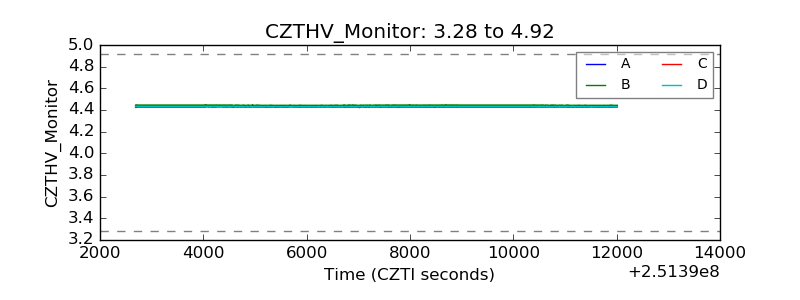 |
| D_VDD | 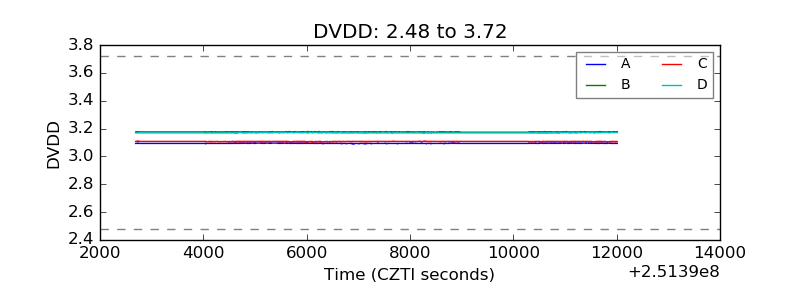 |
| Temperature 1 | 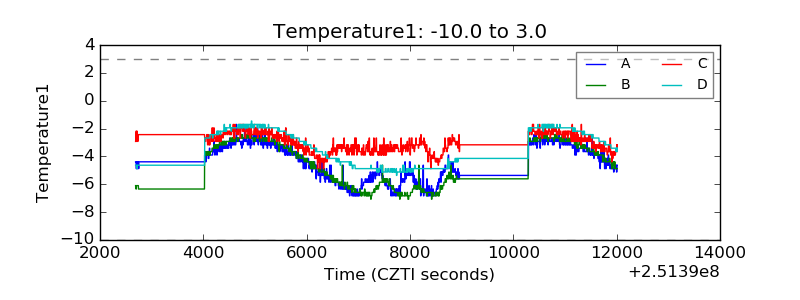 |
| Veto HV Monitor | 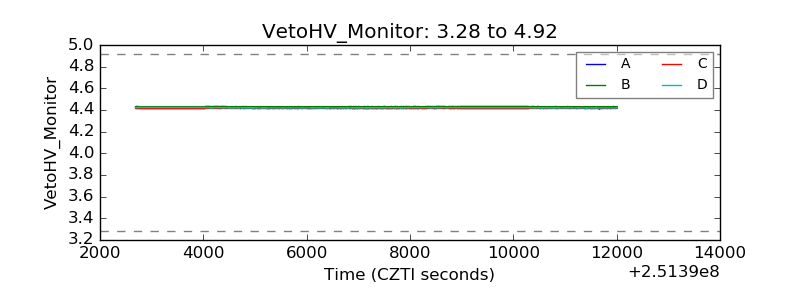 |
| Veto LLD | 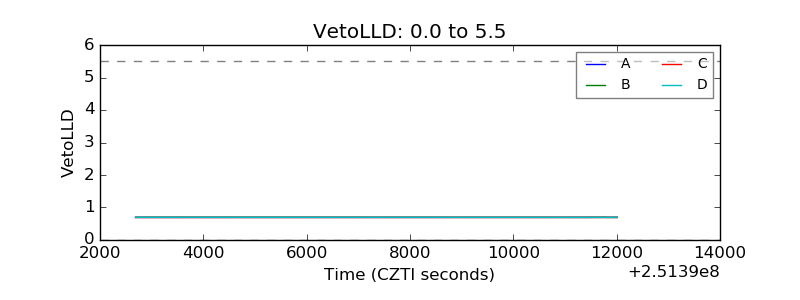 |
| Alpha Counter | 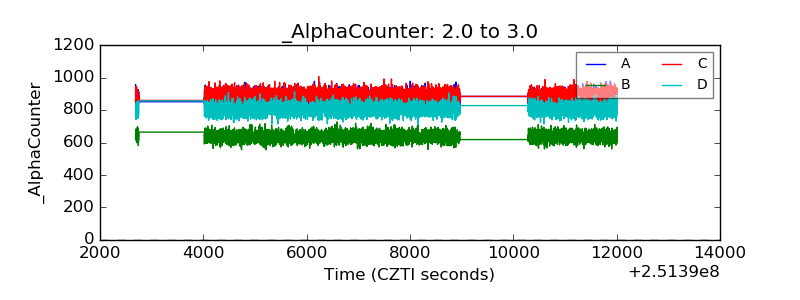 |
| _CPM_Rate | 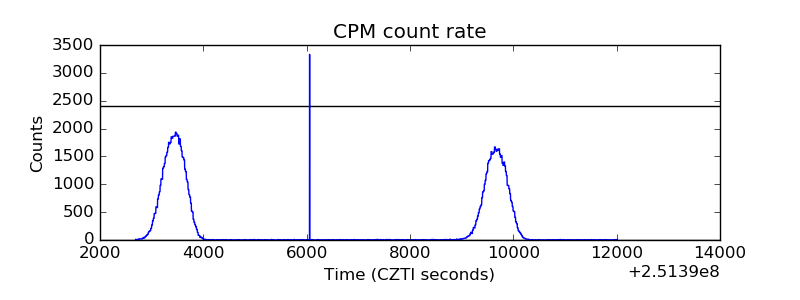 |
| CZT Counter | 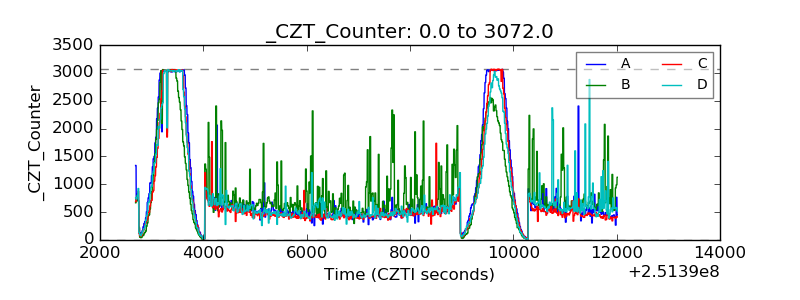 |
| +2.5 Volts monitor |  |
| +5 Volts monitor |  |
| _ROLL_ROT | 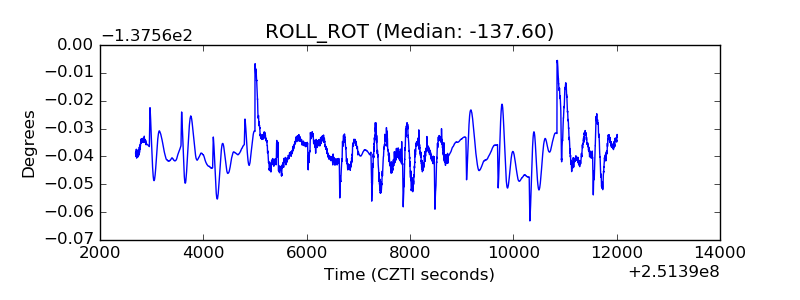 |
| _Roll_DEC | 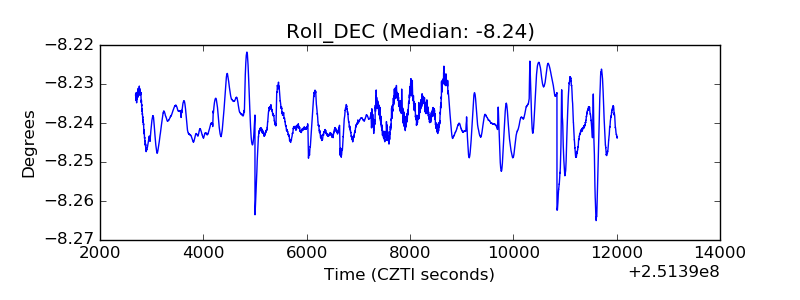 |
| _Roll_RA | 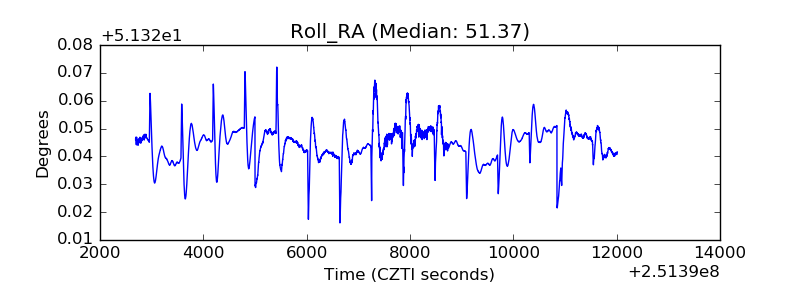 |
| Veto Counter | 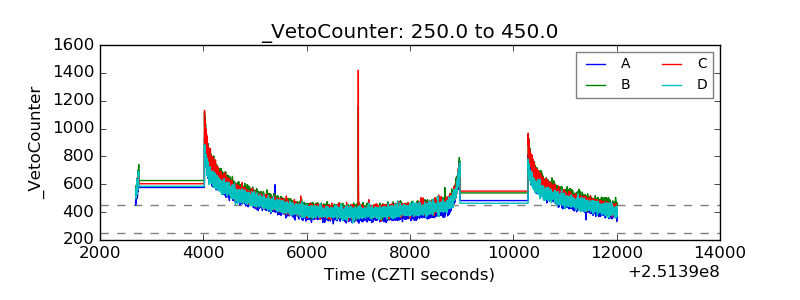 |