| Param | Original file | Final file |
|---|---|---|
| Filename | modeM0/AS1A03_085T02_9000001784_12043cztM0_level2.evt | modeM0/AS1A03_085T02_9000001784_12043cztM0_level2_quad_clean.evt |
| Size (bytes) | 524,044,800 | 98,075,520 |
| Size | 499.8 MB | 93.5 MB |
| Events in quadrant A | 3,559,722 | 645,140 |
| Events in quadrant B | 4,864,018 | 636,739 |
| Events in quadrant C | 3,124,779 | 626,123 |
| Events in quadrant D | 3,875,293 | 602,749 |
| Mode M9 | |||
|---|---|---|---|
| Quadrant | BADHDUFLAG | Total packets | Discarded packets |
| A | 0 | 13 | 0 |
| B | 0 | 13 | 0 |
| C | 0 | 13 | 0 |
| D | 0 | 13 | 0 |
| Mode SS | |||
|---|---|---|---|
| Quadrant | BADHDUFLAG | Total packets | Discarded packets |
| A | 0 | 134 | 0 |
| B | 0 | 134 | 0 |
| C | 0 | 134 | 0 |
| D | 0 | 134 | 0 |
| Mode M0 | |||
|---|---|---|---|
| Quadrant | BADHDUFLAG | Total packets | Discarded packets |
| A | 0 | 14788 | 3 |
| B | 0 | 19157 | 2 |
| C | 0 | 13719 | 2 |
| D | 0 | 15686 | 2 |
| Quadrant | Total seconds | Saturated seconds | Saturation percentage |
|---|---|---|---|
| A | 6587 | 128 | 1.943221% |
| B | 6587 | 357 | 5.419766% |
| C | 6587 | 51 | 0.774252% |
| D | 6588 | 137 | 2.079539% |
Noise dominated data is calculated using 1-second bins in cleaned event files. If a bin has >2000 counts, and if more than 50% of those come from <1% of pixels, then it is considered to be noise-dominated and hence unusable.
| Quadrant | # 1 sec bins | Bins with >0 counts | Bins with >2000 counts | High rate bins dominated by noise | Noise dominated (total time) | Noise dominated (detector-on time) | Marked lightcurve |
|---|---|---|---|---|---|---|---|
| A | 7823 | 6588 | 17 | 17 | 0.22% | 0.26% | 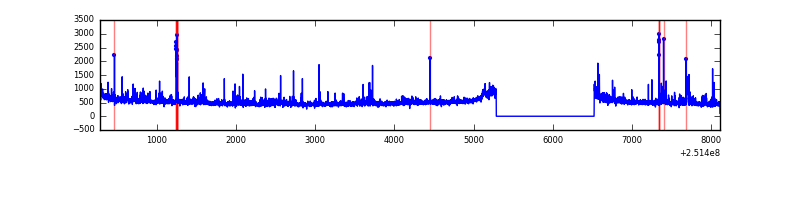 |
| B | 7823 | 6588 | 164 | 164 | 2.10% | 2.49% | 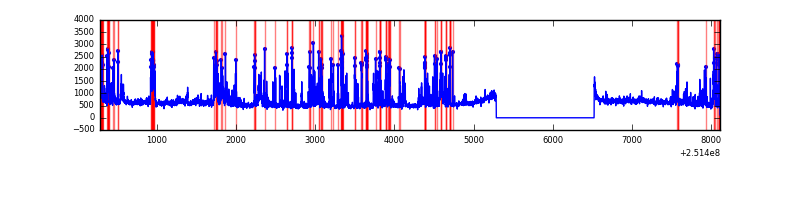 |
| C | 7823 | 6588 | 0 | 0 | 0.00% | 0.00% | 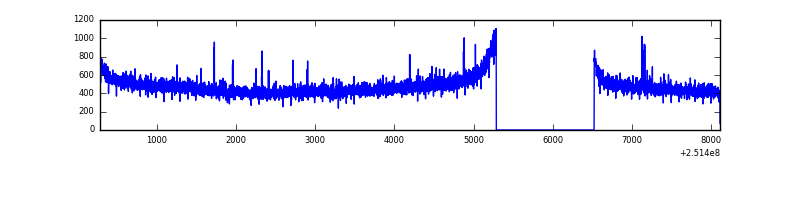 |
| D | 7824 | 6589 | 73 | 73 | 0.93% | 1.11% | 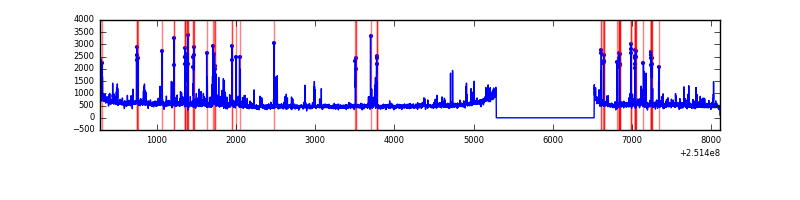 |
Top three noisy pixels from each quadrant. If the there are fewer than three noisy pixels in the level2.evt file, extra rows are filled as -1
| Pixel properties | Quadrant properties | ||||||
|---|---|---|---|---|---|---|---|
| Quadrant | DetID | PixID | Counts | Sigma | Mean | Median | Sigma |
| A | 1 | 162 | 106061 | 622.03 | 834 | 818 | 169.2 |
| A | 1 | 178 | 54609 | 317.93 | 834 | 818 | 169.2 |
| A | 1 | 161 | 48212 | 280.12 | 834 | 818 | 169.2 |
| B | 4 | 239 | 1073778 | 6753.2 | 825 | 807 | 158.9 |
| B | 4 | 206 | 268887 | 1687.28 | 825 | 807 | 158.9 |
| B | 15 | 204 | 150889 | 944.61 | 825 | 807 | 158.9 |
| C | 14 | 234 | 15652 | 80.25 | 797 | 803 | 185.0 |
| C | 13 | 61 | 5660 | 26.25 | 797 | 803 | 185.0 |
| C | 0 | 207 | 3327 | 13.64 | 797 | 803 | 185.0 |
| D | 1 | 52 | 344719 | 1812.49 | 795 | 773 | 189.8 |
| D | 8 | 195 | 259073 | 1361.16 | 795 | 773 | 189.8 |
| D | 13 | 104 | 124276 | 650.82 | 795 | 773 | 189.8 |
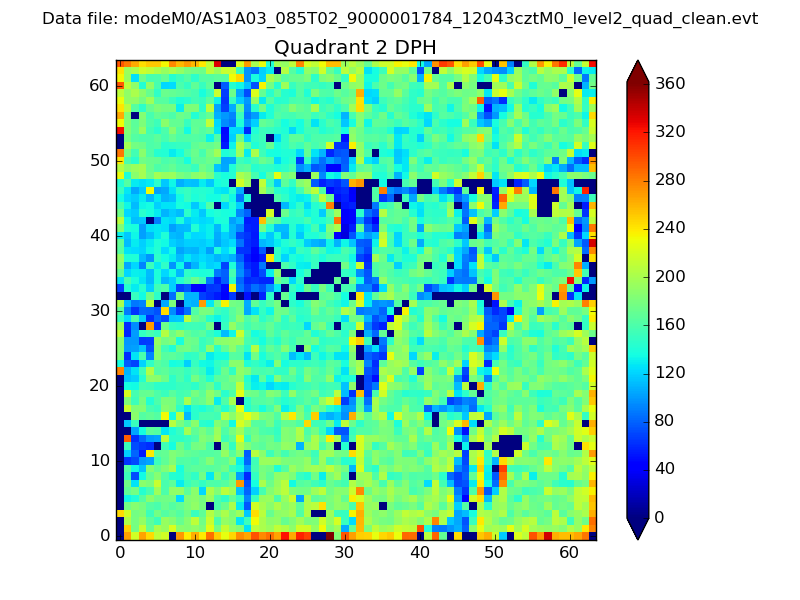
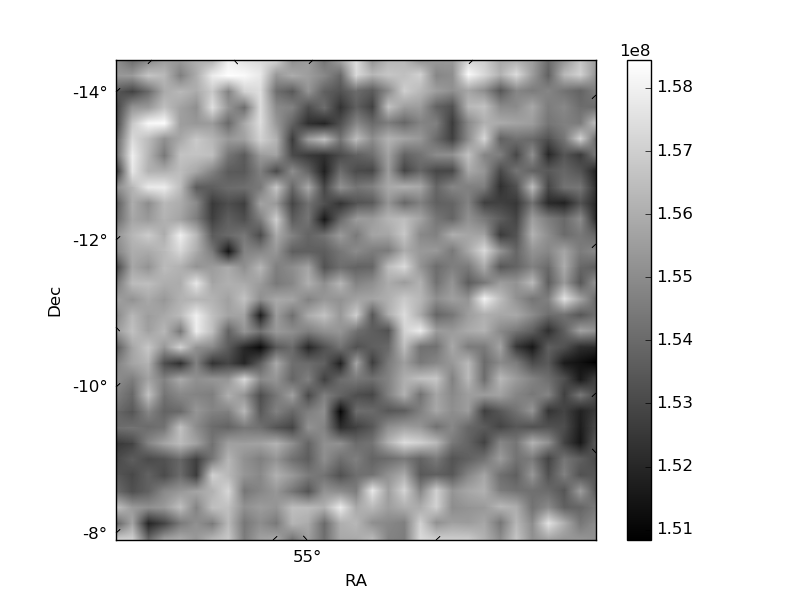
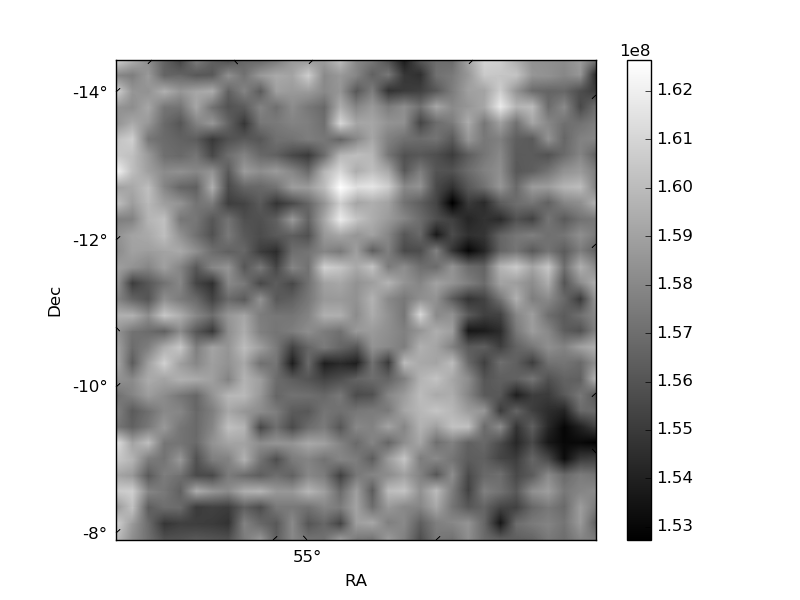
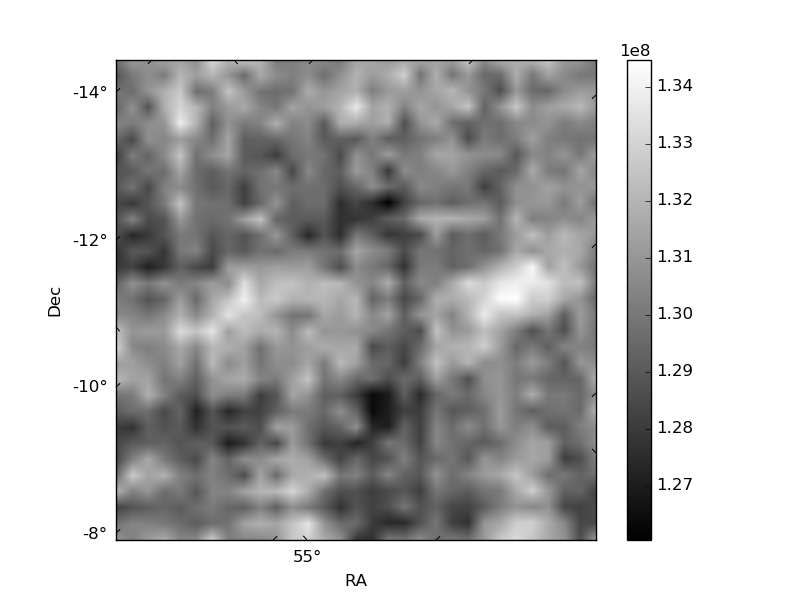
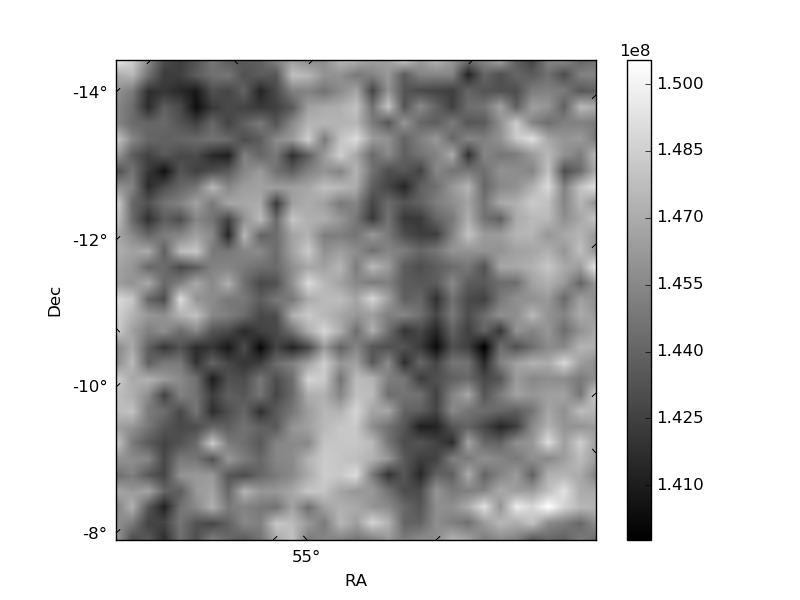
Histogram calculated using DETX and DETY for each event in the final _common_clean file
| Quadrant A | 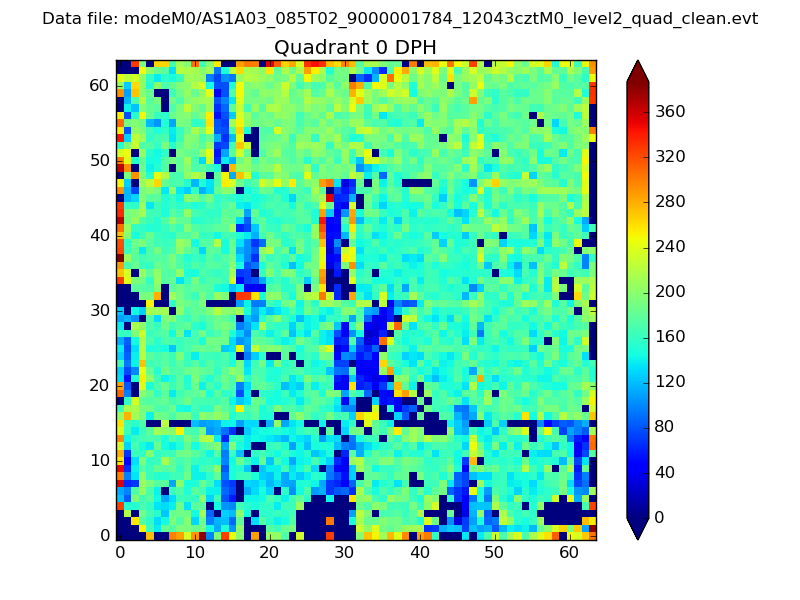 |
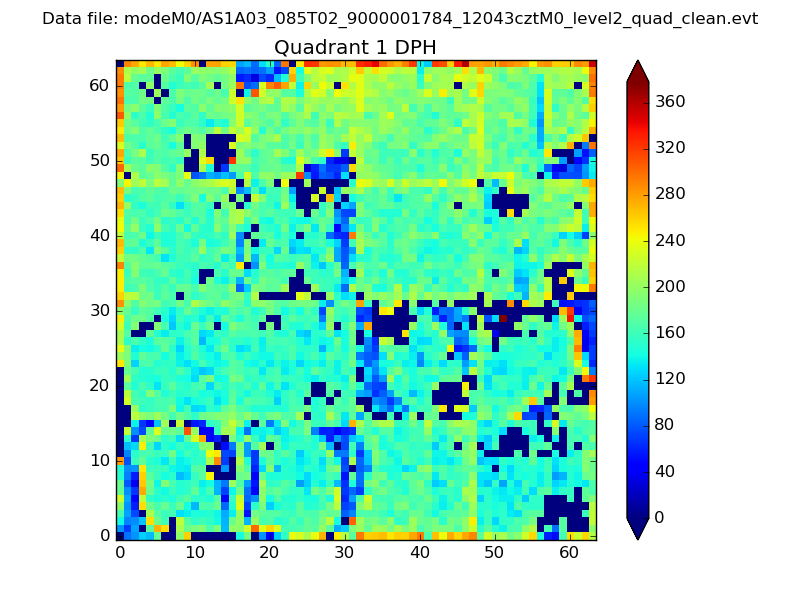 |
Quadrant B |
|---|---|---|---|
| Quadrant D | 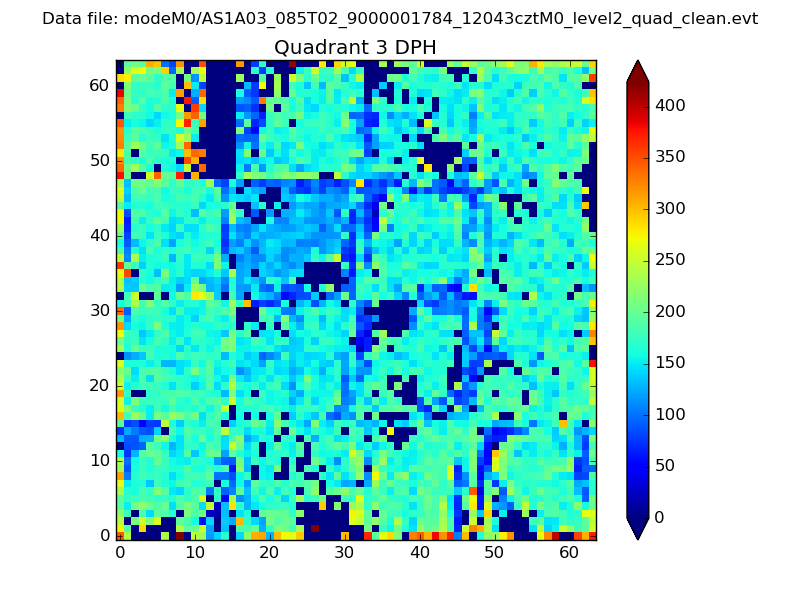 |
 |
Quadrant C |
| Plot type | Count rate plots | Images |
|---|---|---|
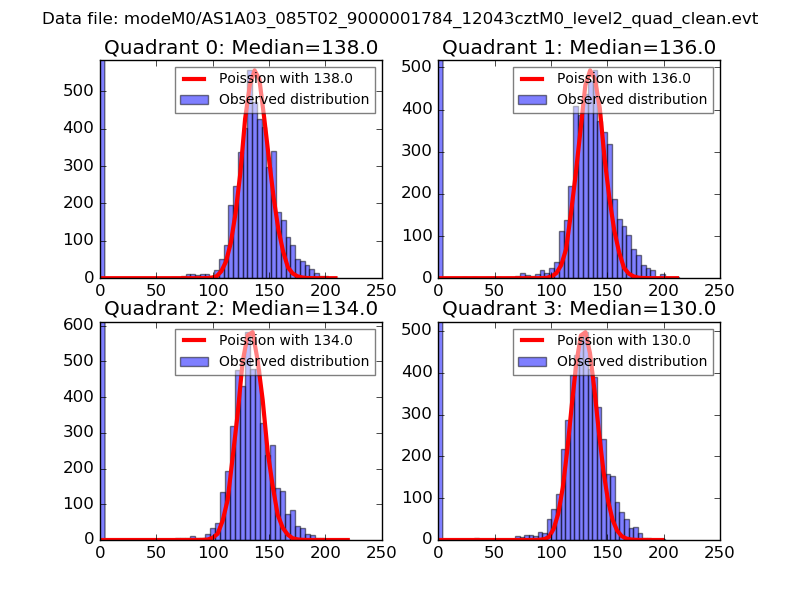
| Comparison with Poisson distribution Blue bars denote a histogram of data divided into 1 sec bins. Red curve is a Poisson curve with rate = median count rate of data. |
 |
 |
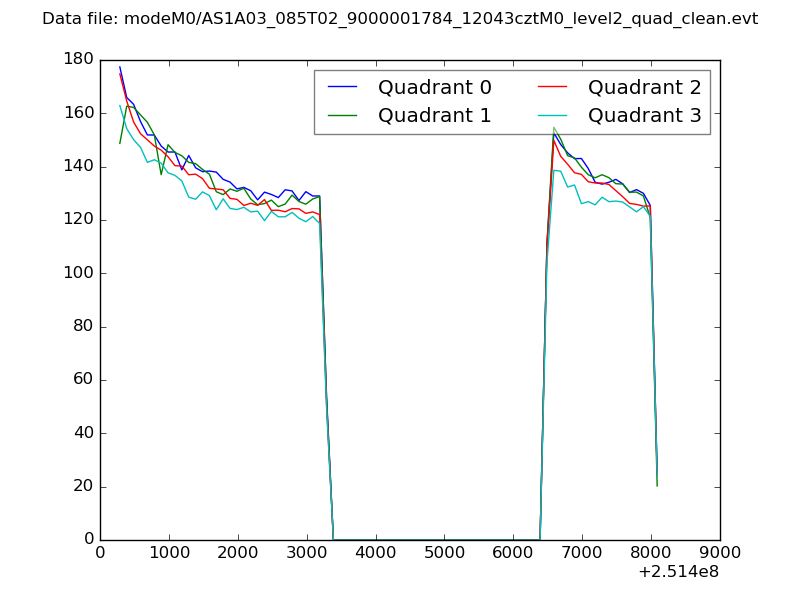
| Quadrant-wise count rates Data is divided into 100 sec bins |
 |
|
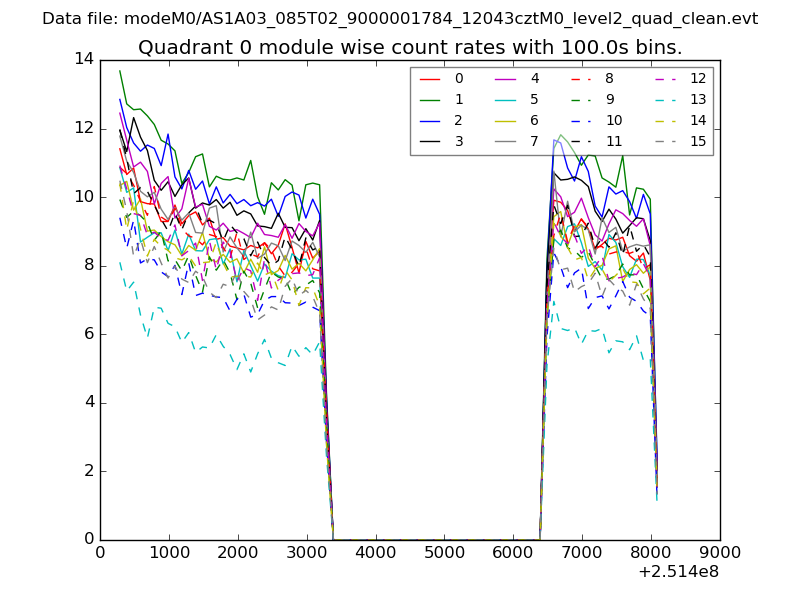
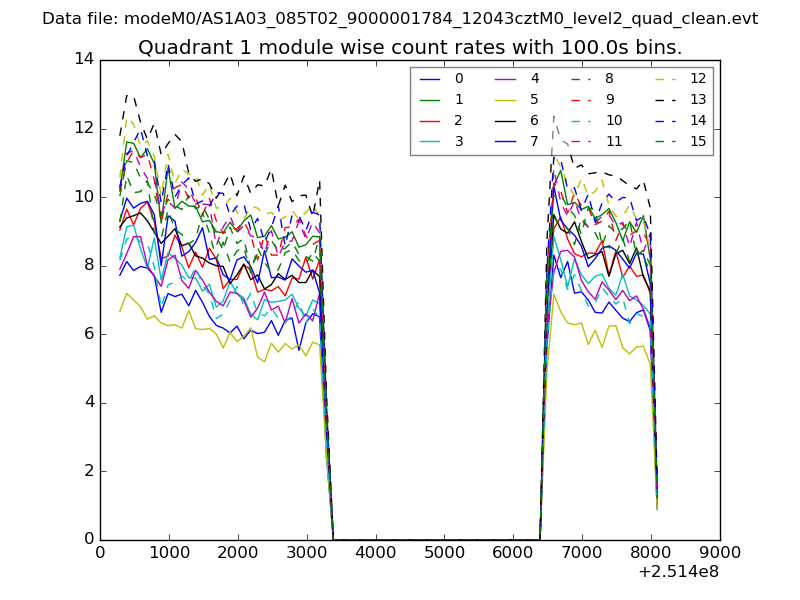
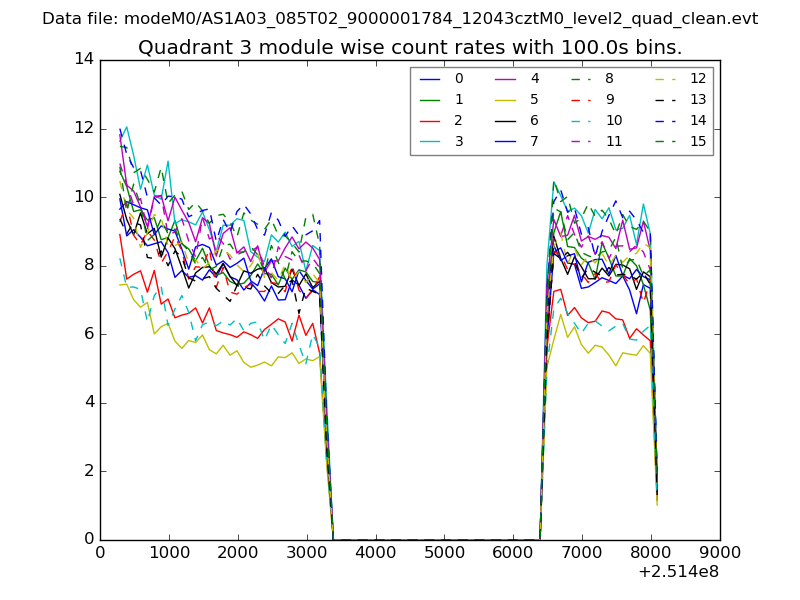
| Module-wise count rates for Quadrant A Data is divided into 100 sec bins |
 |
 |
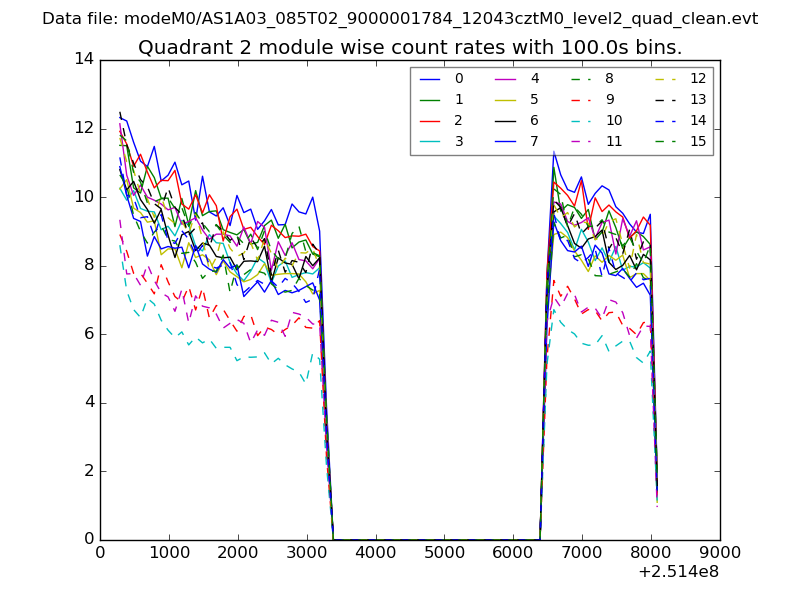
| Module-wise count rates for Quadrant B Data is divided into 100 sec bins |
 |
 |
| Module-wise count rates for Quadrant C Data is divided into 100 sec bins |
 |
 |
| Module-wise count rates for Quadrant D Data is divided into 100 sec bins |
 |
 |
| Parameter | Plot |
|---|---|
| CZT HV Monitor | 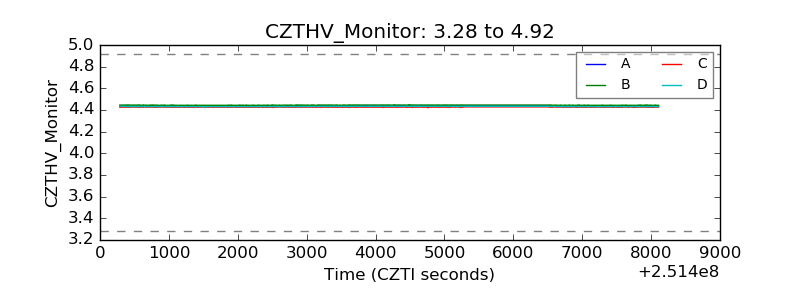 |
| D_VDD | 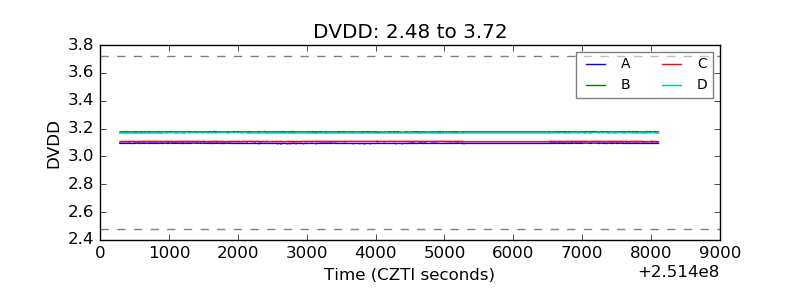 |
| Temperature 1 | 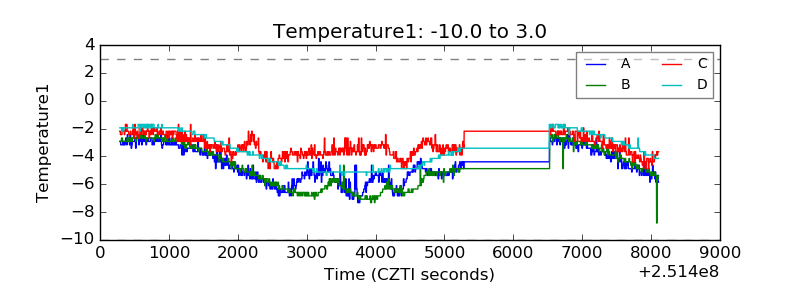 |
| Veto HV Monitor | 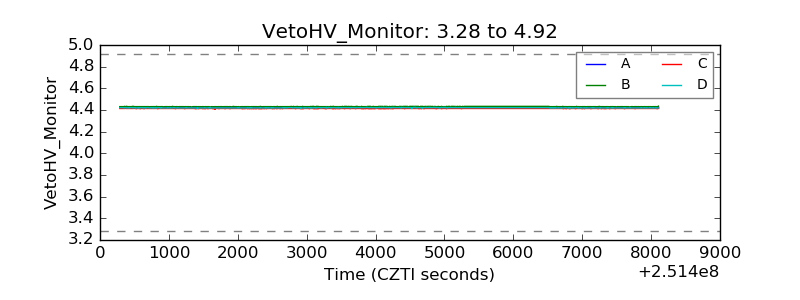 |
| Veto LLD | 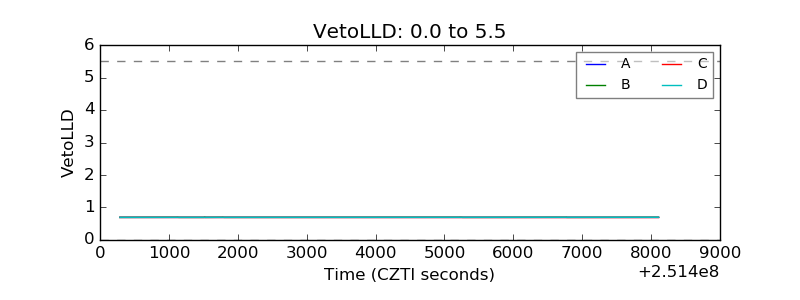 |
| Alpha Counter | 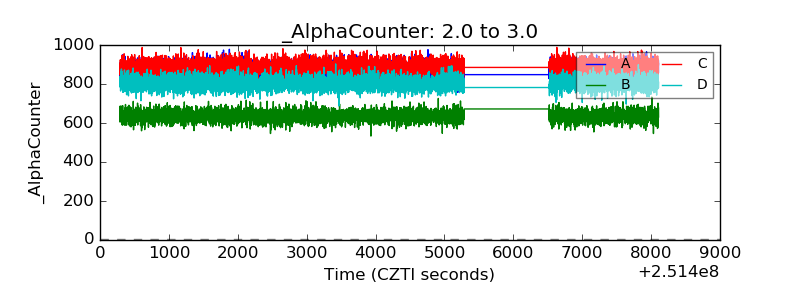 |
| _CPM_Rate | 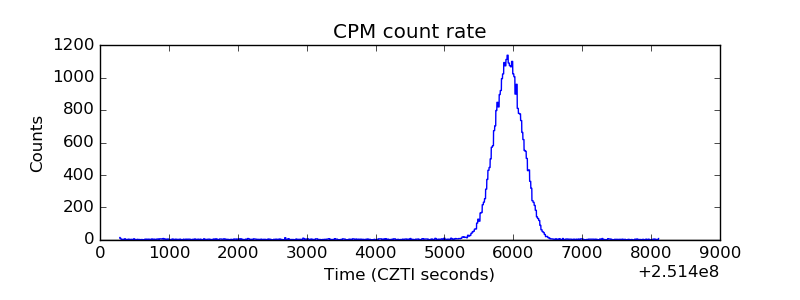 |
| CZT Counter | 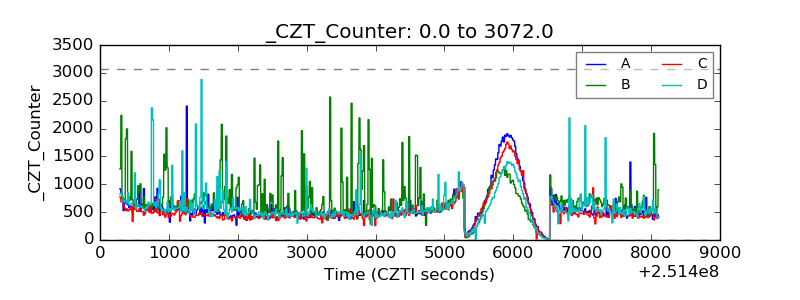 |
| +2.5 Volts monitor |  |
| +5 Volts monitor |  |
| _ROLL_ROT | 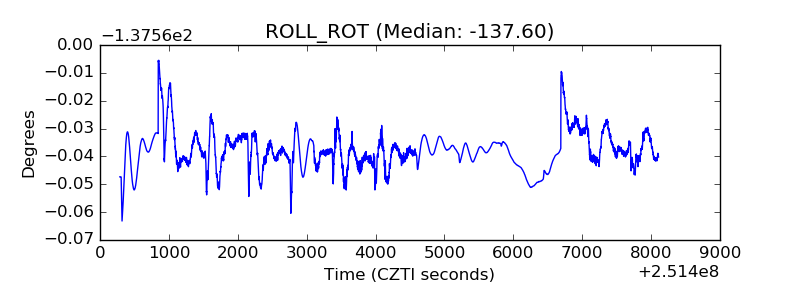 |
| _Roll_DEC | 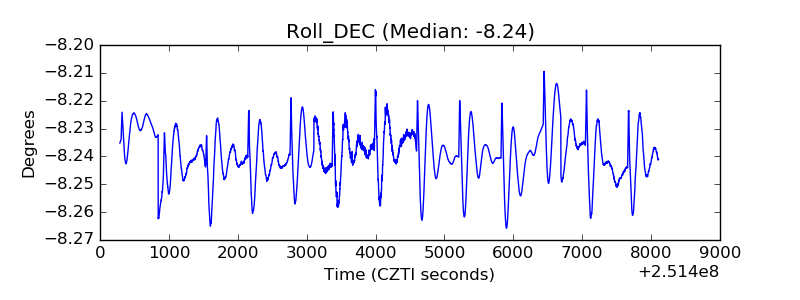 |
| _Roll_RA | 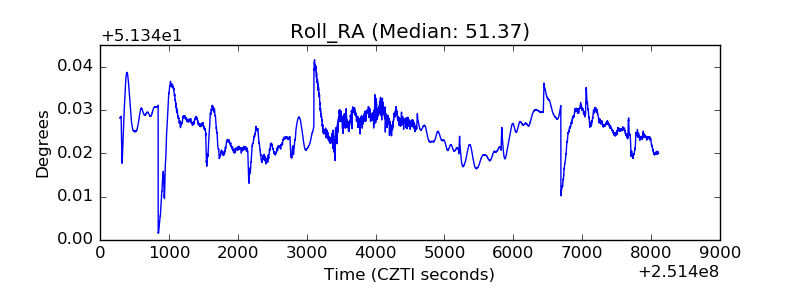 |
| Veto Counter | 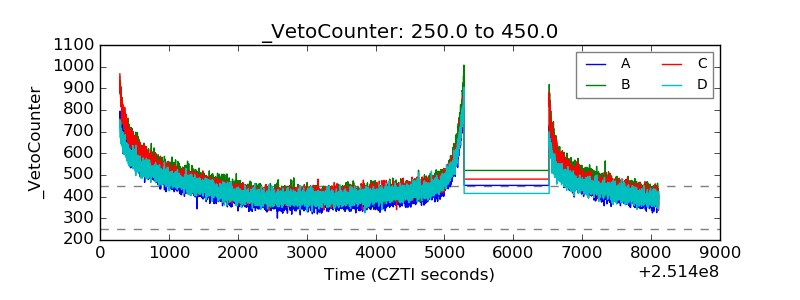 |