| Param | Original file | Final file |
|---|---|---|
| Filename | modeM0/AS1A03_085T02_9000001784_12044cztM0_level2.evt | modeM0/AS1A03_085T02_9000001784_12044cztM0_level2_quad_clean.evt |
| Size (bytes) | 533,764,800 | 86,912,640 |
| Size | 509.0 MB | 82.9 MB |
| Events in quadrant A | 3,334,056 | 561,282 |
| Events in quadrant B | 5,002,951 | 547,571 |
| Events in quadrant C | 3,015,915 | 549,718 |
| Events in quadrant D | 4,371,560 | 519,868 |
| Mode M9 | |||
|---|---|---|---|
| Quadrant | BADHDUFLAG | Total packets | Discarded packets |
| A | 0 | 15 | 0 |
| B | 0 | 15 | 0 |
| C | 0 | 15 | 0 |
| D | 0 | 16 | 0 |
| Mode SS | |||
|---|---|---|---|
| Quadrant | BADHDUFLAG | Total packets | Discarded packets |
| A | 0 | 132 | 0 |
| B | 0 | 132 | 0 |
| C | 0 | 132 | 0 |
| D | 0 | 132 | 0 |
| Mode M0 | |||
|---|---|---|---|
| Quadrant | BADHDUFLAG | Total packets | Discarded packets |
| A | 0 | 14194 | 4 |
| B | 0 | 19495 | 3 |
| C | 0 | 13483 | 3 |
| D | 0 | 17124 | 3 |
| Quadrant | Total seconds | Saturated seconds | Saturation percentage |
|---|---|---|---|
| A | 6499 | 81 | 1.246346% |
| B | 6499 | 479 | 7.370365% |
| C | 6499 | 31 | 0.476996% |
| D | 6499 | 219 | 3.369749% |
Noise dominated data is calculated using 1-second bins in cleaned event files. If a bin has >2000 counts, and if more than 50% of those come from <1% of pixels, then it is considered to be noise-dominated and hence unusable.
| Quadrant | # 1 sec bins | Bins with >0 counts | Bins with >2000 counts | High rate bins dominated by noise | Noise dominated (total time) | Noise dominated (detector-on time) | Marked lightcurve |
|---|---|---|---|---|---|---|---|
| A | 7570 | 6501 | 8 | 8 | 0.11% | 0.12% | 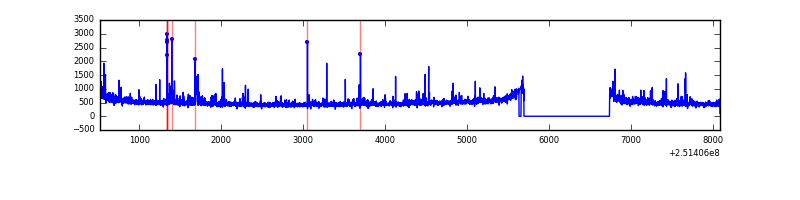 |
| B | 7570 | 6500 | 289 | 289 | 3.82% | 4.45% | 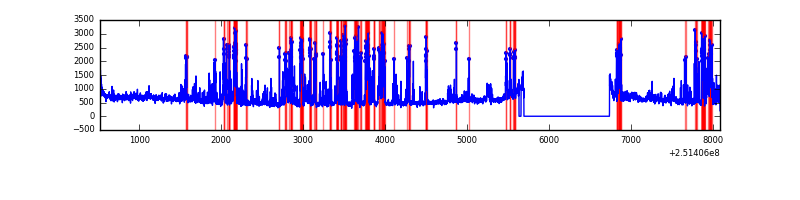 |
| C | 7570 | 6502 | 1 | 1 | 0.01% | 0.02% |  |
| D | 7570 | 6502 | 159 | 159 | 2.10% | 2.45% | 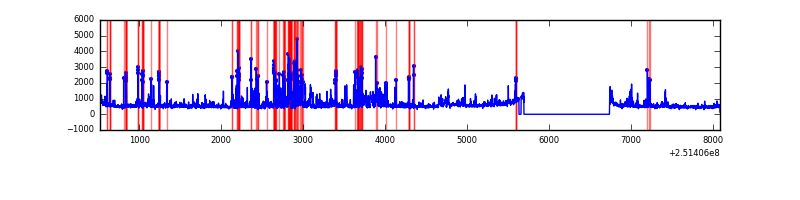 |
Top three noisy pixels from each quadrant. If the there are fewer than three noisy pixels in the level2.evt file, extra rows are filled as -1
| Pixel properties | Quadrant properties | ||||||
|---|---|---|---|---|---|---|---|
| Quadrant | DetID | PixID | Counts | Sigma | Mean | Median | Sigma |
| A | 1 | 162 | 91168 | 555.45 | 797 | 782 | 162.7 |
| A | 1 | 178 | 41099 | 247.76 | 797 | 782 | 162.7 |
| A | 1 | 161 | 38370 | 230.99 | 797 | 782 | 162.7 |
| B | 4 | 239 | 1269700 | 8368.26 | 786 | 768 | 151.6 |
| B | 4 | 206 | 267035 | 1755.96 | 786 | 768 | 151.6 |
| B | 0 | 231 | 251399 | 1652.84 | 786 | 768 | 151.6 |
| C | 14 | 234 | 16039 | 85.07 | 769 | 773 | 179.5 |
| C | 13 | 61 | 5534 | 26.53 | 769 | 773 | 179.5 |
| C | 14 | 225 | 1896 | 6.26 | 769 | 773 | 179.5 |
| D | 1 | 52 | 1107101 | 6033.63 | 757 | 737 | 183.4 |
| D | 8 | 195 | 272957 | 1484.57 | 757 | 737 | 183.4 |
| D | 13 | 104 | 54987 | 295.86 | 757 | 737 | 183.4 |
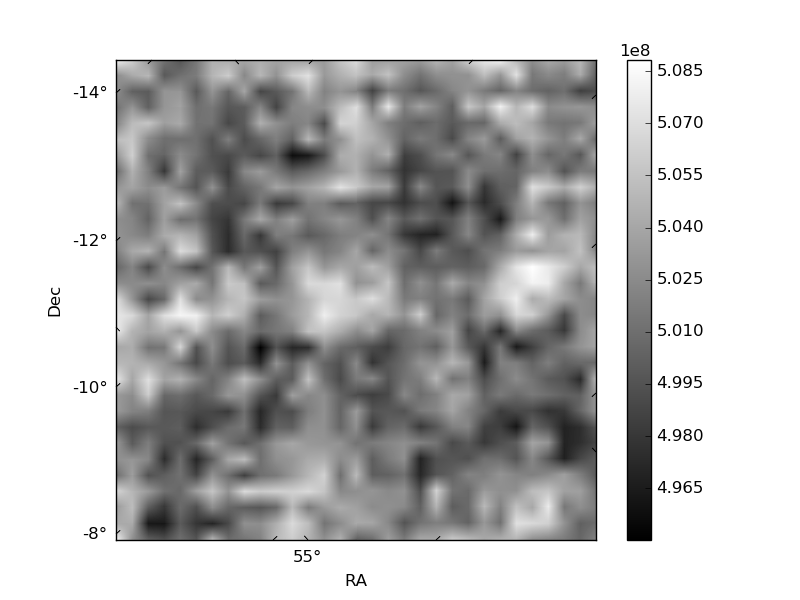
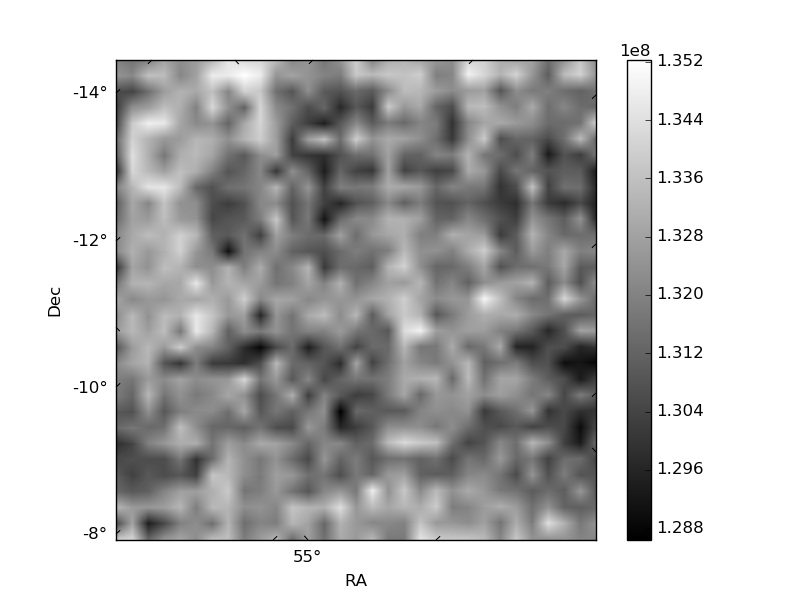
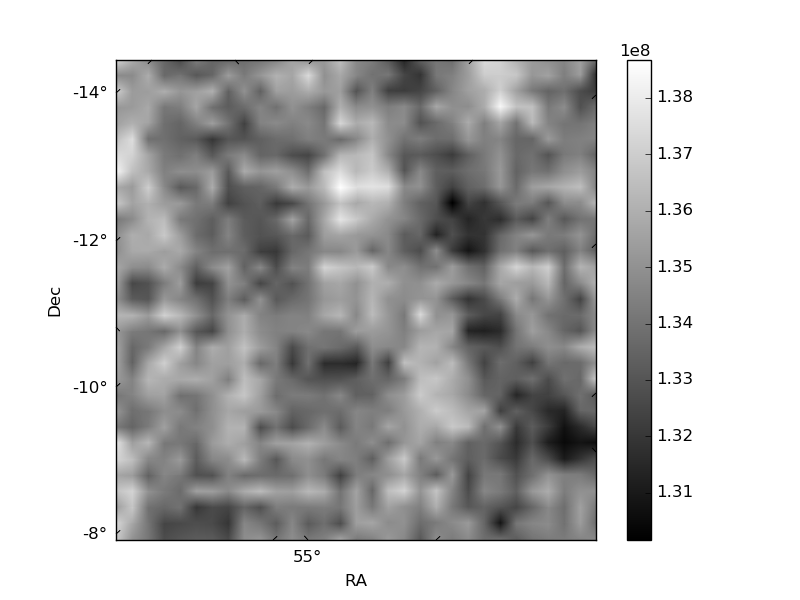
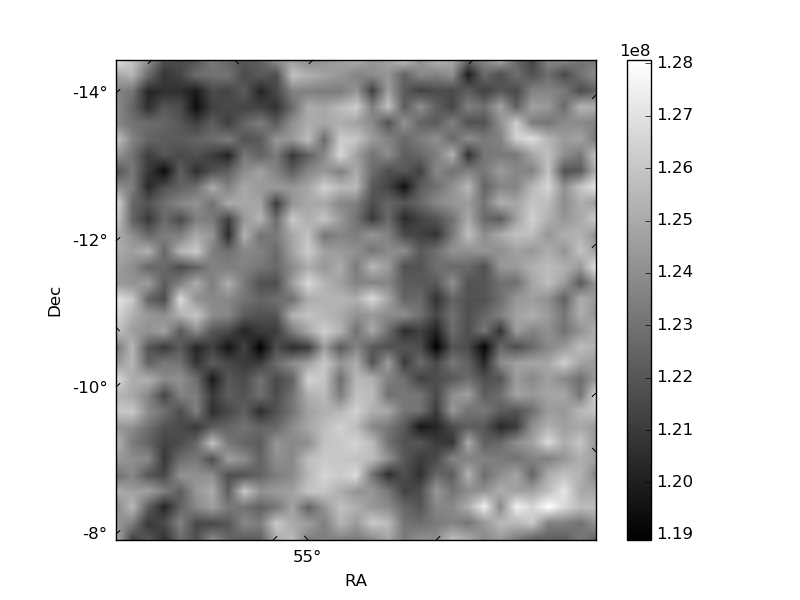
Histogram calculated using DETX and DETY for each event in the final _common_clean file
| Quadrant A | 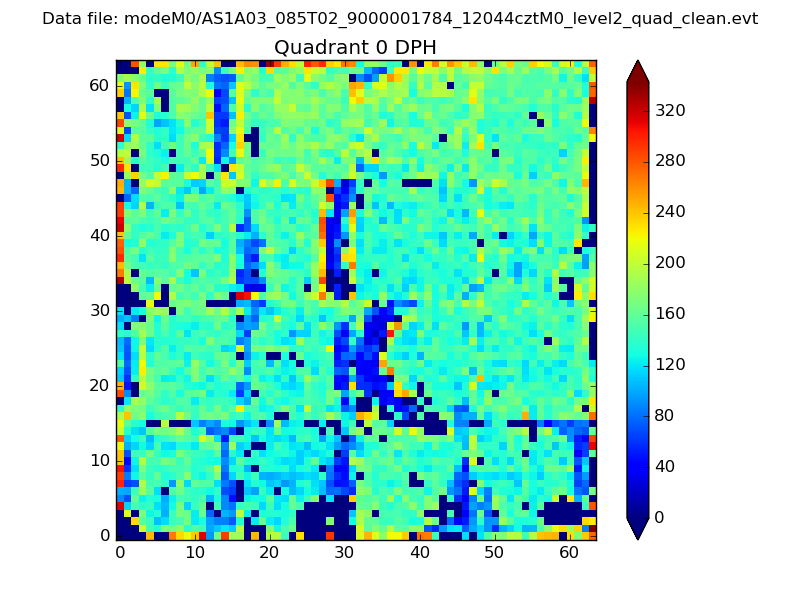 |
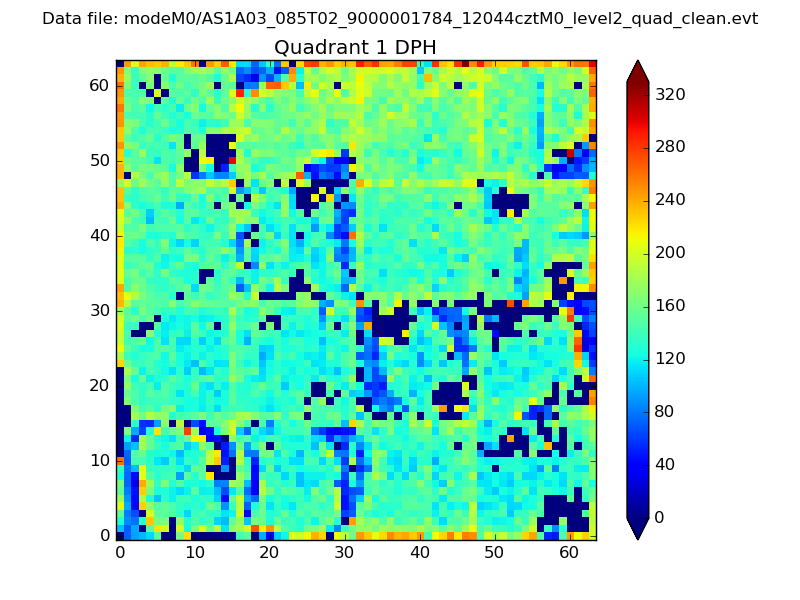 |
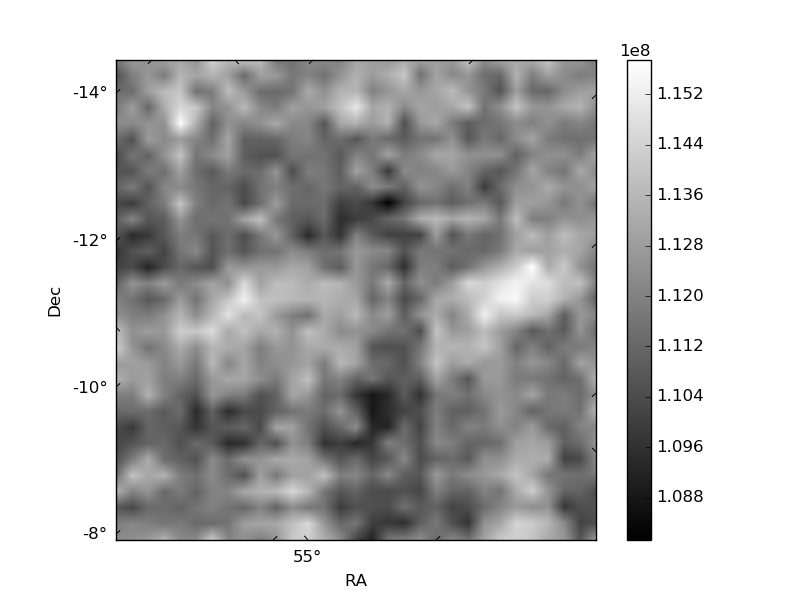
Quadrant B |
|---|---|---|---|
| Quadrant D | 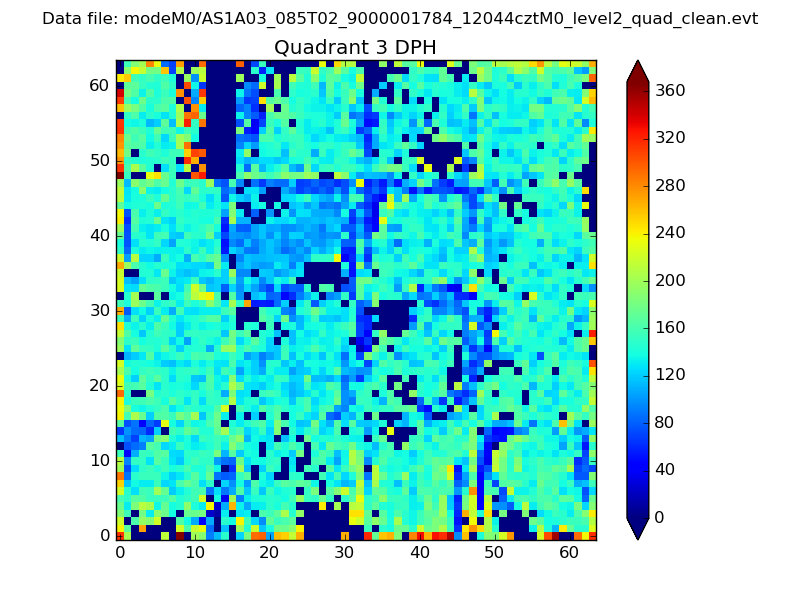 |
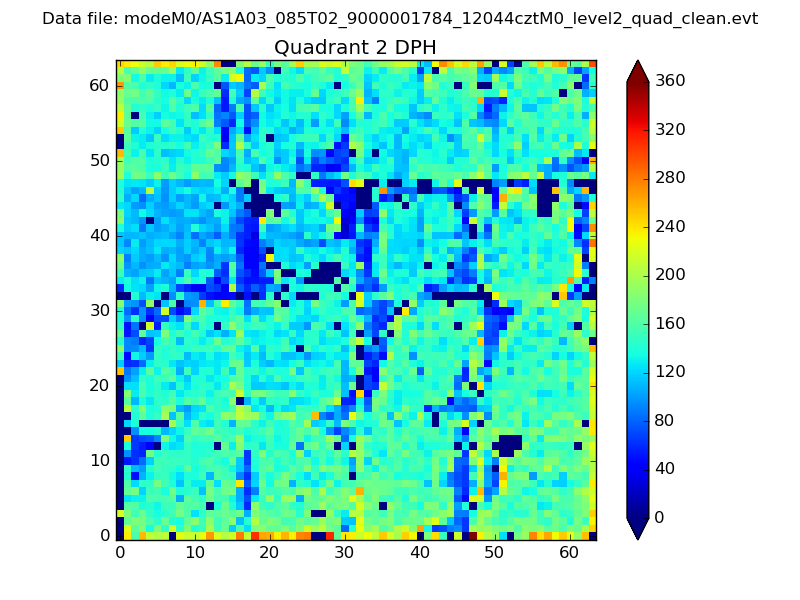 |
Quadrant C |
| Plot type | Count rate plots | Images |
|---|---|---|
| Comparison with Poisson distribution Blue bars denote a histogram of data divided into 1 sec bins. Red curve is a Poisson curve with rate = median count rate of data. |
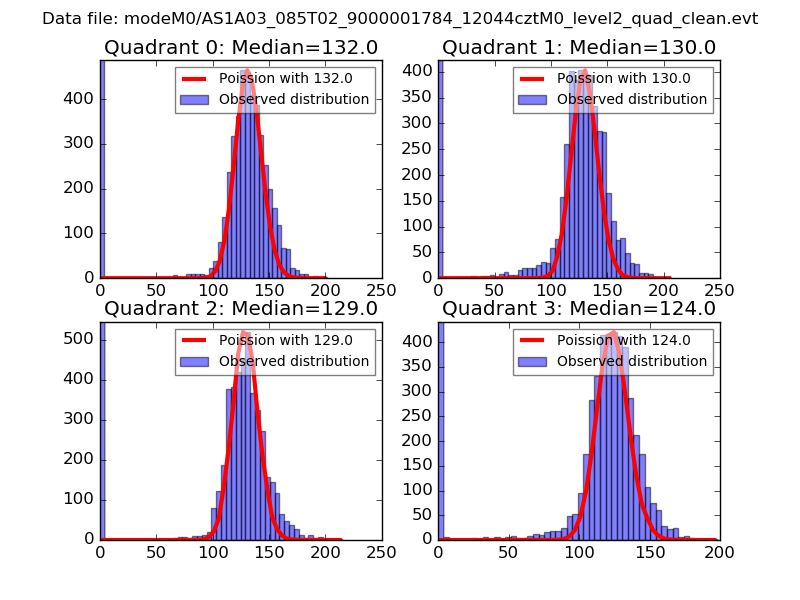 |
 |
| Quadrant-wise count rates Data is divided into 100 sec bins |
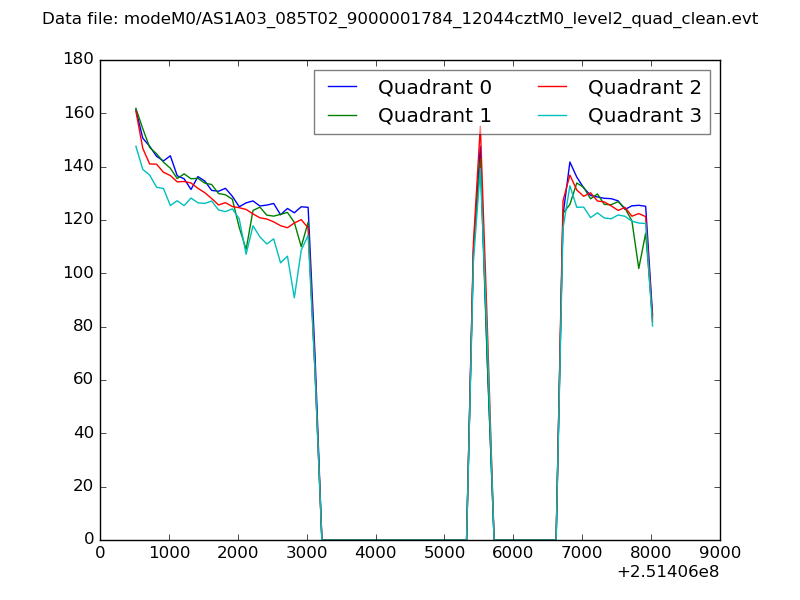 |
|
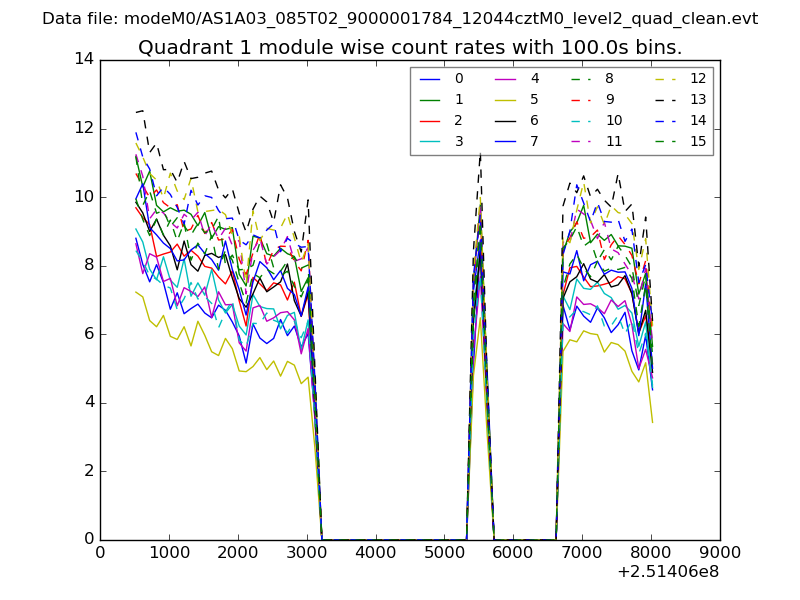
| Module-wise count rates for Quadrant A Data is divided into 100 sec bins |
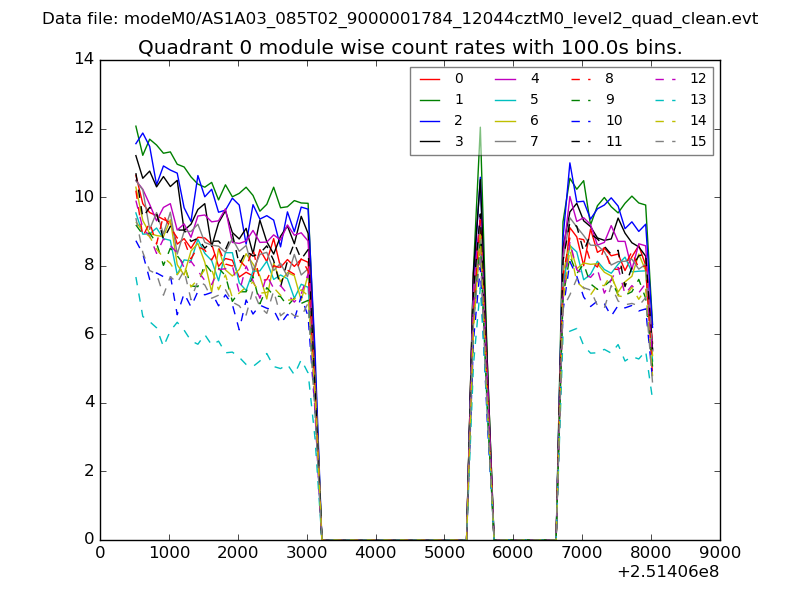 |
 |
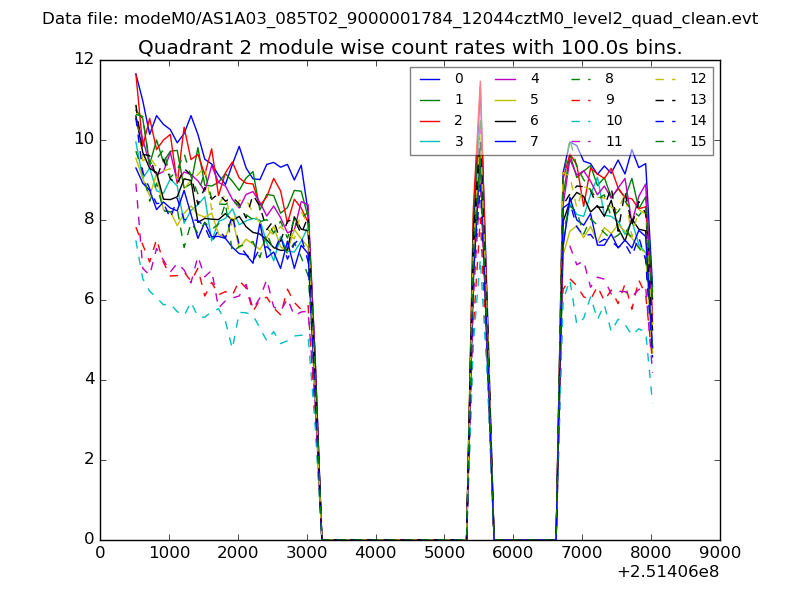
| Module-wise count rates for Quadrant B Data is divided into 100 sec bins |
 |
 |
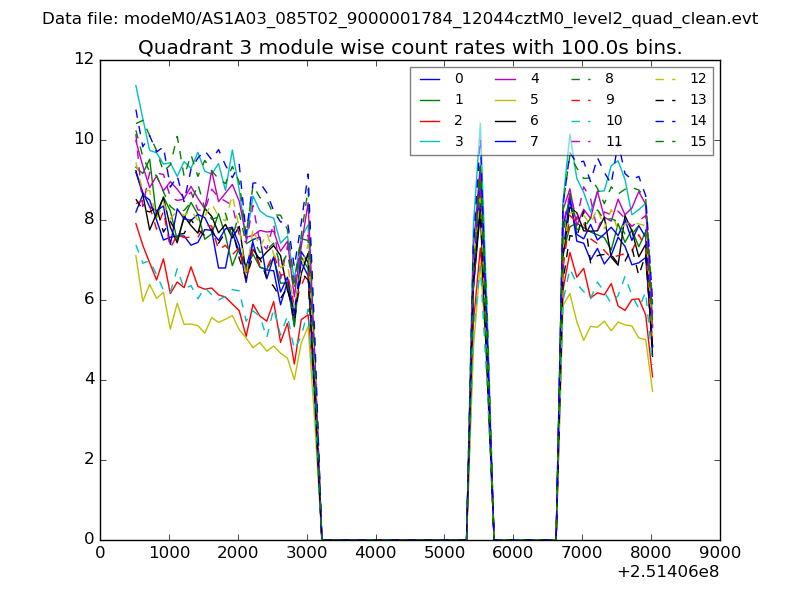
| Module-wise count rates for Quadrant C Data is divided into 100 sec bins |
 |
 |
| Module-wise count rates for Quadrant D Data is divided into 100 sec bins |
 |
 |
| Parameter | Plot |
|---|---|
| CZT HV Monitor | 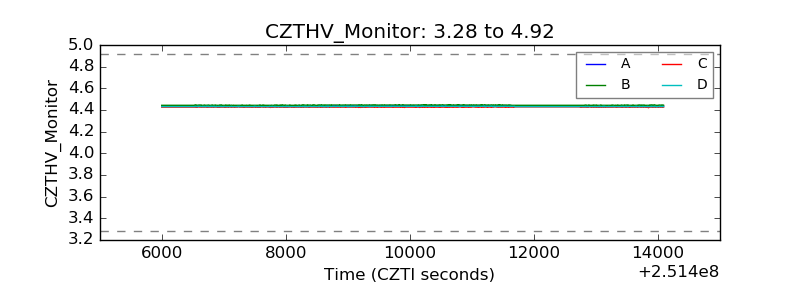 |
| D_VDD | 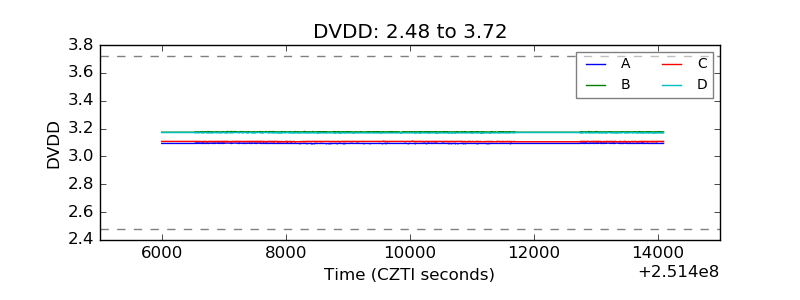 |
| Temperature 1 | 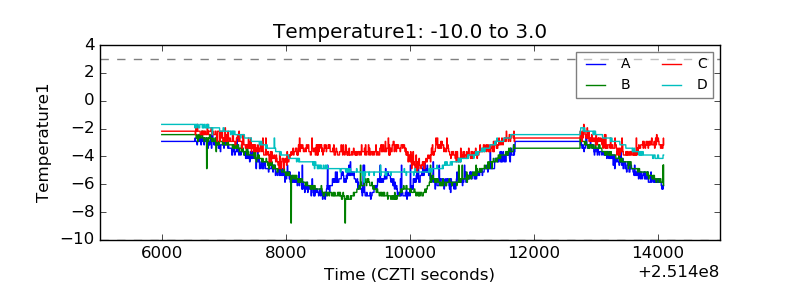 |
| Veto HV Monitor | 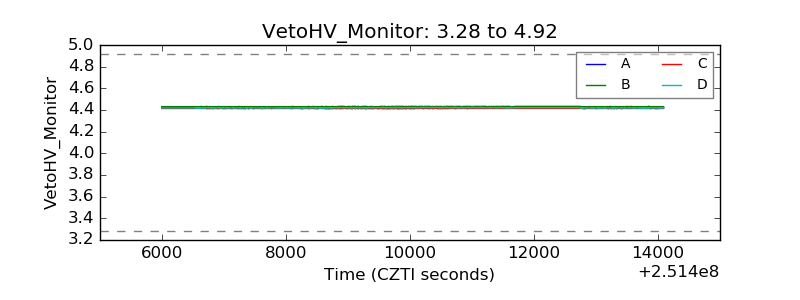 |
| Veto LLD | 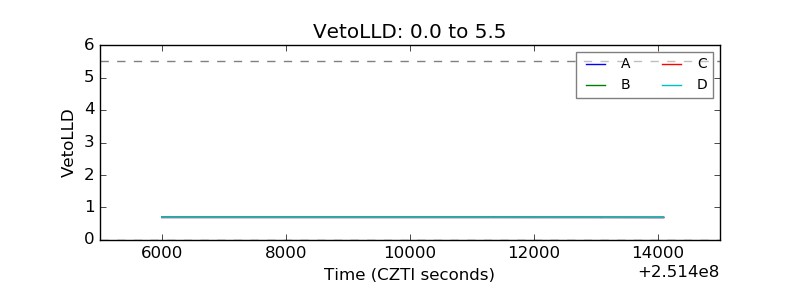 |
| Alpha Counter | 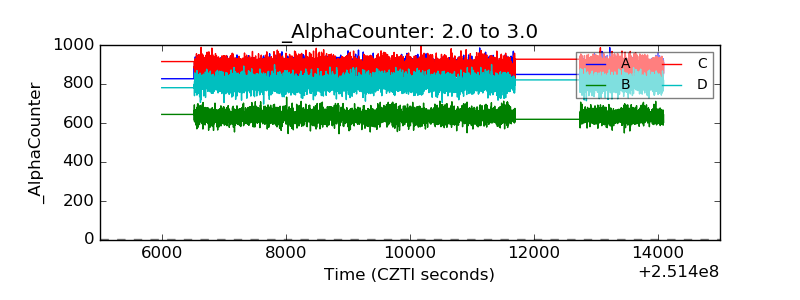 |
| _CPM_Rate | 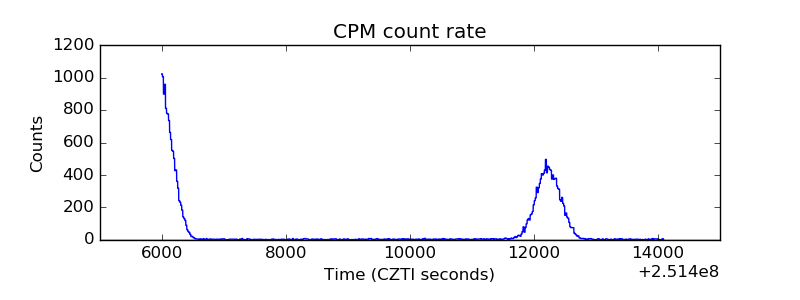 |
| CZT Counter | 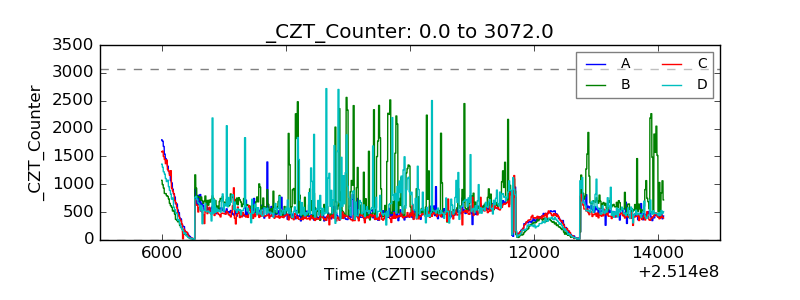 |
| +2.5 Volts monitor |  |
| +5 Volts monitor |  |
| _ROLL_ROT | 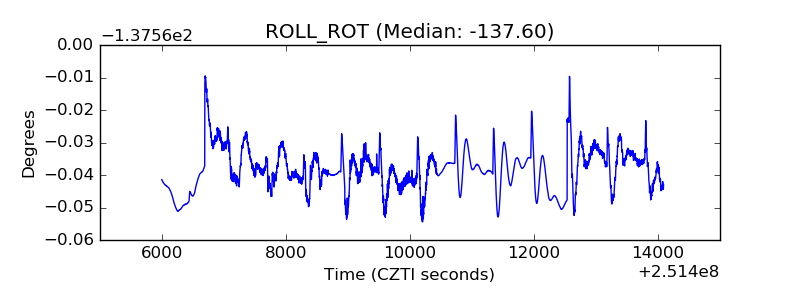 |
| _Roll_DEC | 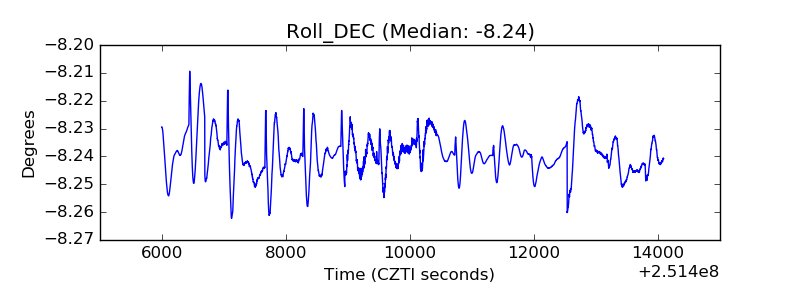 |
| _Roll_RA | 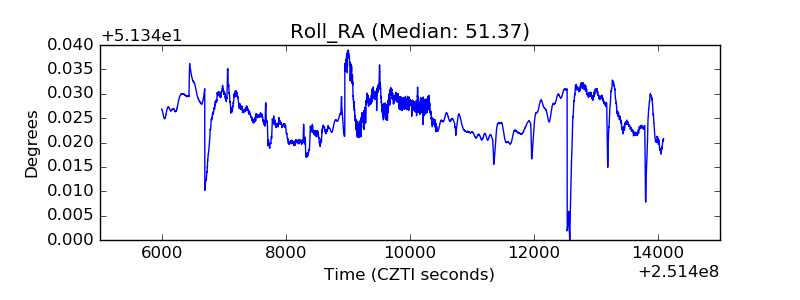 |
| Veto Counter | 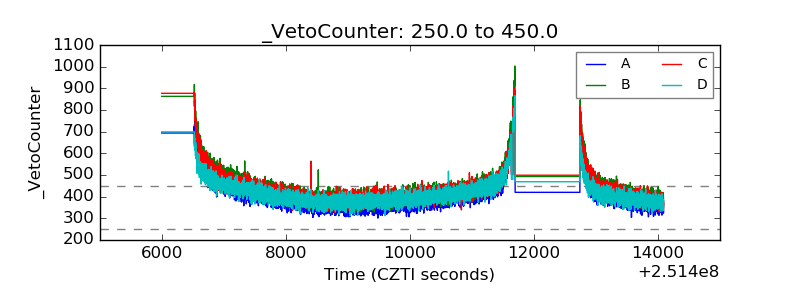 |