| Param | Original file | Final file |
|---|---|---|
| Filename | modeM0/AS1A03_085T02_9000001784_12045cztM0_level2.evt | modeM0/AS1A03_085T02_9000001784_12045cztM0_level2_quad_clean.evt |
| Size (bytes) | 555,226,560 | 97,073,280 |
| Size | 529.5 MB | 92.6 MB |
| Events in quadrant A | 3,668,669 | 624,118 |
| Events in quadrant B | 5,460,637 | 605,294 |
| Events in quadrant C | 3,281,789 | 614,127 |
| Events in quadrant D | 3,917,622 | 596,661 |
| Mode M9 | |||
|---|---|---|---|
| Quadrant | BADHDUFLAG | Total packets | Discarded packets |
| A | 0 | 17 | 0 |
| B | 0 | 17 | 0 |
| C | 0 | 17 | 0 |
| D | 0 | 17 | 0 |
| Mode SS | |||
|---|---|---|---|
| Quadrant | BADHDUFLAG | Total packets | Discarded packets |
| A | 0 | 150 | 0 |
| B | 0 | 150 | 0 |
| C | 0 | 150 | 0 |
| D | 0 | 150 | 0 |
| Mode M0 | |||
|---|---|---|---|
| Quadrant | BADHDUFLAG | Total packets | Discarded packets |
| A | 0 | 15673 | 4 |
| B | 0 | 21112 | 3 |
| C | 0 | 14807 | 3 |
| D | 0 | 16205 | 3 |
| Quadrant | Total seconds | Saturated seconds | Saturation percentage |
|---|---|---|---|
| A | 7164 | 106 | 1.479620% |
| B | 7164 | 532 | 7.426019% |
| C | 7164 | 39 | 0.544389% |
| D | 7164 | 86 | 1.200447% |
Noise dominated data is calculated using 1-second bins in cleaned event files. If a bin has >2000 counts, and if more than 50% of those come from <1% of pixels, then it is considered to be noise-dominated and hence unusable.
| Quadrant | # 1 sec bins | Bins with >0 counts | Bins with >2000 counts | High rate bins dominated by noise | Noise dominated (total time) | Noise dominated (detector-on time) | Marked lightcurve |
|---|---|---|---|---|---|---|---|
| A | 9010 | 7167 | 17 | 17 | 0.19% | 0.24% | 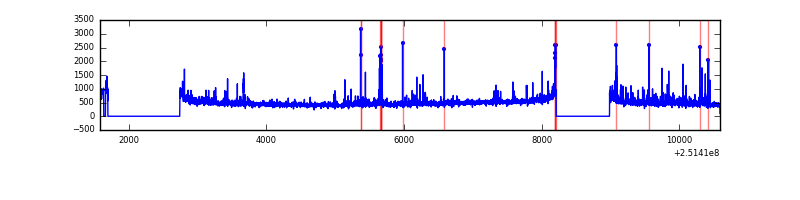 |
| B | 9010 | 7166 | 283 | 283 | 3.14% | 3.95% | 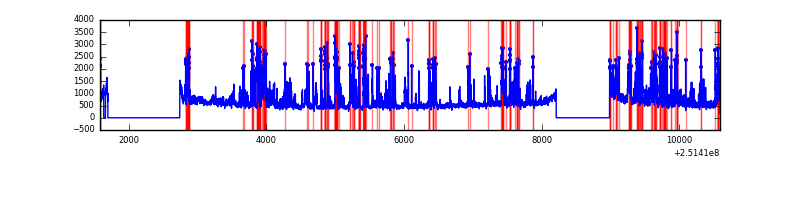 |
| C | 9010 | 7168 | 3 | 3 | 0.03% | 0.04% | 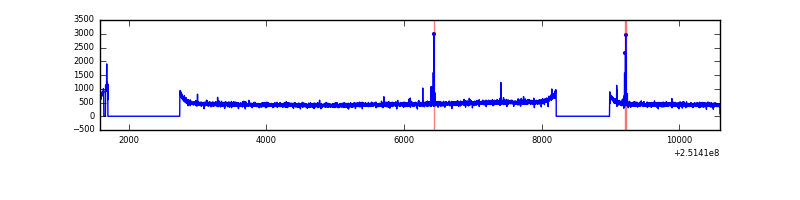 |
| D | 9010 | 7168 | 38 | 38 | 0.42% | 0.53% | 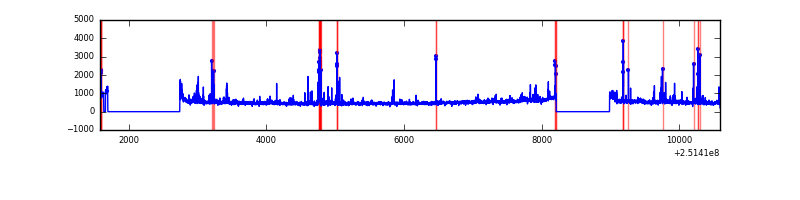 |
Top three noisy pixels from each quadrant. If the there are fewer than three noisy pixels in the level2.evt file, extra rows are filled as -1
| Pixel properties | Quadrant properties | ||||||
|---|---|---|---|---|---|---|---|
| Quadrant | DetID | PixID | Counts | Sigma | Mean | Median | Sigma |
| A | 1 | 162 | 111117 | 626.2 | 862 | 842 | 176.1 |
| A | 5 | 16 | 73000 | 409.75 | 862 | 842 | 176.1 |
| A | 1 | 178 | 51922 | 290.06 | 862 | 842 | 176.1 |
| B | 4 | 239 | 1449347 | 8787.97 | 848 | 830 | 164.8 |
| B | 4 | 206 | 236120 | 1427.47 | 848 | 830 | 164.8 |
| B | 0 | 231 | 226780 | 1370.81 | 848 | 830 | 164.8 |
| C | 14 | 234 | 29181 | 144.71 | 834 | 838 | 195.9 |
| C | 13 | 61 | 6082 | 26.77 | 834 | 838 | 195.9 |
| C | 3 | 202 | 2027 | 6.07 | 834 | 838 | 195.9 |
| D | 8 | 195 | 365165 | 1815.28 | 827 | 804 | 200.7 |
| D | 1 | 52 | 268183 | 1332.11 | 827 | 804 | 200.7 |
| D | 13 | 104 | 71767 | 353.54 | 827 | 804 | 200.7 |
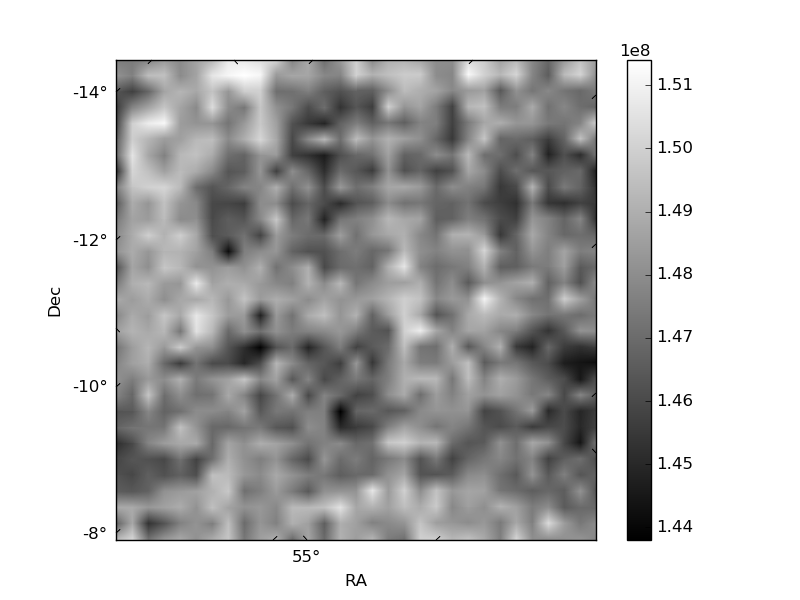
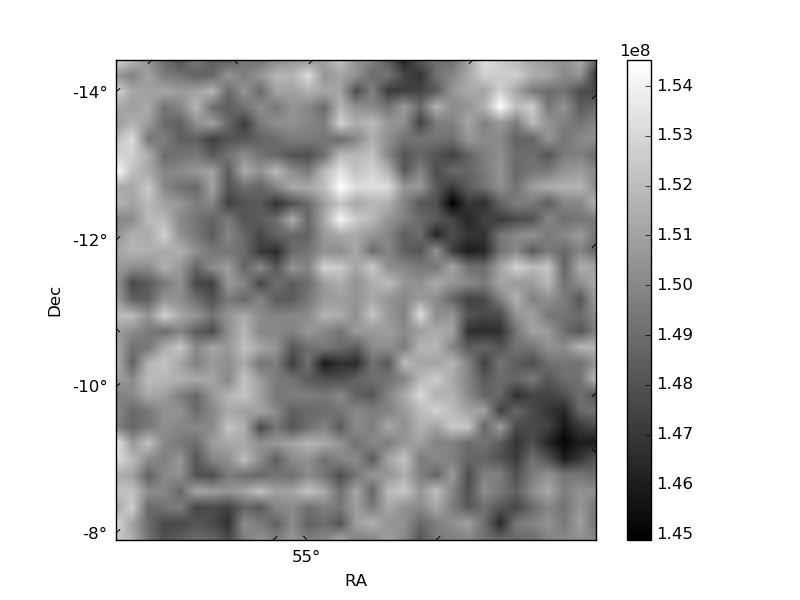
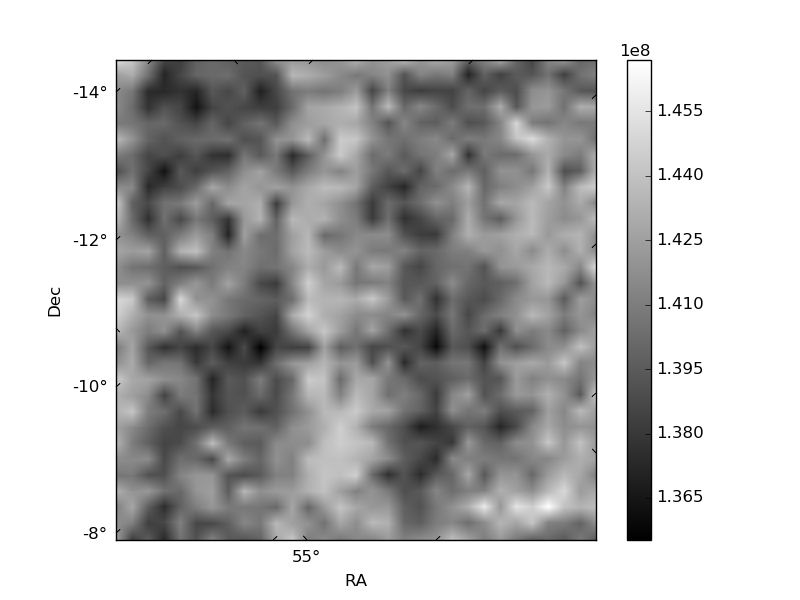
Histogram calculated using DETX and DETY for each event in the final _common_clean file
| Quadrant A | 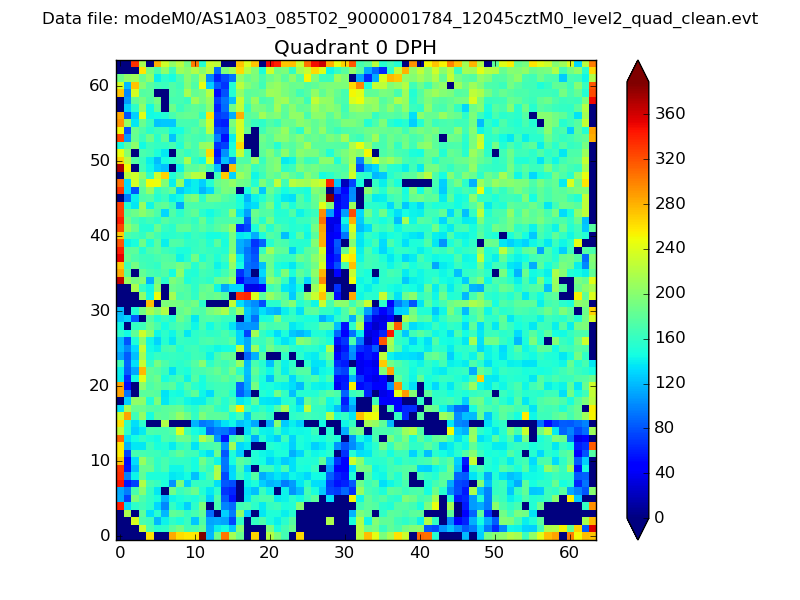 |
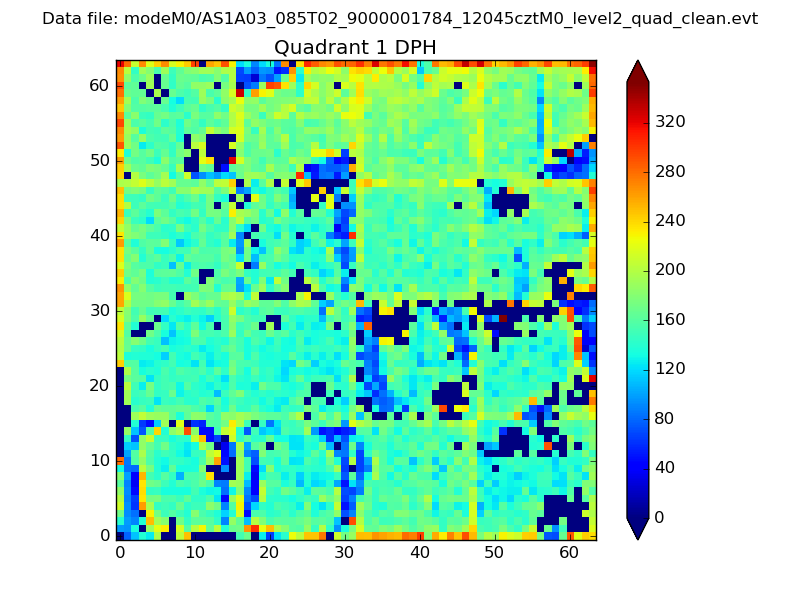 |
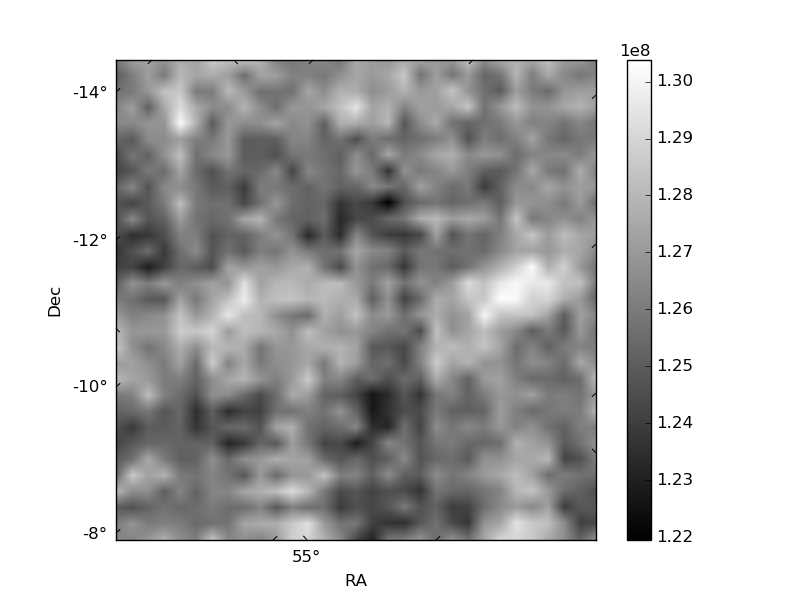
Quadrant B |
|---|---|---|---|
| Quadrant D | 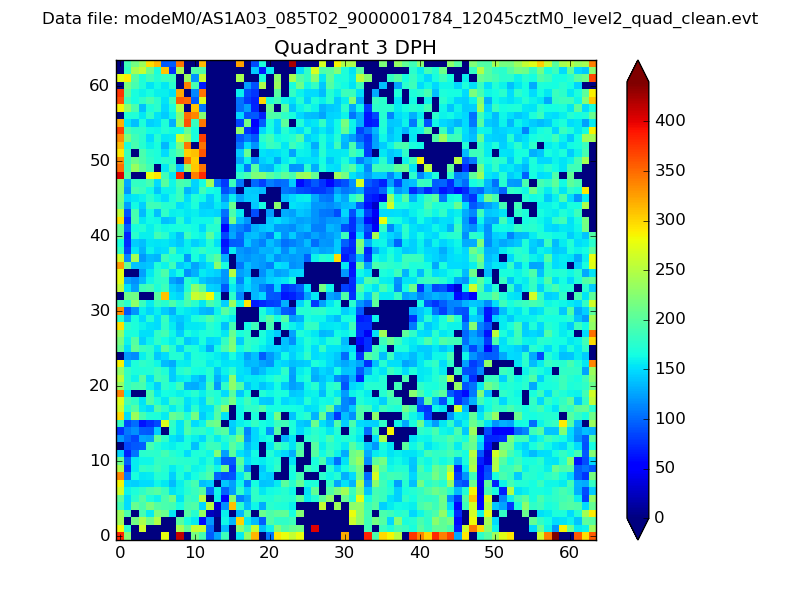 |
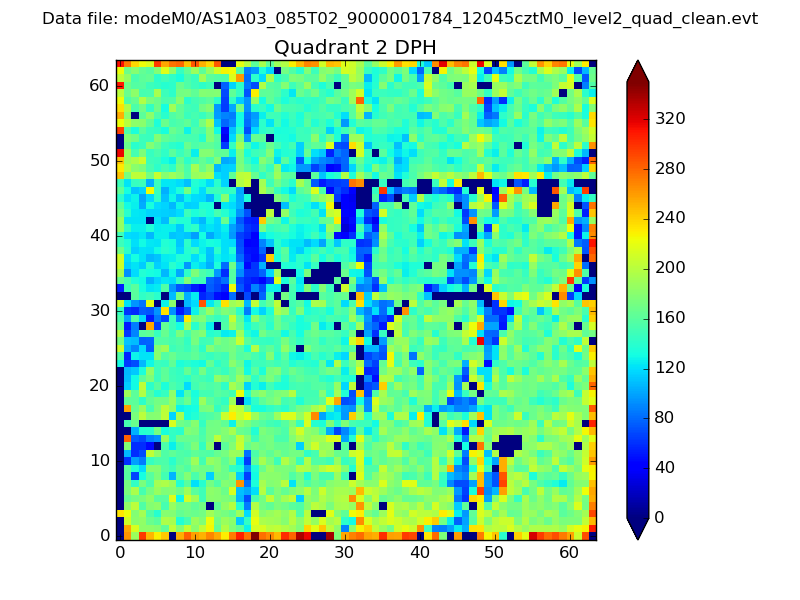 |
Quadrant C |
| Plot type | Count rate plots | Images |
|---|---|---|
| Comparison with Poisson distribution Blue bars denote a histogram of data divided into 1 sec bins. Red curve is a Poisson curve with rate = median count rate of data. |
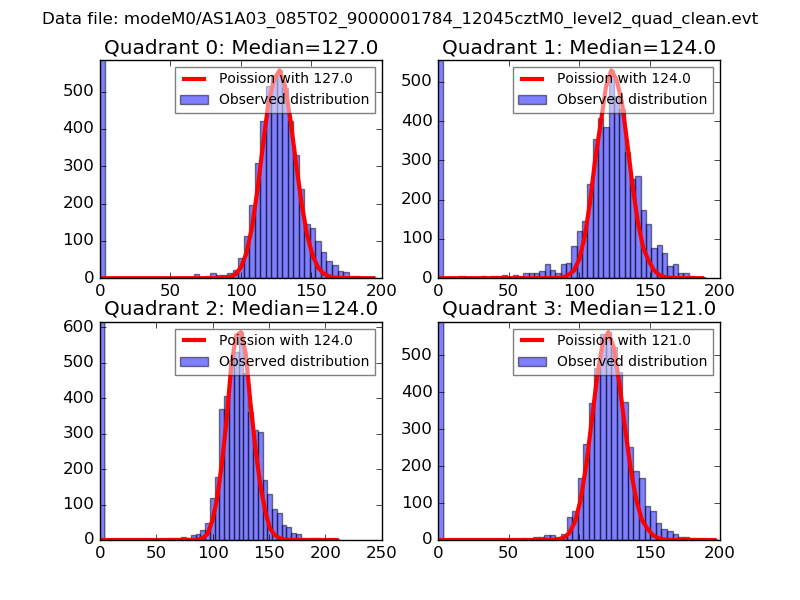 |
 |
| Quadrant-wise count rates Data is divided into 100 sec bins |
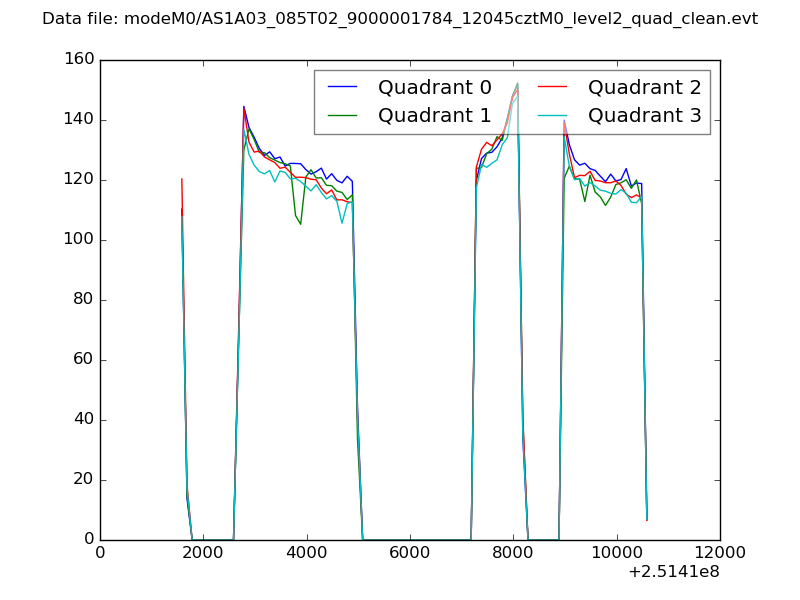 |
|
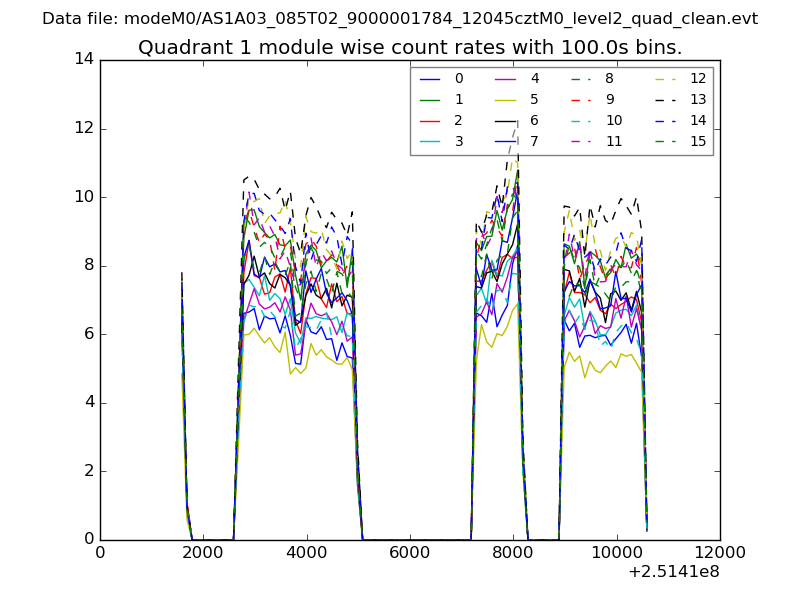
| Module-wise count rates for Quadrant A Data is divided into 100 sec bins |
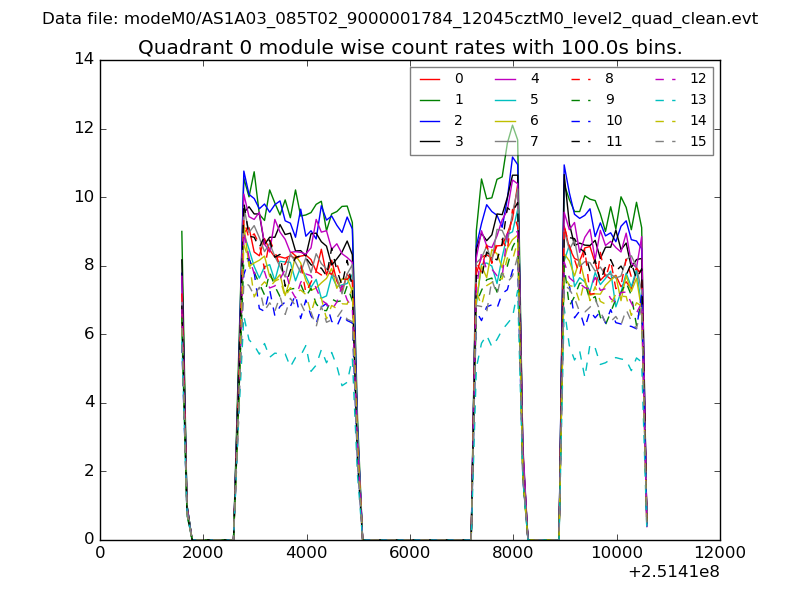 |
 |
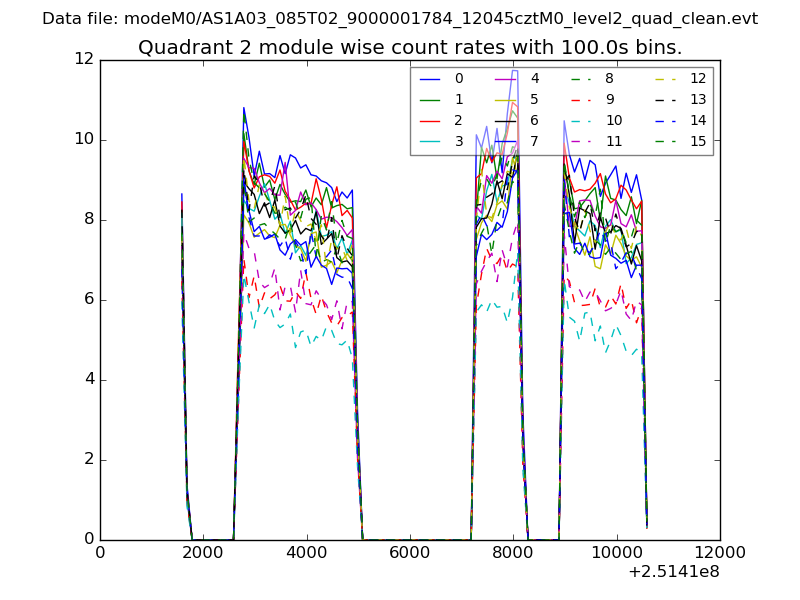
| Module-wise count rates for Quadrant B Data is divided into 100 sec bins |
 |
 |
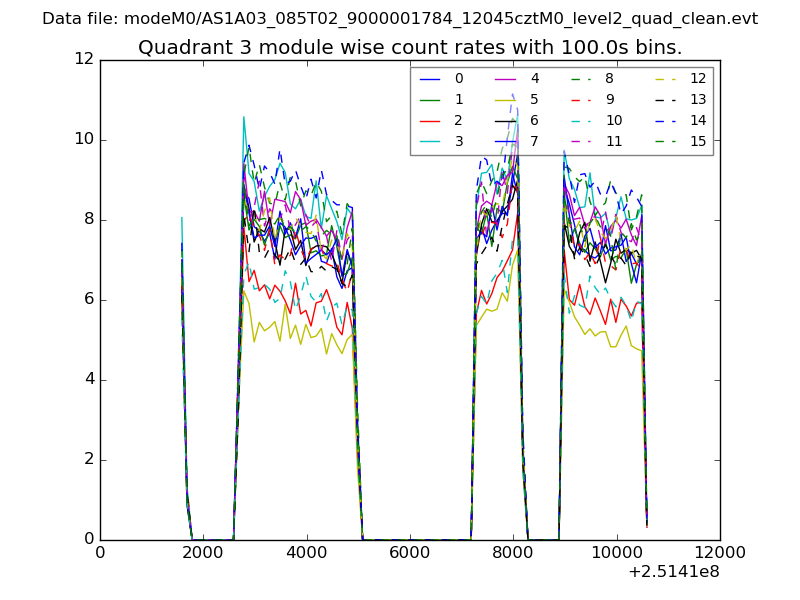
| Module-wise count rates for Quadrant C Data is divided into 100 sec bins |
 |
 |
| Module-wise count rates for Quadrant D Data is divided into 100 sec bins |
 |
 |
| Parameter | Plot |
|---|---|
| CZT HV Monitor | 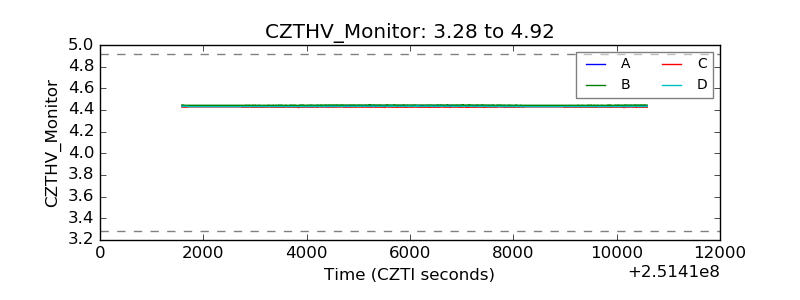 |
| D_VDD |  |
| Temperature 1 | 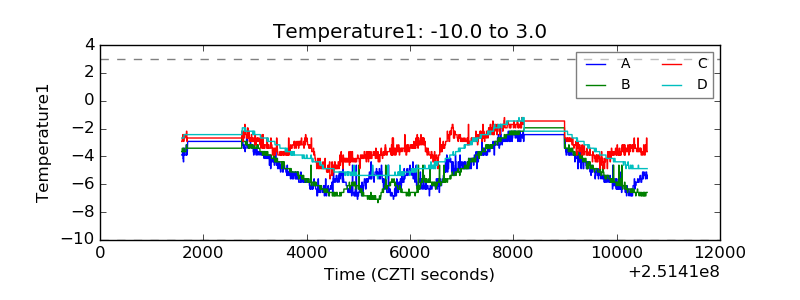 |
| Veto HV Monitor | 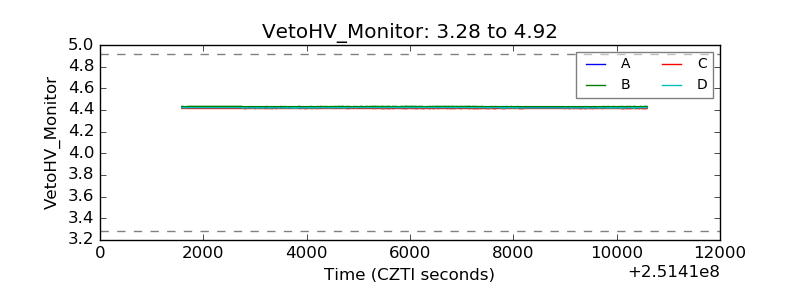 |
| Veto LLD | 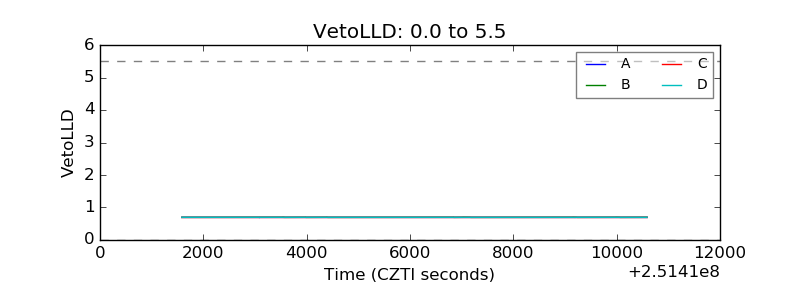 |
| Alpha Counter |  |
| _CPM_Rate |  |
| CZT Counter | 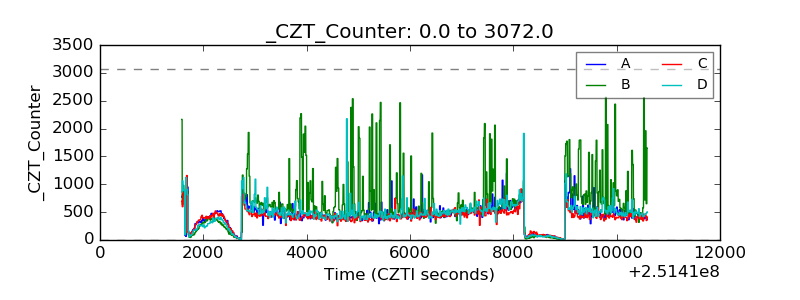 |
| +2.5 Volts monitor |  |
| +5 Volts monitor |  |
| _ROLL_ROT | 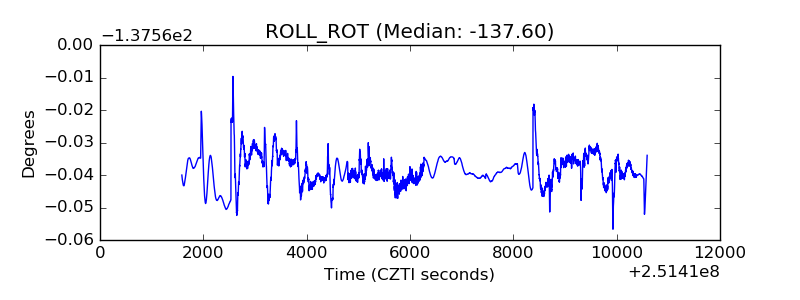 |
| _Roll_DEC | 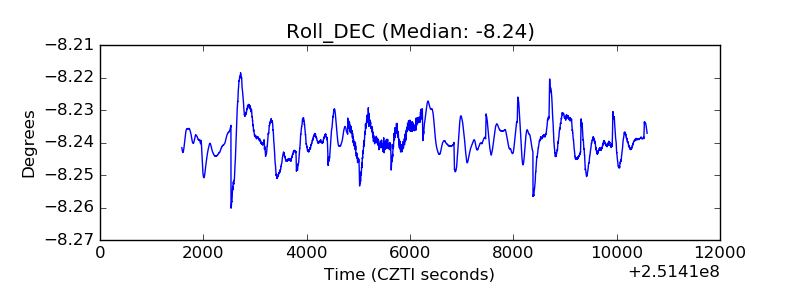 |
| _Roll_RA |  |
| Veto Counter | 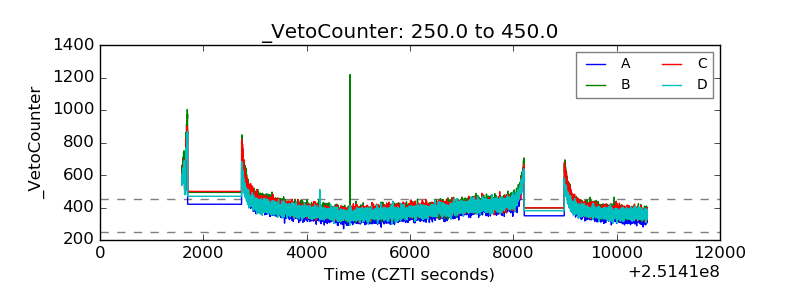 |