| Param | Original file | Final file |
|---|---|---|
| Filename | modeM0/AS1A03_085T02_9000001784_12047cztM0_level2.evt | modeM0/AS1A03_085T02_9000001784_12047cztM0_level2_quad_clean.evt |
| Size (bytes) | 664,326,720 | 113,880,960 |
| Size | 633.6 MB | 108.6 MB |
| Events in quadrant A | 4,393,940 | 729,156 |
| Events in quadrant B | 6,251,231 | 713,268 |
| Events in quadrant C | 3,899,876 | 718,815 |
| Events in quadrant D | 4,995,529 | 694,195 |
| Mode M9 | |||
|---|---|---|---|
| Quadrant | BADHDUFLAG | Total packets | Discarded packets |
| A | 0 | 6 | 0 |
| B | 0 | 6 | 0 |
| C | 0 | 6 | 0 |
| D | 0 | 6 | 0 |
| Mode SS | |||
|---|---|---|---|
| Quadrant | BADHDUFLAG | Total packets | Discarded packets |
| A | 0 | 174 | 0 |
| B | 0 | 174 | 0 |
| C | 0 | 174 | 0 |
| D | 0 | 174 | 0 |
| Mode M0 | |||
|---|---|---|---|
| Quadrant | BADHDUFLAG | Total packets | Discarded packets |
| A | 0 | 18777 | 3 |
| B | 0 | 24387 | 2 |
| C | 0 | 17589 | 2 |
| D | 0 | 20542 | 2 |
| Quadrant | Total seconds | Saturated seconds | Saturation percentage |
|---|---|---|---|
| A | 8545 | 143 | 1.673493% |
| B | 8545 | 459 | 5.371562% |
| C | 8545 | 64 | 0.748976% |
| D | 8545 | 135 | 1.579871% |
Noise dominated data is calculated using 1-second bins in cleaned event files. If a bin has >2000 counts, and if more than 50% of those come from <1% of pixels, then it is considered to be noise-dominated and hence unusable.
| Quadrant | # 1 sec bins | Bins with >0 counts | Bins with >2000 counts | High rate bins dominated by noise | Noise dominated (total time) | Noise dominated (detector-on time) | Marked lightcurve |
|---|---|---|---|---|---|---|---|
| A | 9121 | 8549 | 29 | 29 | 0.32% | 0.34% | 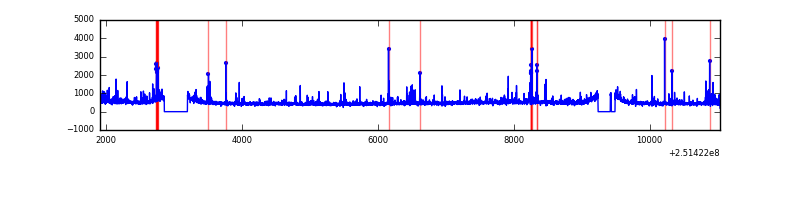 |
| B | 9121 | 8548 | 164 | 164 | 1.80% | 1.92% | 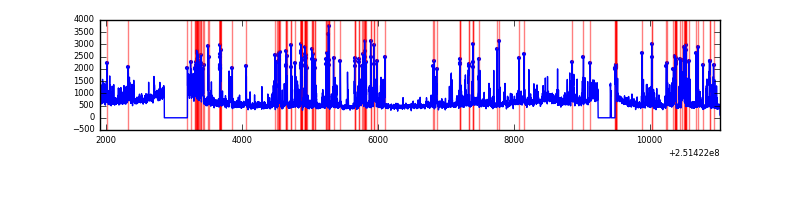 |
| C | 9121 | 8548 | 1 | 1 | 0.01% | 0.01% |  |
| D | 9121 | 8548 | 75 | 75 | 0.82% | 0.88% | 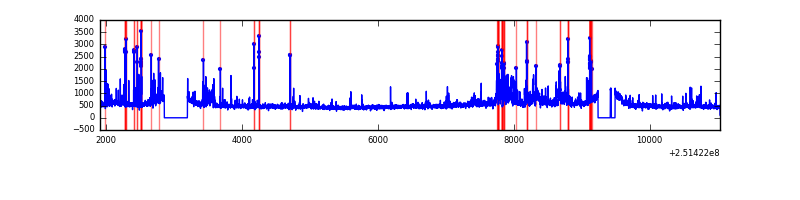 |
Top three noisy pixels from each quadrant. If the there are fewer than three noisy pixels in the level2.evt file, extra rows are filled as -1
| Pixel properties | Quadrant properties | ||||||
|---|---|---|---|---|---|---|---|
| Quadrant | DetID | PixID | Counts | Sigma | Mean | Median | Sigma |
| A | 1 | 162 | 127016 | 595.98 | 1027 | 1004 | 211.4 |
| A | 5 | 16 | 108283 | 507.38 | 1027 | 1004 | 211.4 |
| A | 1 | 178 | 56937 | 264.54 | 1027 | 1004 | 211.4 |
| B | 4 | 239 | 1258345 | 6409.14 | 1016 | 991 | 196.2 |
| B | 4 | 206 | 293461 | 1490.81 | 1016 | 991 | 196.2 |
| B | 15 | 204 | 246571 | 1251.8 | 1016 | 991 | 196.2 |
| C | 14 | 234 | 7982 | 29.75 | 997 | 998 | 234.8 |
| C | 13 | 61 | 7154 | 26.22 | 997 | 998 | 234.8 |
| C | 8 | 128 | 4211 | 13.69 | 997 | 998 | 234.8 |
| D | 1 | 52 | 687820 | 2879.23 | 991 | 963 | 238.6 |
| D | 8 | 195 | 342979 | 1433.69 | 991 | 963 | 238.6 |
| D | 13 | 104 | 102517 | 425.7 | 991 | 963 | 238.6 |
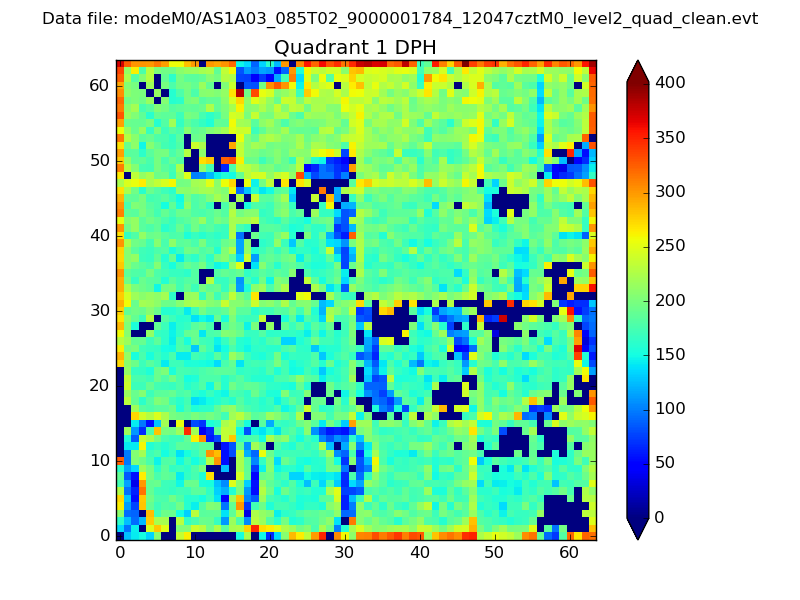
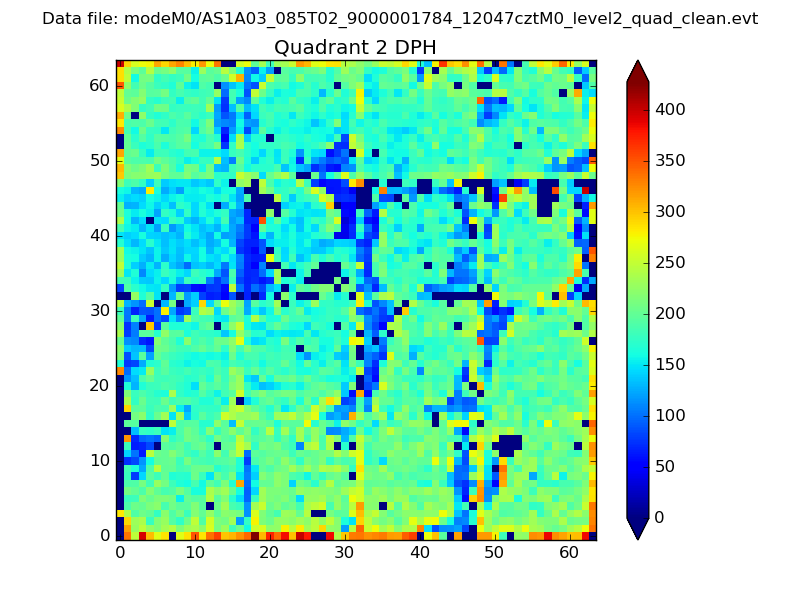
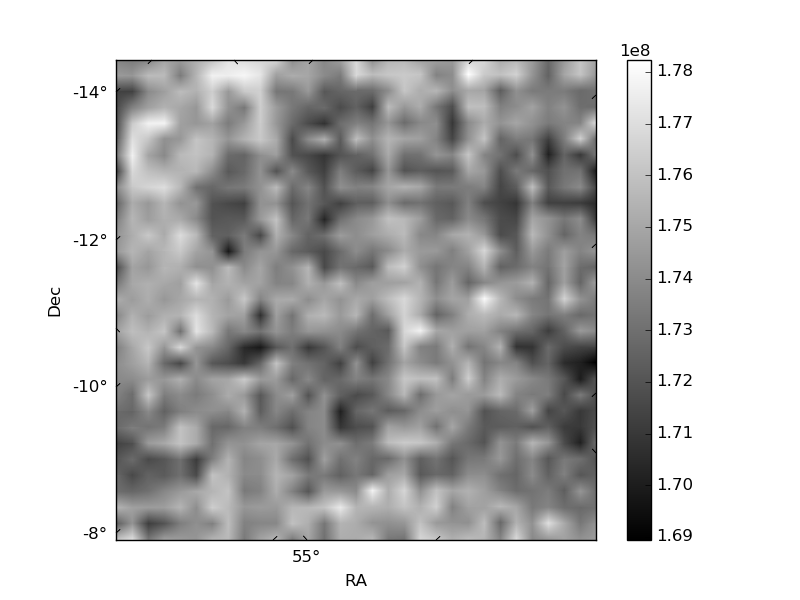
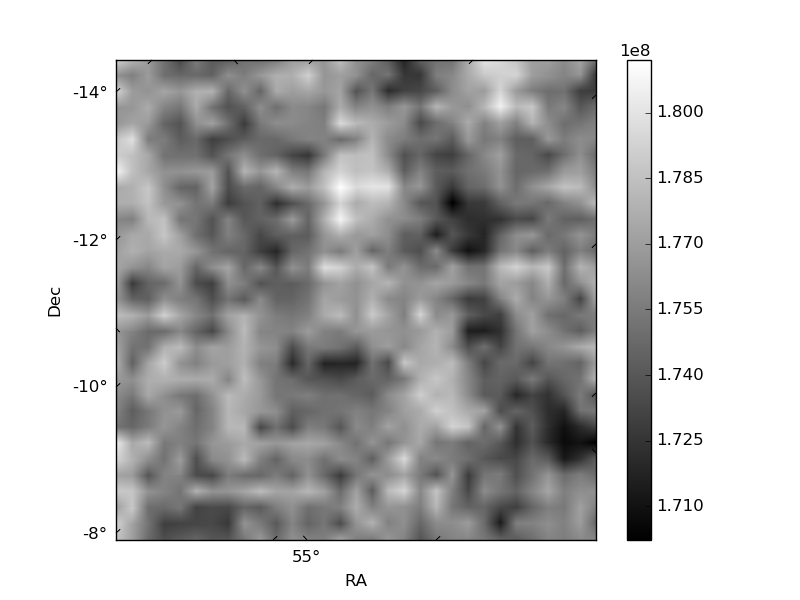
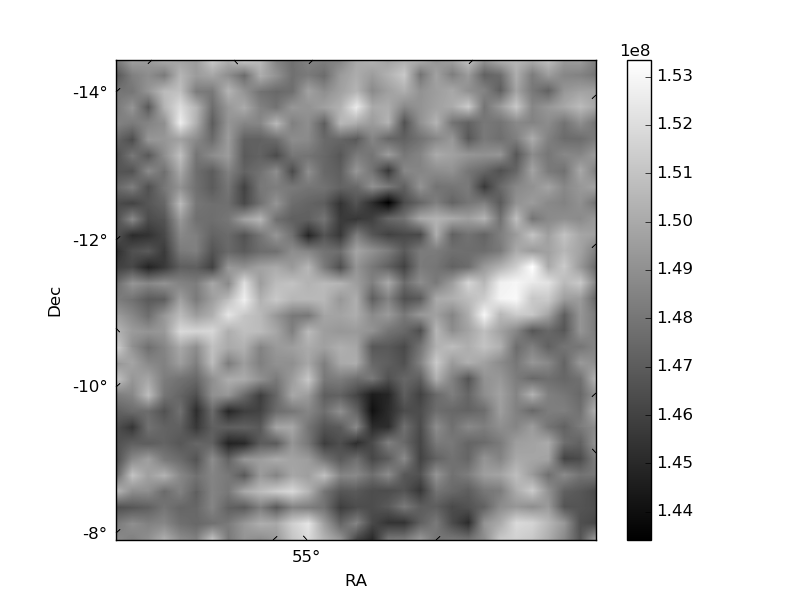
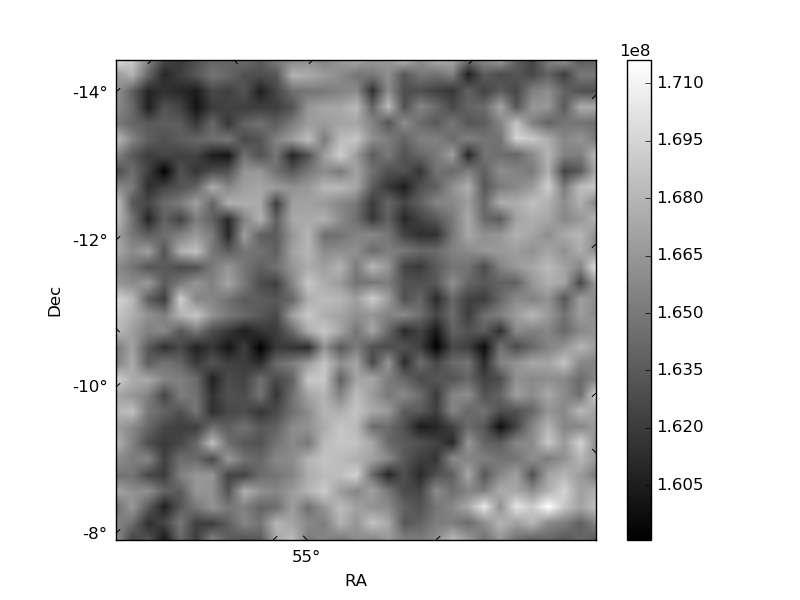
Histogram calculated using DETX and DETY for each event in the final _common_clean file
| Quadrant A | 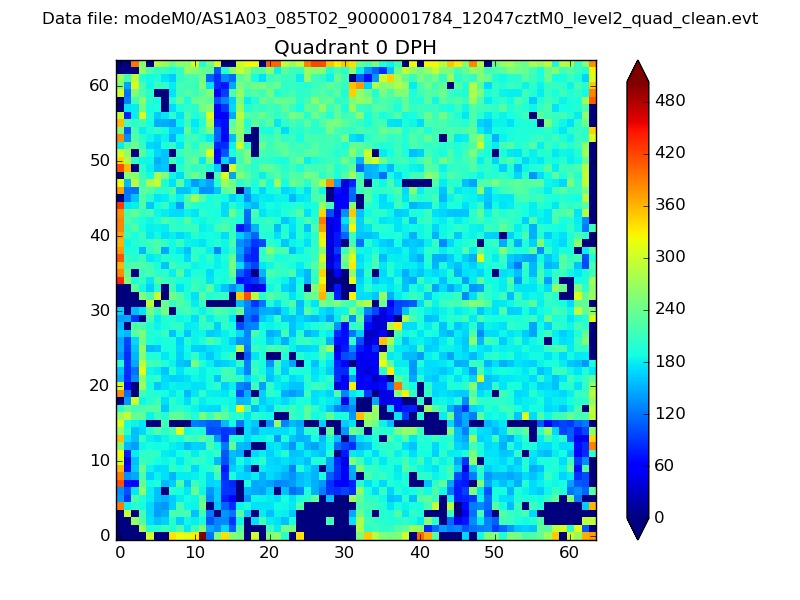 |
 |
Quadrant B |
|---|---|---|---|
| Quadrant D | 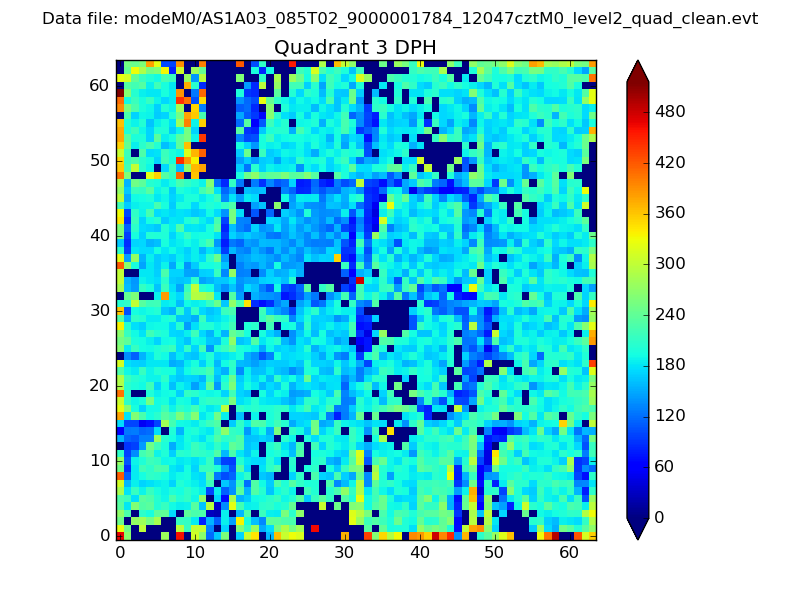 |
 |
Quadrant C |
| Plot type | Count rate plots | Images |
|---|---|---|
| Comparison with Poisson distribution Blue bars denote a histogram of data divided into 1 sec bins. Red curve is a Poisson curve with rate = median count rate of data. |
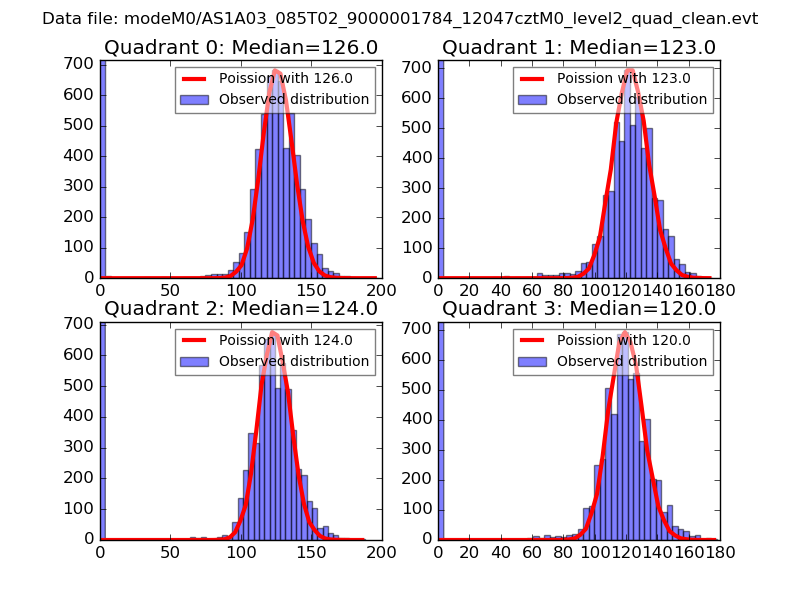 |
 |
| Quadrant-wise count rates Data is divided into 100 sec bins |
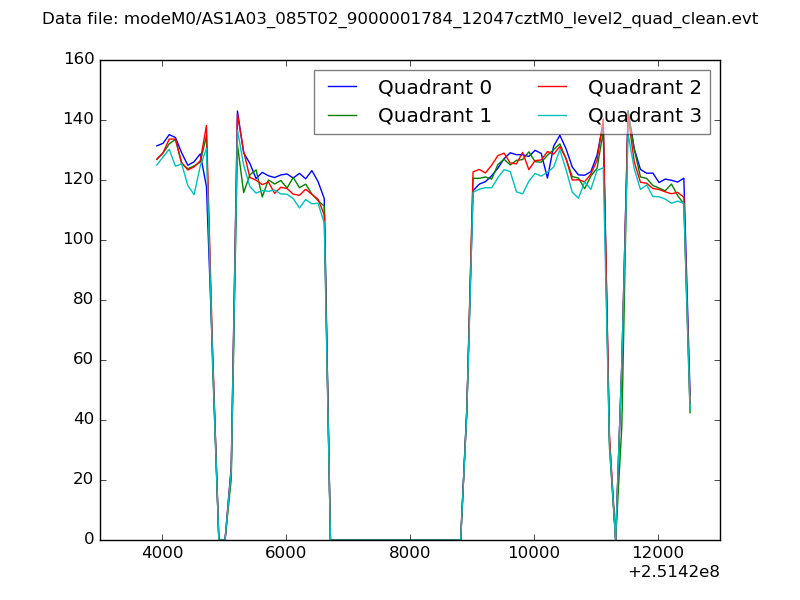 |
|
| Module-wise count rates for Quadrant A Data is divided into 100 sec bins |
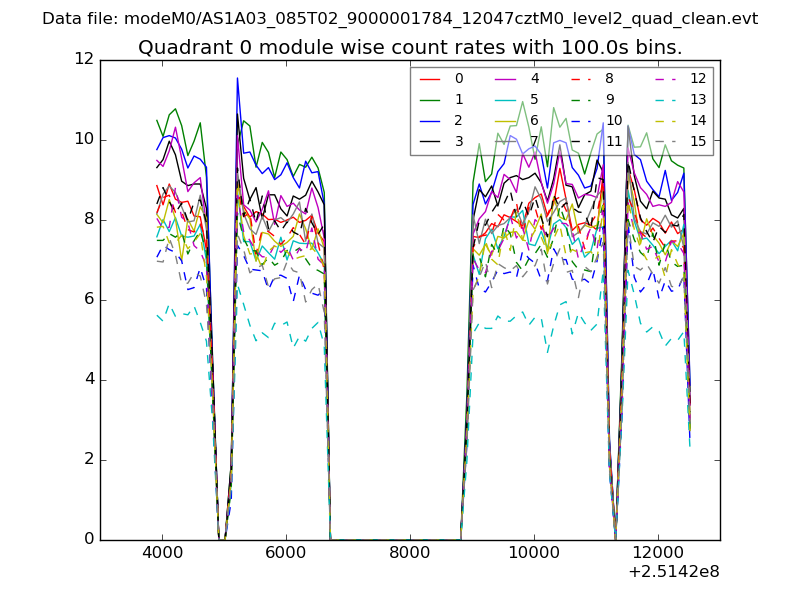 |
 |
| Module-wise count rates for Quadrant B Data is divided into 100 sec bins |
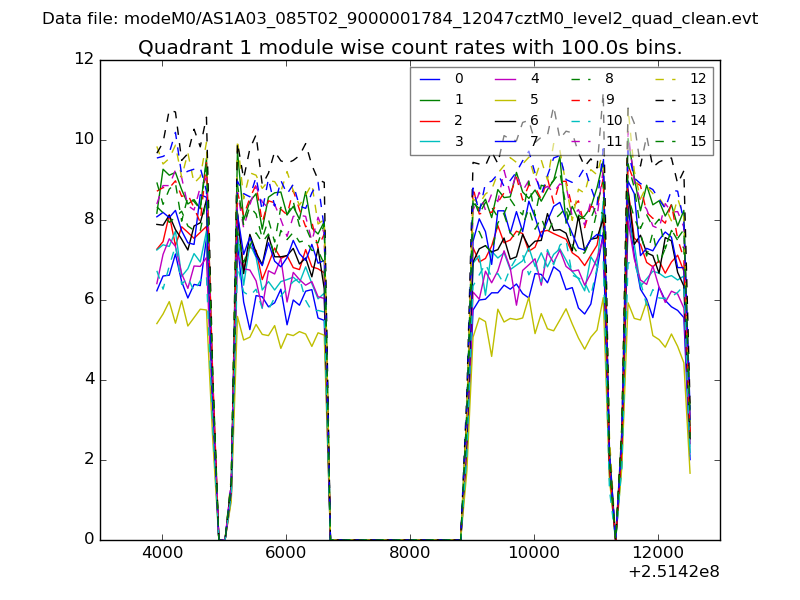 |
 |
| Module-wise count rates for Quadrant C Data is divided into 100 sec bins |
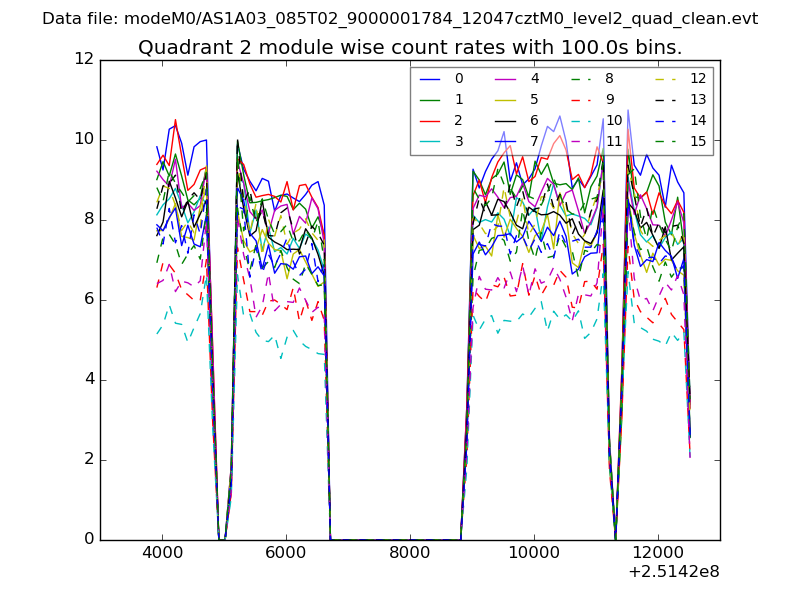 |
 |
| Module-wise count rates for Quadrant D Data is divided into 100 sec bins |
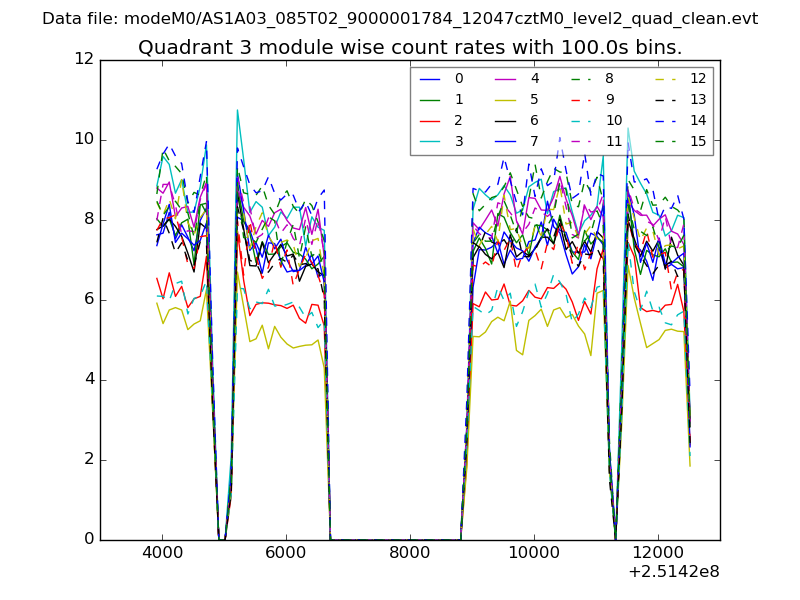 |
 |
| Parameter | Plot |
|---|---|
| CZT HV Monitor | 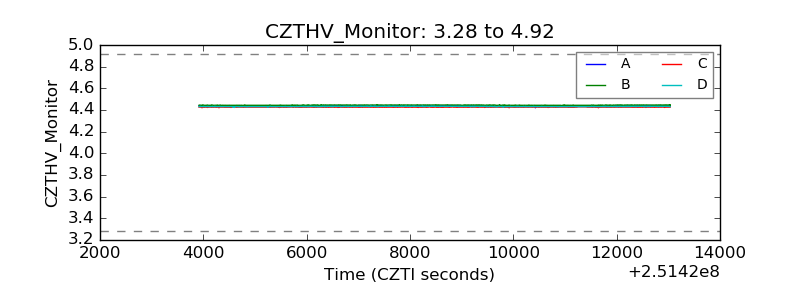 |
| D_VDD | 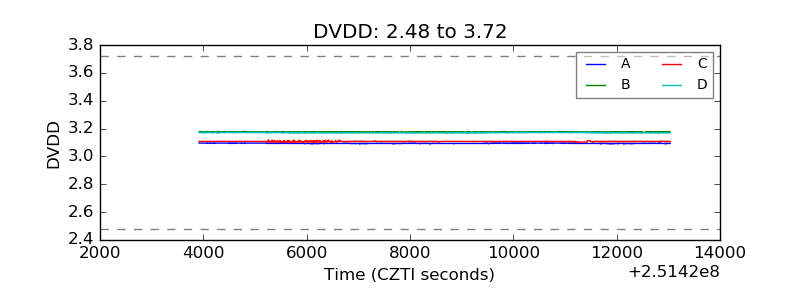 |
| Temperature 1 | 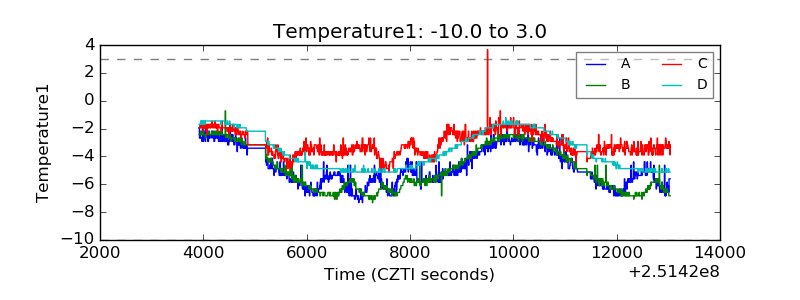 |
| Veto HV Monitor | 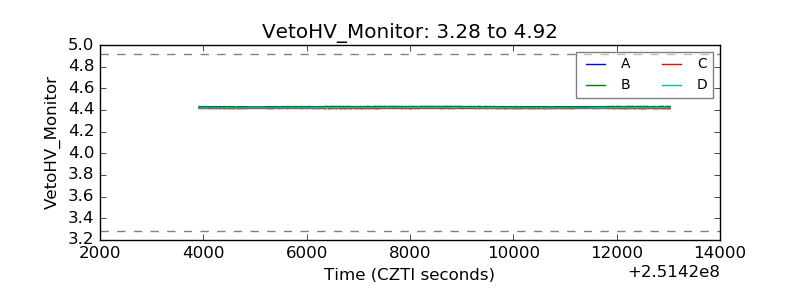 |
| Veto LLD | 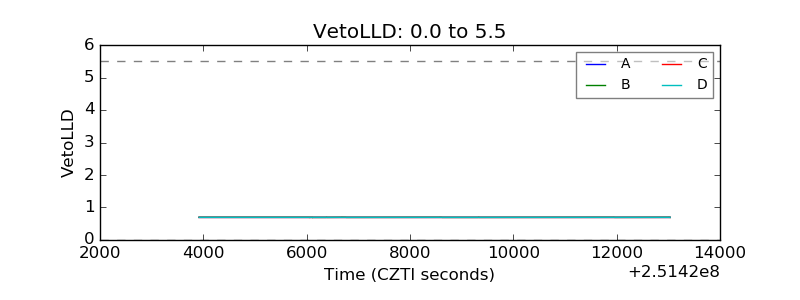 |
| Alpha Counter | 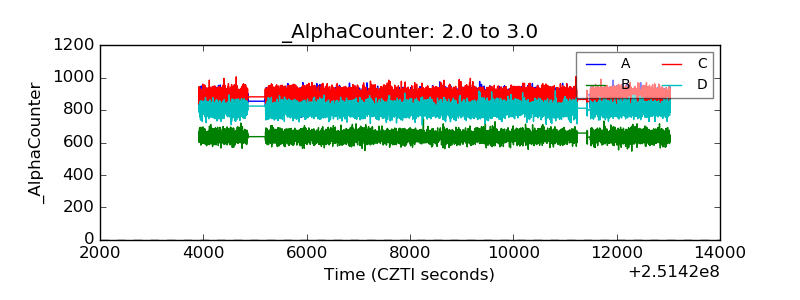 |
| _CPM_Rate | 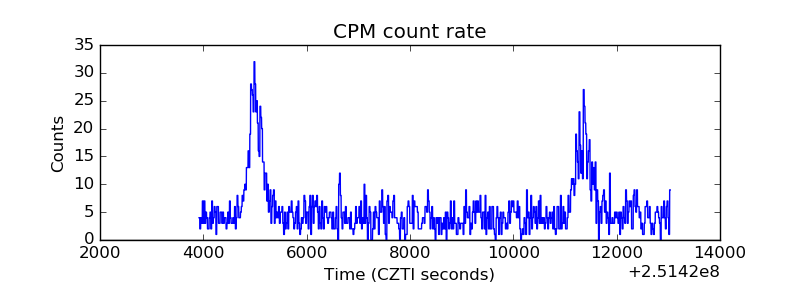 |
| CZT Counter |  |
| +2.5 Volts monitor |  |
| +5 Volts monitor |  |
| _ROLL_ROT | 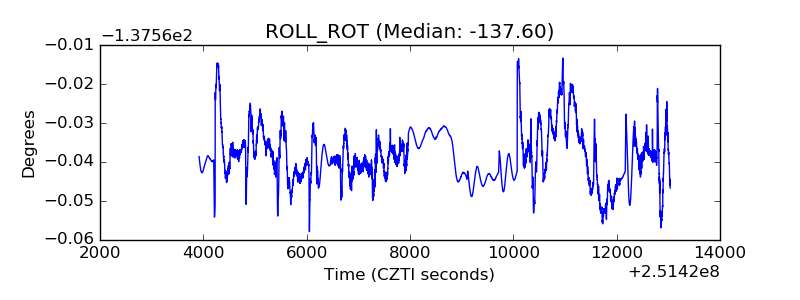 |
| _Roll_DEC | 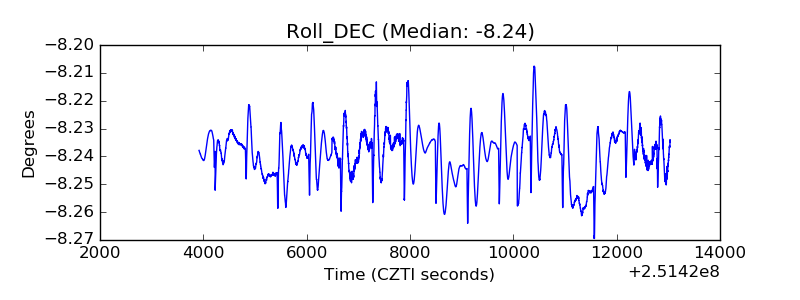 |
| _Roll_RA | 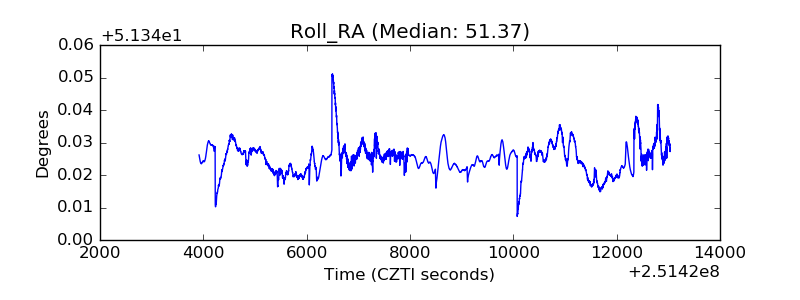 |
| Veto Counter | 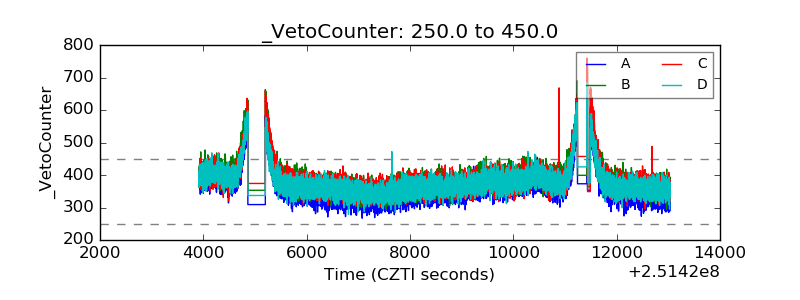 |