| Param | Original file | Final file |
|---|---|---|
| Filename | modeM0/AS1A03_085T02_9000001784_12048cztM0_level2.evt | modeM0/AS1A03_085T02_9000001784_12048cztM0_level2_quad_clean.evt |
| Size (bytes) | 643,086,720 | 95,757,120 |
| Size | 613.3 MB | 91.3 MB |
| Events in quadrant A | 4,382,511 | 597,933 |
| Events in quadrant B | 5,946,901 | 584,933 |
| Events in quadrant C | 3,725,981 | 592,604 |
| Events in quadrant D | 4,872,509 | 561,829 |
| Mode M9 | |||
|---|---|---|---|
| Quadrant | BADHDUFLAG | Total packets | Discarded packets |
| A | 0 | 6 | 0 |
| B | 0 | 6 | 0 |
| C | 0 | 6 | 0 |
| D | 0 | 6 | 0 |
| Mode SS | |||
|---|---|---|---|
| Quadrant | BADHDUFLAG | Total packets | Discarded packets |
| A | 0 | 166 | 0 |
| B | 0 | 166 | 0 |
| C | 0 | 166 | 0 |
| D | 0 | 166 | 0 |
| Mode M0 | |||
|---|---|---|---|
| Quadrant | BADHDUFLAG | Total packets | Discarded packets |
| A | 0 | 18366 | 3 |
| B | 0 | 23225 | 2 |
| C | 0 | 16770 | 2 |
| D | 0 | 19726 | 2 |
| Quadrant | Total seconds | Saturated seconds | Saturation percentage |
|---|---|---|---|
| A | 8087 | 205 | 2.534933% |
| B | 8087 | 498 | 6.158031% |
| C | 8087 | 115 | 1.422035% |
| D | 8087 | 297 | 3.672561% |
Noise dominated data is calculated using 1-second bins in cleaned event files. If a bin has >2000 counts, and if more than 50% of those come from <1% of pixels, then it is considered to be noise-dominated and hence unusable.
| Quadrant | # 1 sec bins | Bins with >0 counts | Bins with >2000 counts | High rate bins dominated by noise | Noise dominated (total time) | Noise dominated (detector-on time) | Marked lightcurve |
|---|---|---|---|---|---|---|---|
| A | 8668 | 8090 | 49 | 49 | 0.57% | 0.61% | 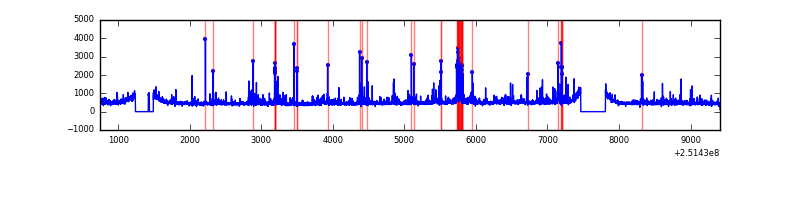 |
| B | 8668 | 8089 | 192 | 192 | 2.22% | 2.37% | 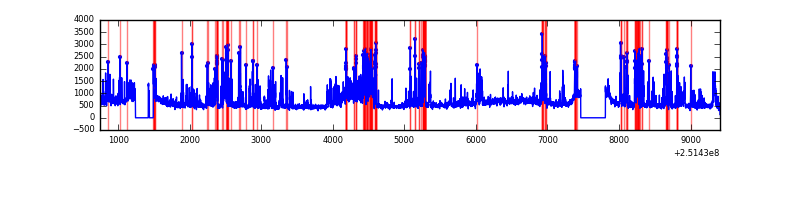 |
| C | 8668 | 8090 | 0 | 0 | 0.00% | 0.00% |  |
| D | 8668 | 8090 | 173 | 173 | 2.00% | 2.14% | 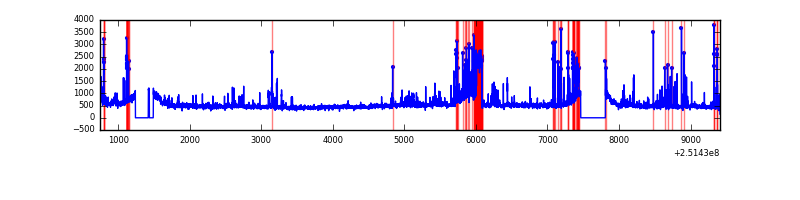 |
Top three noisy pixels from each quadrant. If the there are fewer than three noisy pixels in the level2.evt file, extra rows are filled as -1
| Pixel properties | Quadrant properties | ||||||
|---|---|---|---|---|---|---|---|
| Quadrant | DetID | PixID | Counts | Sigma | Mean | Median | Sigma |
| A | 13 | 251 | 307533 | 1541.19 | 969 | 947 | 198.9 |
| A | 1 | 162 | 132640 | 662.01 | 969 | 947 | 198.9 |
| A | 1 | 178 | 57863 | 286.11 | 969 | 947 | 198.9 |
| B | 4 | 239 | 1636438 | 8750.41 | 957 | 929 | 186.9 |
| B | 15 | 204 | 245595 | 1309.03 | 957 | 929 | 186.9 |
| B | 4 | 206 | 130094 | 691.07 | 957 | 929 | 186.9 |
| C | 7 | 247 | 19539 | 83.68 | 949 | 956 | 222.1 |
| C | 14 | 234 | 8796 | 35.31 | 949 | 956 | 222.1 |
| C | 13 | 61 | 7091 | 27.63 | 949 | 956 | 222.1 |
| D | 1 | 52 | 452628 | 1999.89 | 929 | 901 | 225.9 |
| D | 13 | 122 | 400763 | 1770.28 | 929 | 901 | 225.9 |
| D | 8 | 195 | 355536 | 1570.05 | 929 | 901 | 225.9 |
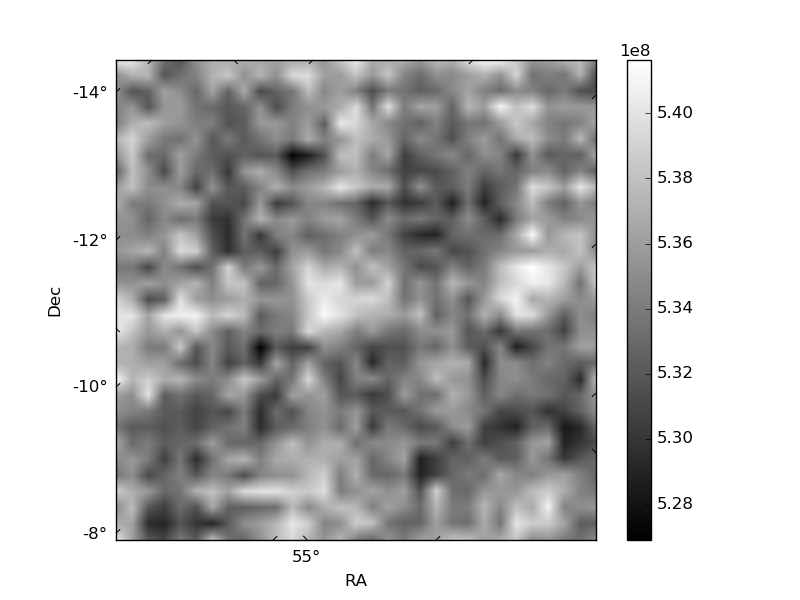
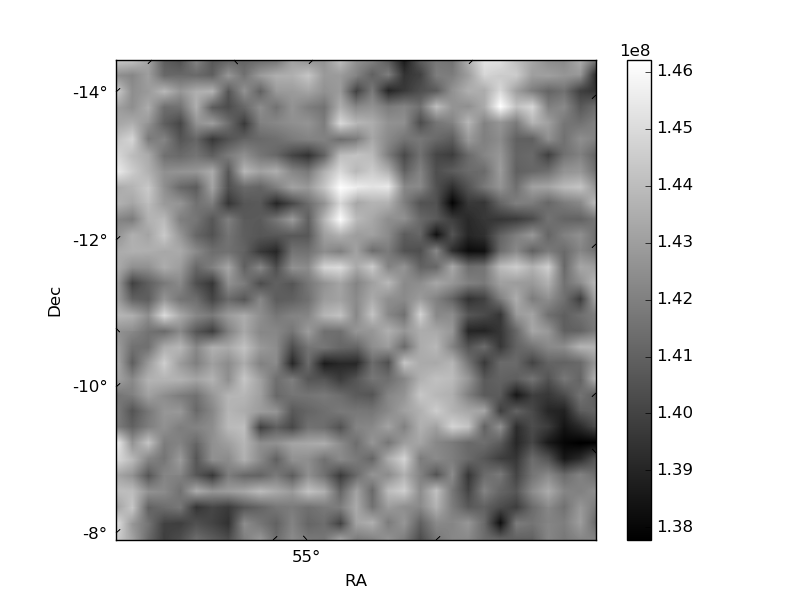
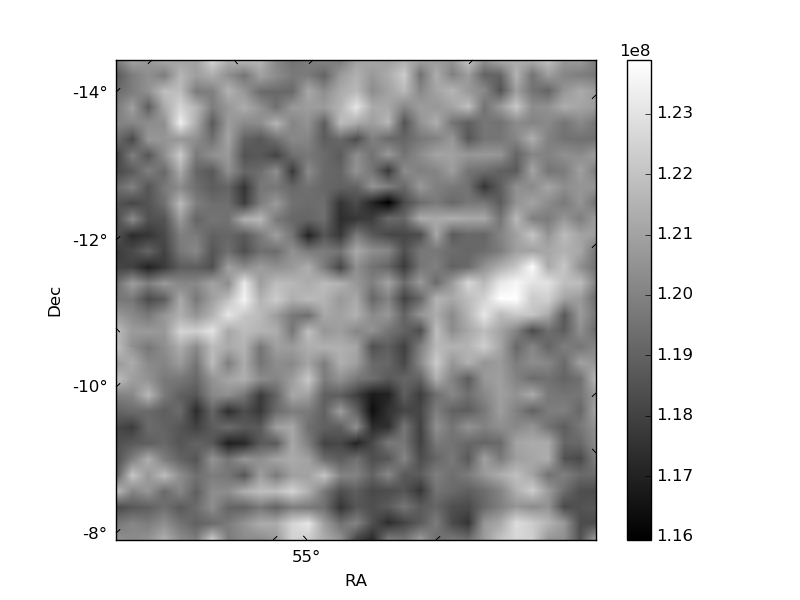
Histogram calculated using DETX and DETY for each event in the final _common_clean file
| Quadrant A |  |
 |
Quadrant B |
|---|---|---|---|
| Quadrant D |  |
 |
Quadrant C |
| Plot type | Count rate plots | Images |
|---|---|---|
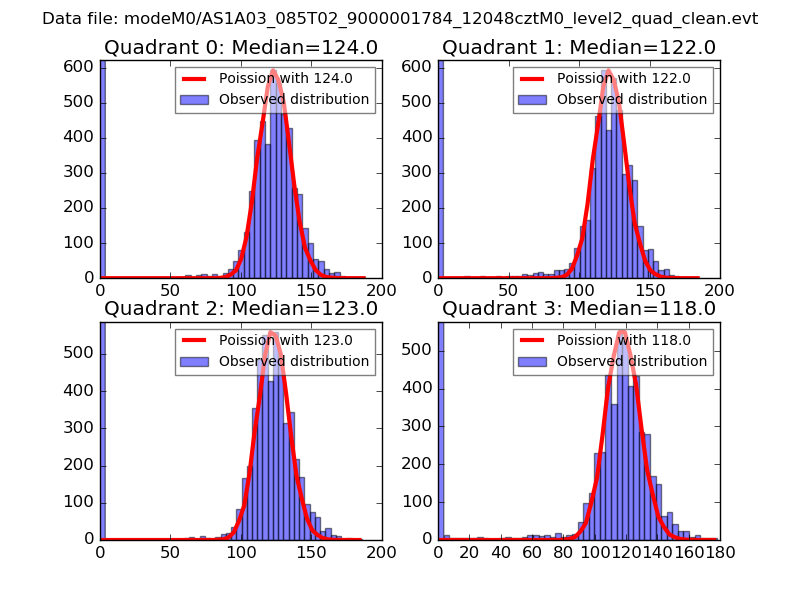
| Comparison with Poisson distribution Blue bars denote a histogram of data divided into 1 sec bins. Red curve is a Poisson curve with rate = median count rate of data. |
 |
 |
| Quadrant-wise count rates Data is divided into 100 sec bins |
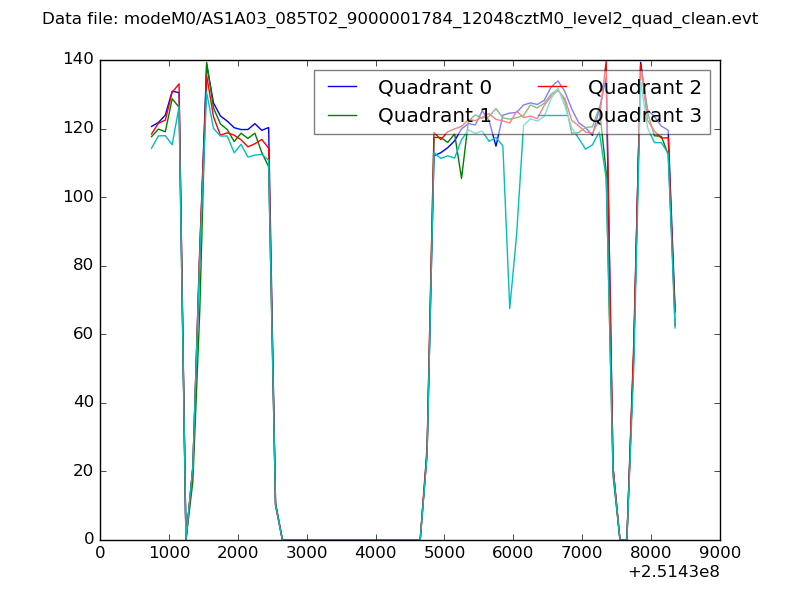 |
|
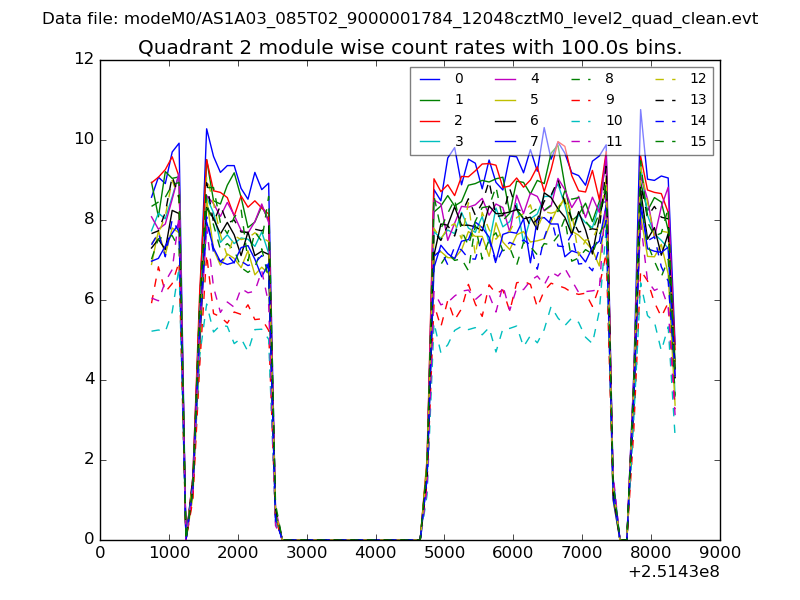
| Module-wise count rates for Quadrant A Data is divided into 100 sec bins |
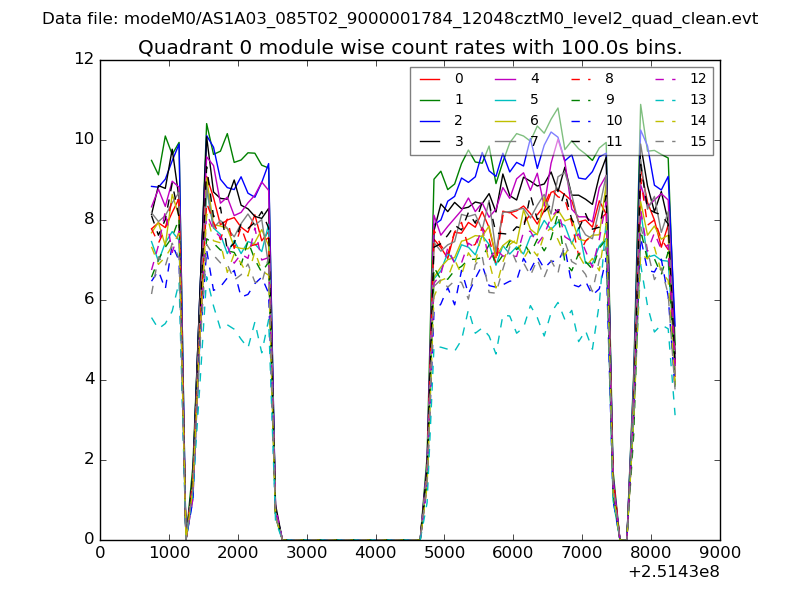 |
 |
| Module-wise count rates for Quadrant B Data is divided into 100 sec bins |
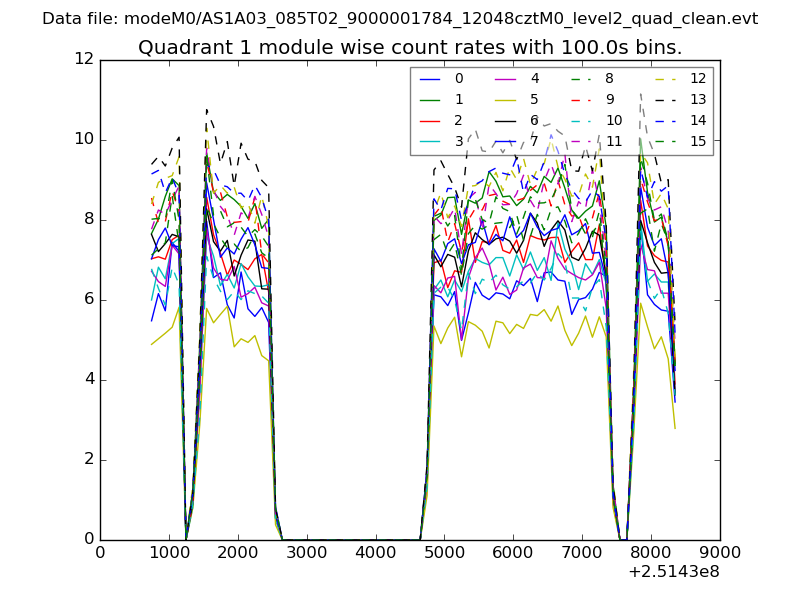 |
 |
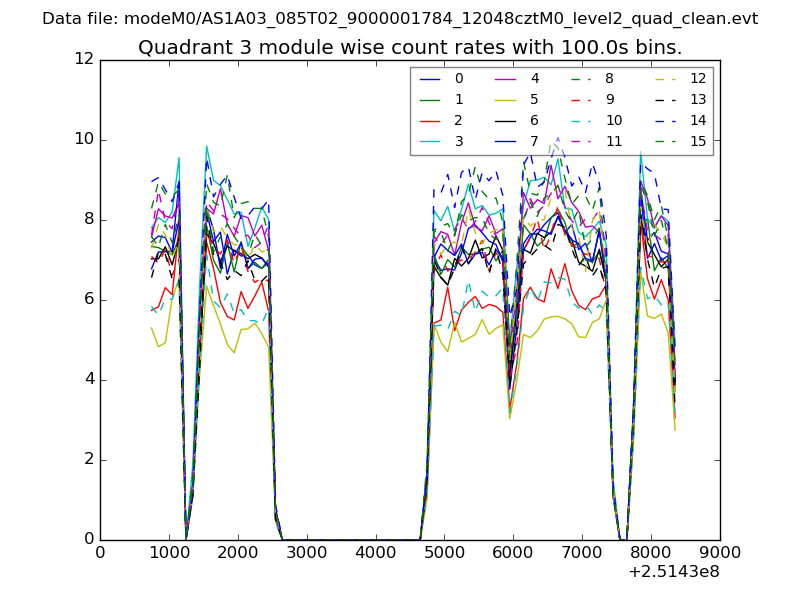
| Module-wise count rates for Quadrant C Data is divided into 100 sec bins |
 |
 |
| Module-wise count rates for Quadrant D Data is divided into 100 sec bins |
 |
 |
| Parameter | Plot |
|---|---|
| CZT HV Monitor | 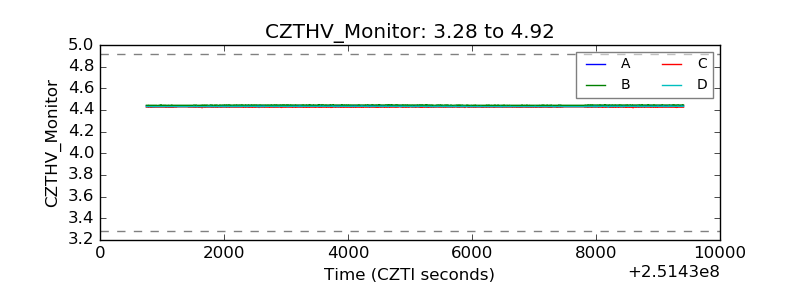 |
| D_VDD | 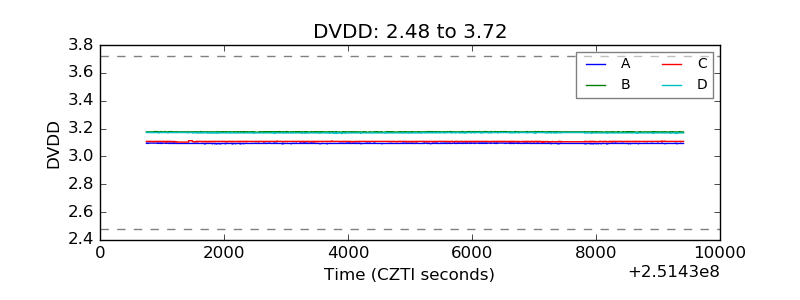 |
| Temperature 1 | 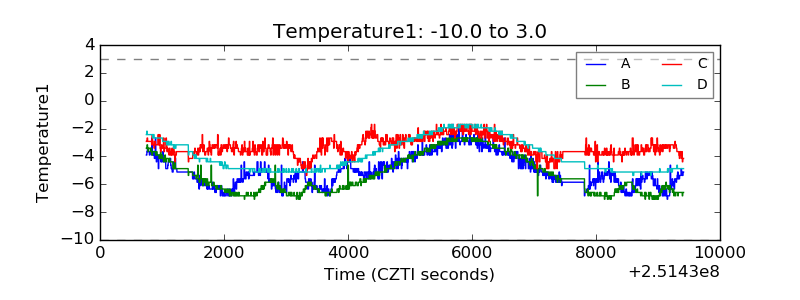 |
| Veto HV Monitor | 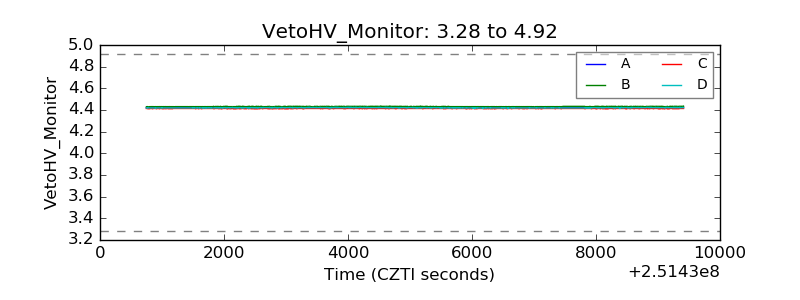 |
| Veto LLD | 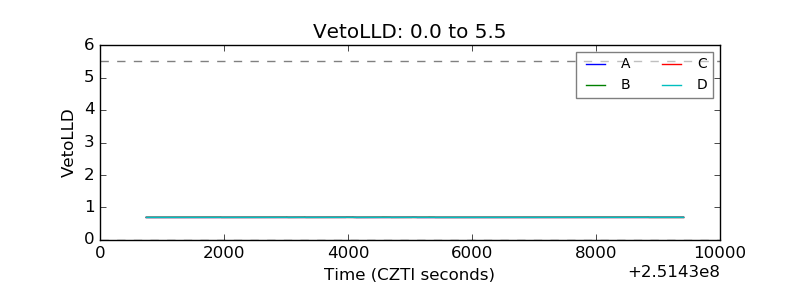 |
| Alpha Counter | 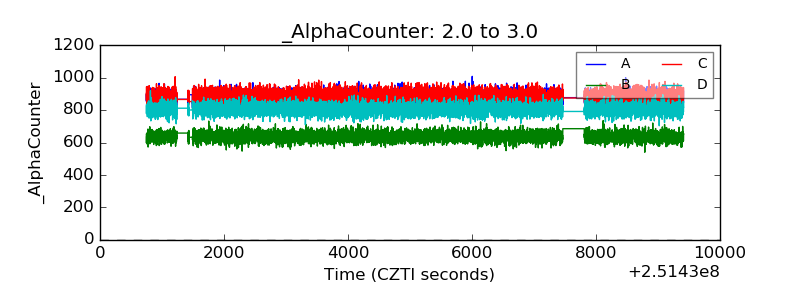 |
| _CPM_Rate | 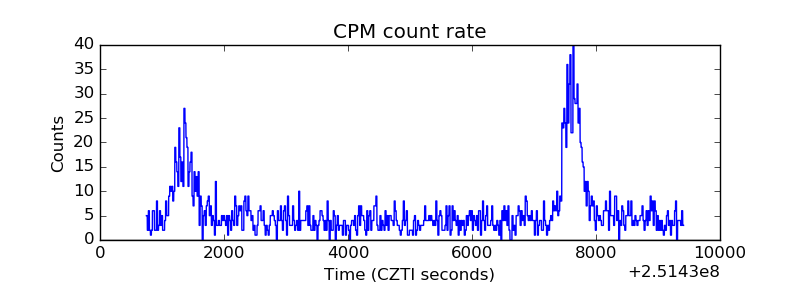 |
| CZT Counter | 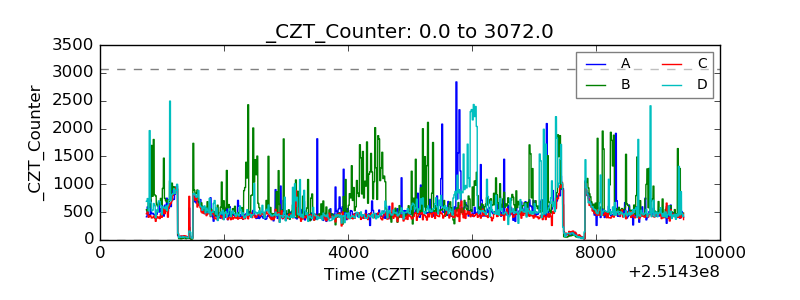 |
| +2.5 Volts monitor |  |
| +5 Volts monitor |  |
| _ROLL_ROT | 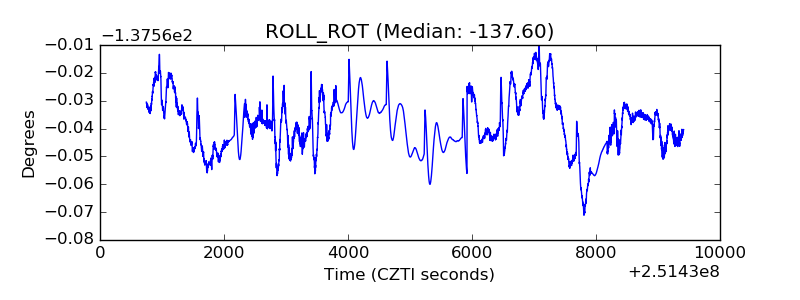 |
| _Roll_DEC | 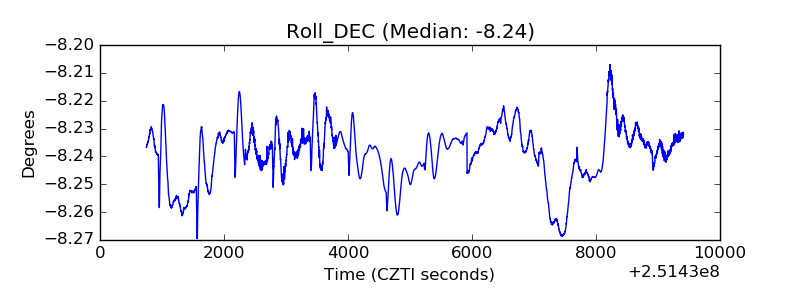 |
| _Roll_RA | 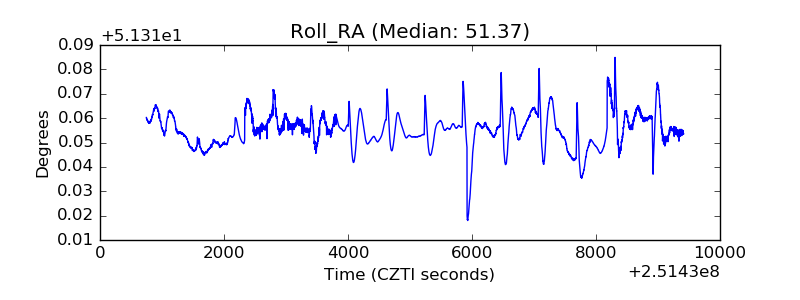 |
| Veto Counter | 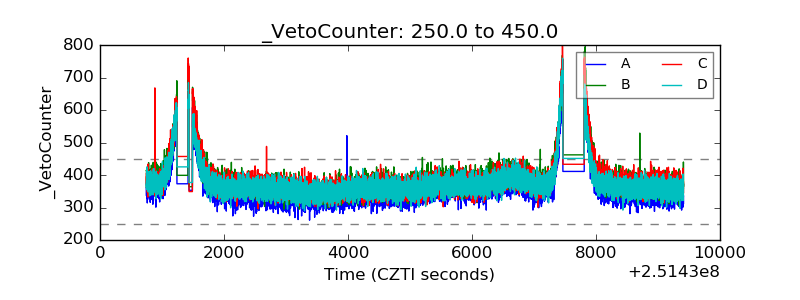 |