| Param | Original file | Final file |
|---|---|---|
| Filename | modeM0/AS1A03_085T02_9000001784_12050cztM0_level2.evt | modeM0/AS1A03_085T02_9000001784_12050cztM0_level2_quad_clean.evt |
| Size (bytes) | 574,657,920 | 74,684,160 |
| Size | 548.0 MB | 71.2 MB |
| Events in quadrant A | 3,830,342 | 440,607 |
| Events in quadrant B | 5,247,850 | 428,186 |
| Events in quadrant C | 3,463,805 | 434,762 |
| Events in quadrant D | 4,338,102 | 420,857 |
| Mode M9 | |||
|---|---|---|---|
| Quadrant | BADHDUFLAG | Total packets | Discarded packets |
| A | 0 | 6 | 0 |
| B | 0 | 6 | 0 |
| C | 0 | 6 | 0 |
| D | 0 | 6 | 0 |
| Mode SS | |||
|---|---|---|---|
| Quadrant | BADHDUFLAG | Total packets | Discarded packets |
| A | 0 | 156 | 0 |
| B | 0 | 156 | 0 |
| C | 0 | 156 | 0 |
| D | 0 | 156 | 0 |
| Mode M0 | |||
|---|---|---|---|
| Quadrant | BADHDUFLAG | Total packets | Discarded packets |
| A | 0 | 16460 | 3 |
| B | 0 | 20567 | 2 |
| C | 0 | 15727 | 2 |
| D | 0 | 17791 | 2 |
| Quadrant | Total seconds | Saturated seconds | Saturation percentage |
|---|---|---|---|
| A | 7719 | 55 | 0.712528% |
| B | 7719 | 372 | 4.819277% |
| C | 7719 | 19 | 0.246146% |
| D | 7719 | 156 | 2.020987% |
Noise dominated data is calculated using 1-second bins in cleaned event files. If a bin has >2000 counts, and if more than 50% of those come from <1% of pixels, then it is considered to be noise-dominated and hence unusable.
| Quadrant | # 1 sec bins | Bins with >0 counts | Bins with >2000 counts | High rate bins dominated by noise | Noise dominated (total time) | Noise dominated (detector-on time) | Marked lightcurve |
|---|---|---|---|---|---|---|---|
| A | 8295 | 7721 | 16 | 16 | 0.19% | 0.21% | 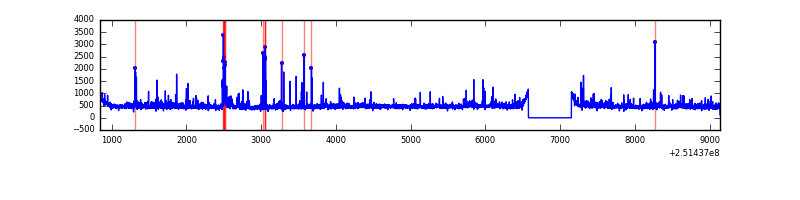 |
| B | 8294 | 7719 | 239 | 239 | 2.88% | 3.10% | 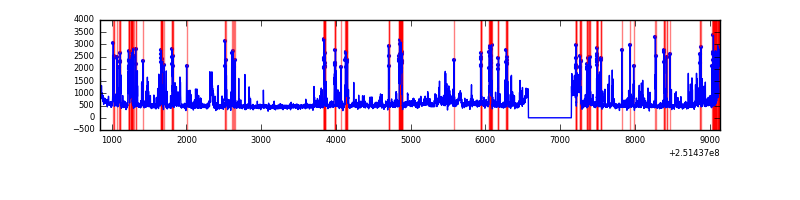 |
| C | 8295 | 7721 | 2 | 2 | 0.02% | 0.03% | 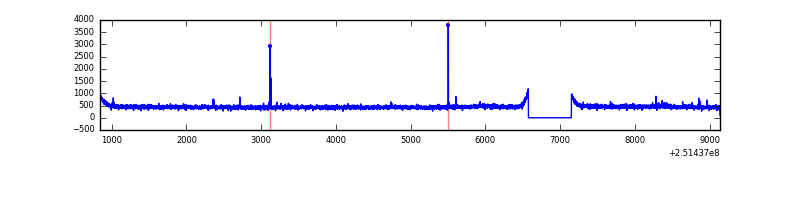 |
| D | 8295 | 7721 | 123 | 123 | 1.48% | 1.59% | 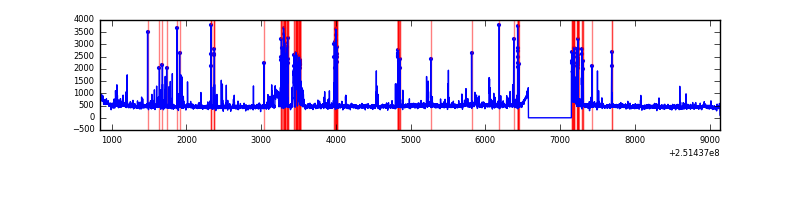 |
Top three noisy pixels from each quadrant. If the there are fewer than three noisy pixels in the level2.evt file, extra rows are filled as -1
| Pixel properties | Quadrant properties | ||||||
|---|---|---|---|---|---|---|---|
| Quadrant | DetID | PixID | Counts | Sigma | Mean | Median | Sigma |
| A | 5 | 16 | 108445 | 586.31 | 900 | 880 | 183.5 |
| A | 1 | 162 | 82956 | 447.37 | 900 | 880 | 183.5 |
| A | 13 | 251 | 45372 | 242.51 | 900 | 880 | 183.5 |
| B | 4 | 239 | 1032515 | 5992.25 | 894 | 871 | 172.2 |
| B | 0 | 85 | 393008 | 2277.71 | 894 | 871 | 172.2 |
| B | 15 | 204 | 191103 | 1104.95 | 894 | 871 | 172.2 |
| C | 14 | 234 | 15410 | 70.19 | 883 | 888 | 206.9 |
| C | 7 | 247 | 8851 | 38.49 | 883 | 888 | 206.9 |
| C | 13 | 61 | 6448 | 26.87 | 883 | 888 | 206.9 |
| D | 1 | 52 | 623533 | 2978.69 | 870 | 844 | 209.0 |
| D | 8 | 195 | 329636 | 1572.81 | 870 | 844 | 209.0 |
| D | 13 | 104 | 53728 | 252.98 | 870 | 844 | 209.0 |
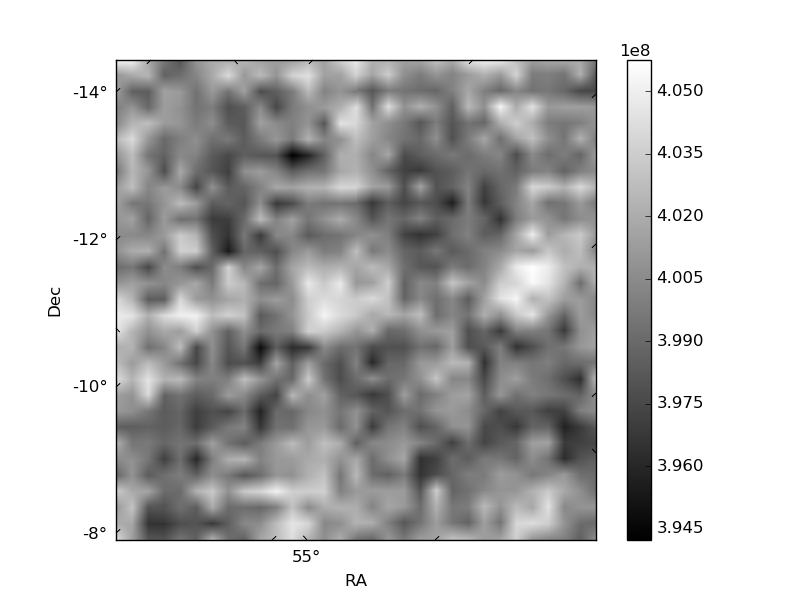
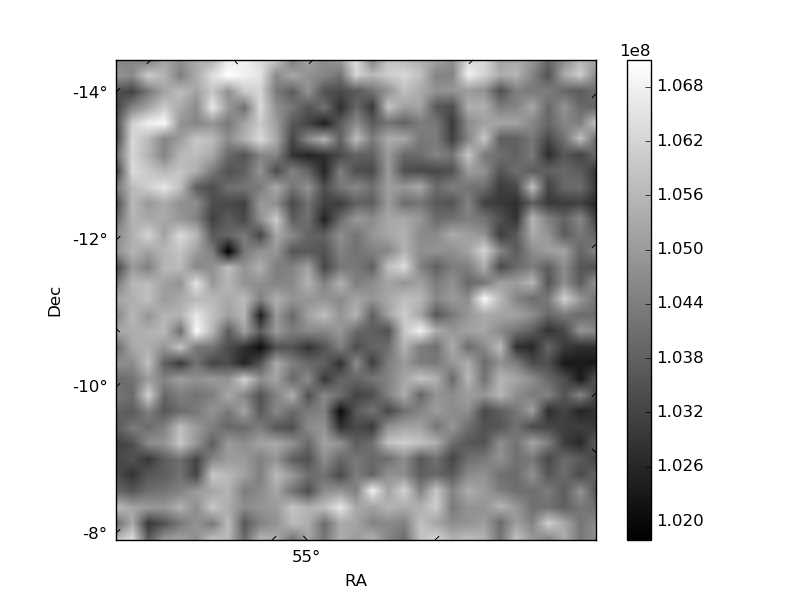
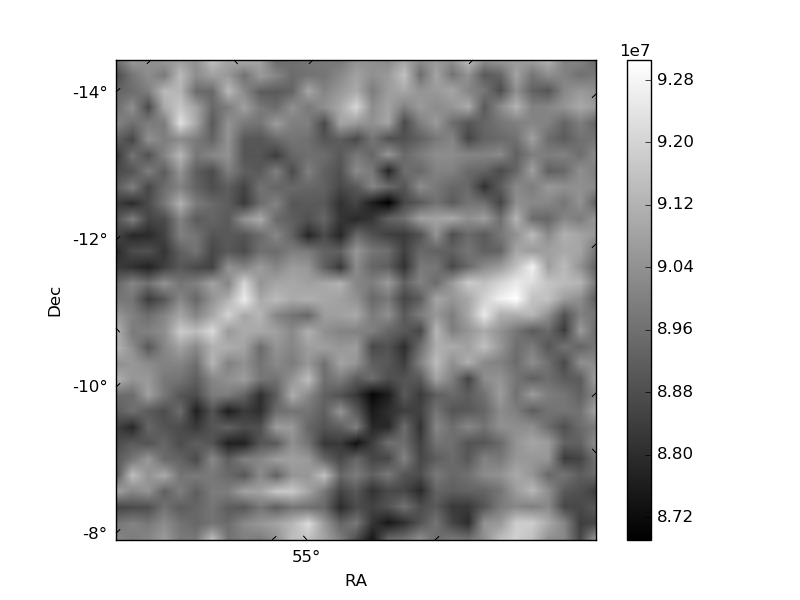
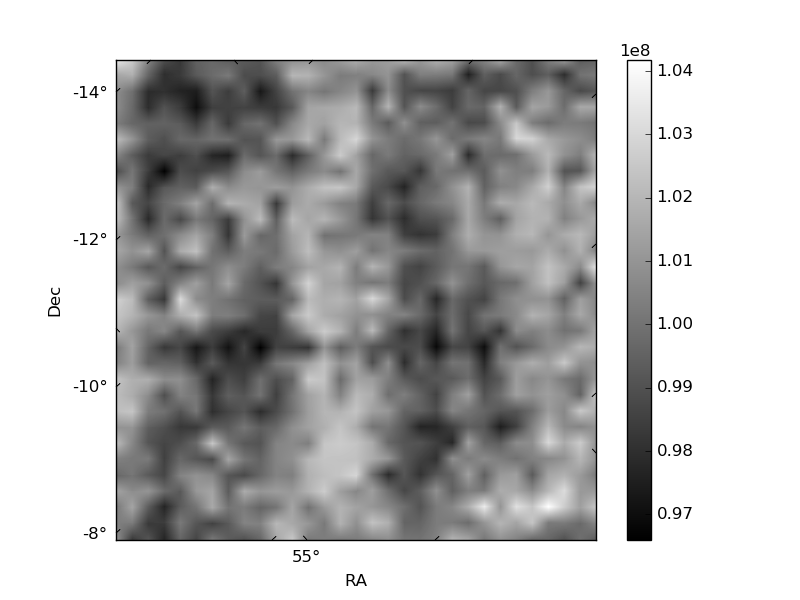
Histogram calculated using DETX and DETY for each event in the final _common_clean file
| Quadrant A | 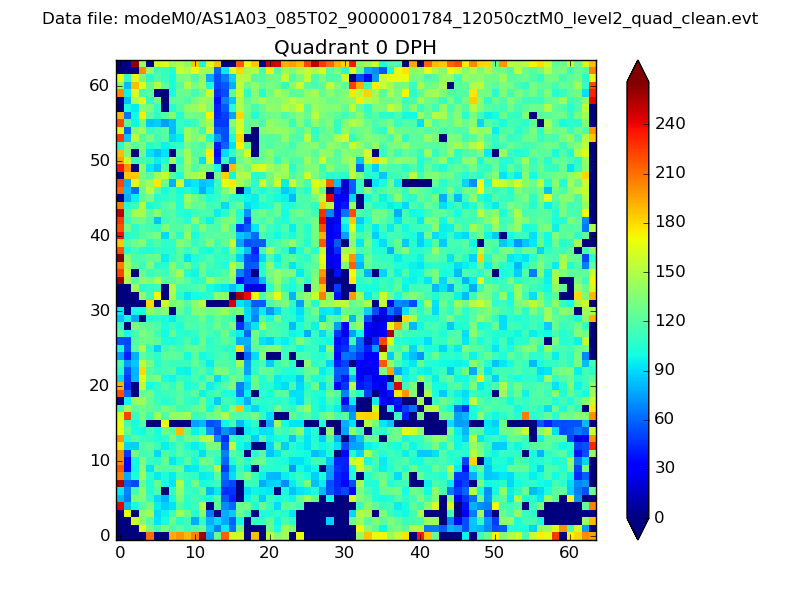 |
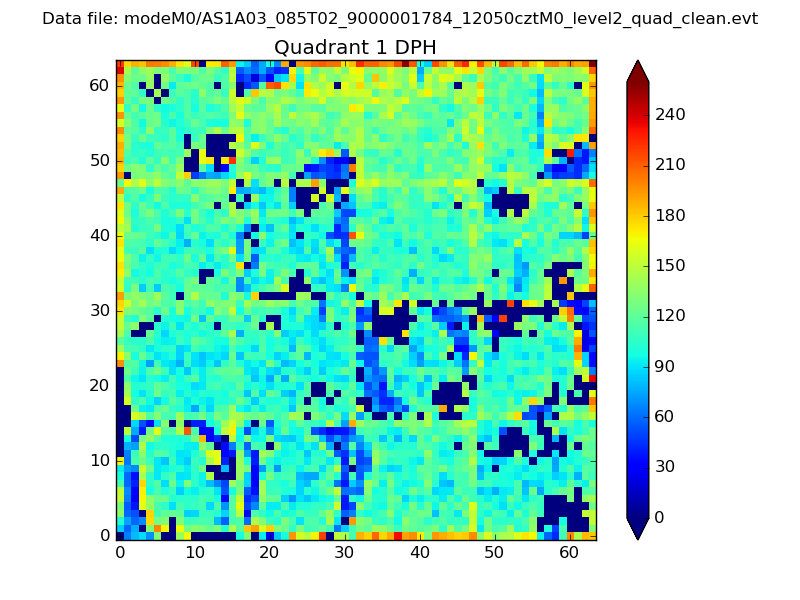 |
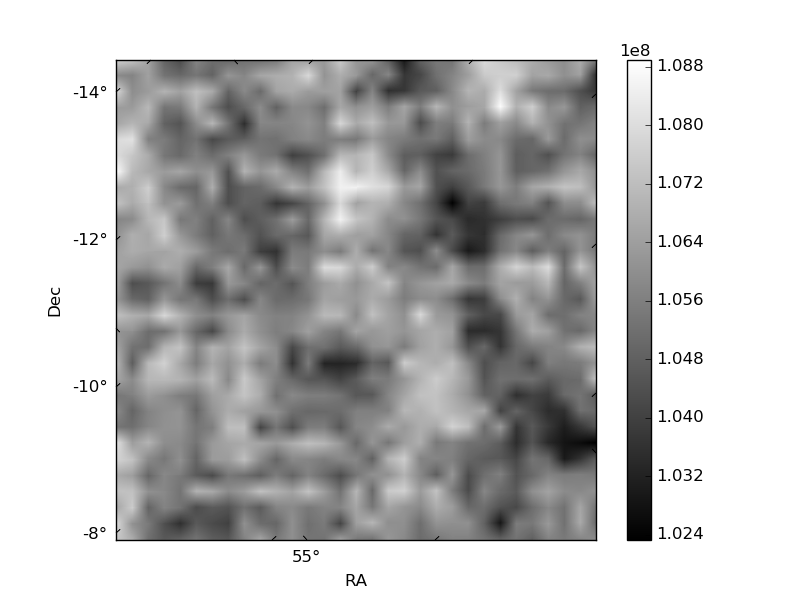
Quadrant B |
|---|---|---|---|
| Quadrant D | 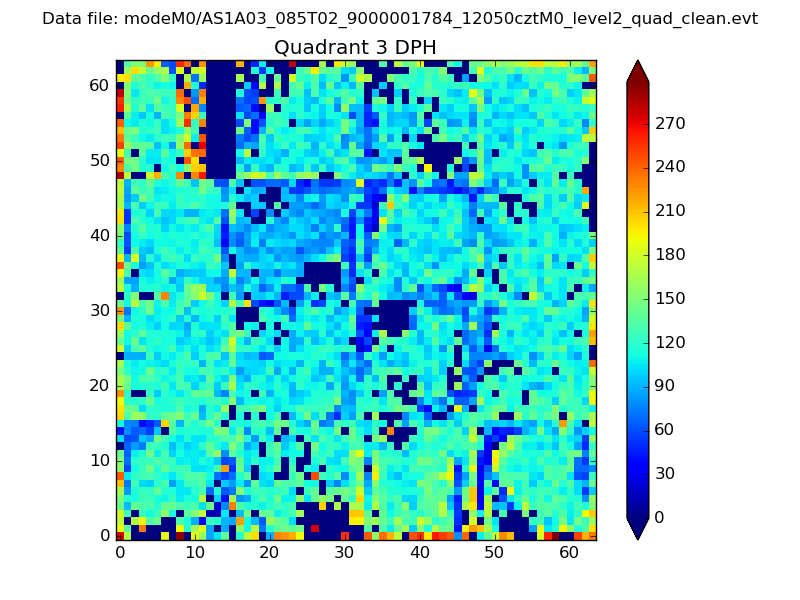 |
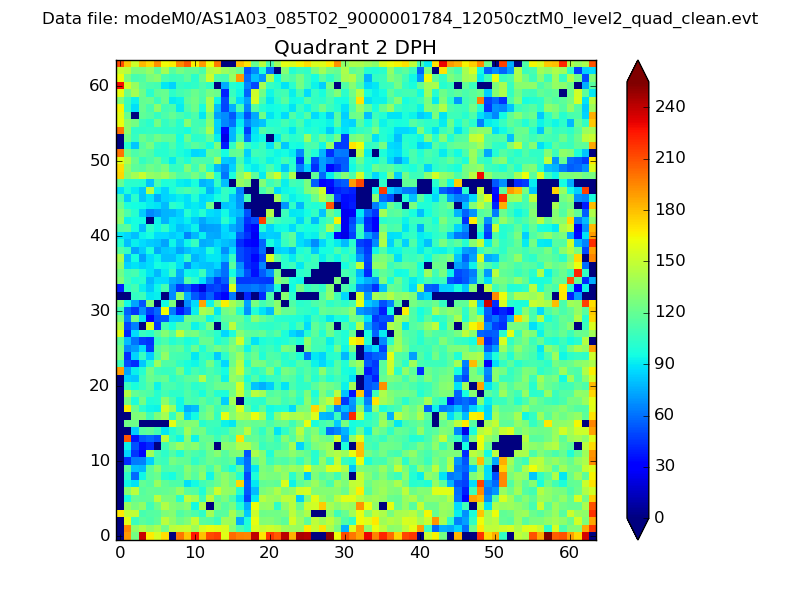 |
Quadrant C |
| Plot type | Count rate plots | Images |
|---|---|---|
| Comparison with Poisson distribution Blue bars denote a histogram of data divided into 1 sec bins. Red curve is a Poisson curve with rate = median count rate of data. |
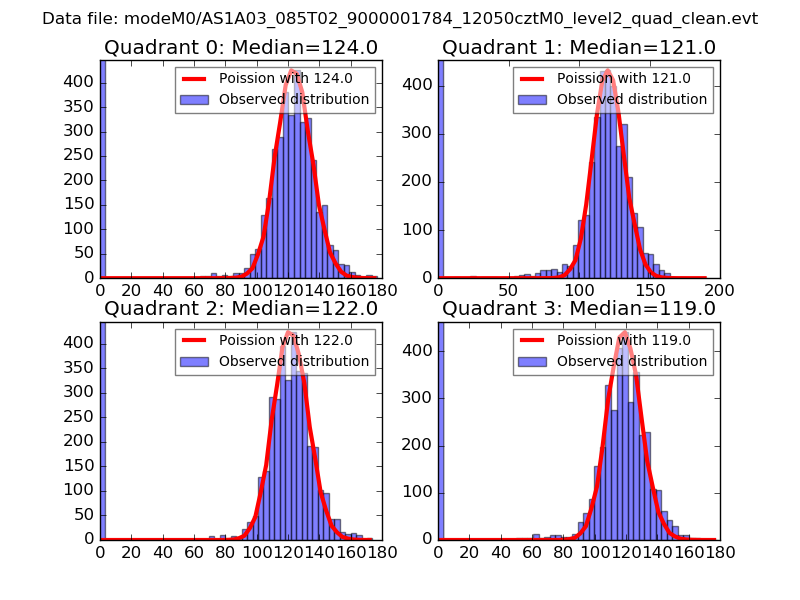 |
 |
| Quadrant-wise count rates Data is divided into 100 sec bins |
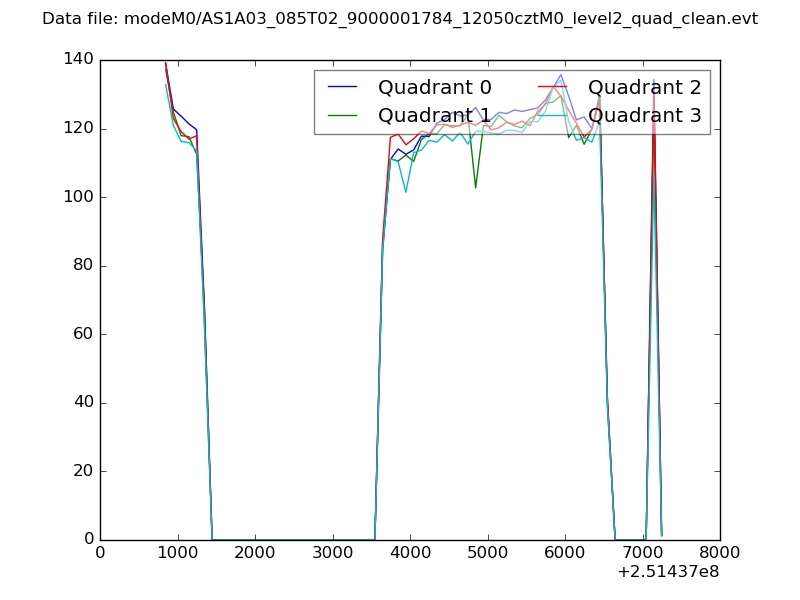 |
|
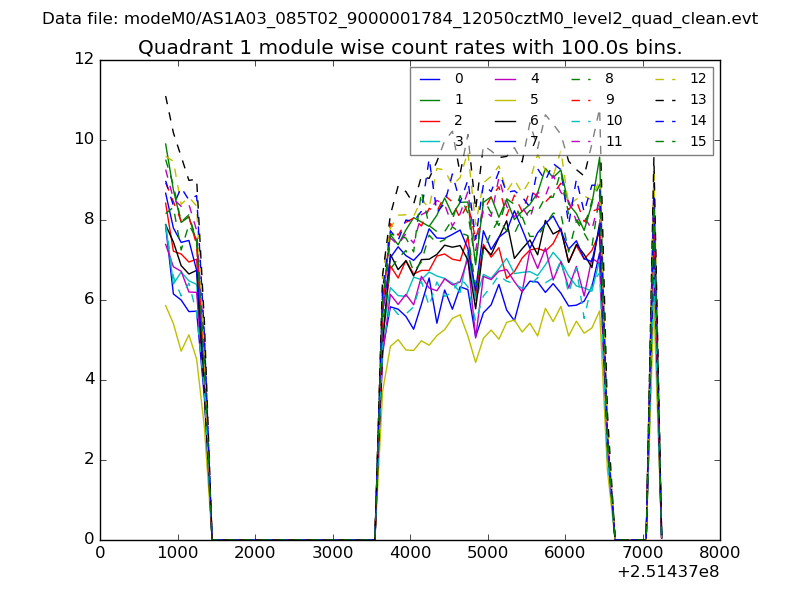
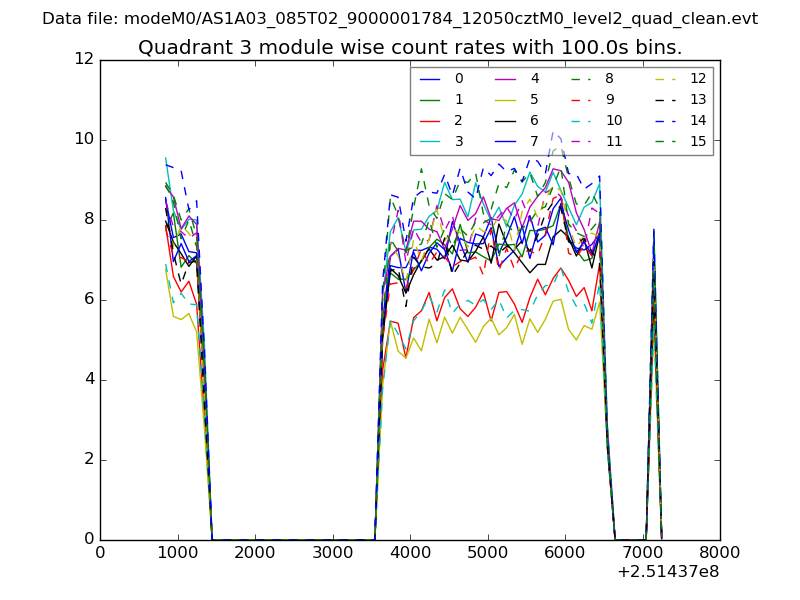
| Module-wise count rates for Quadrant A Data is divided into 100 sec bins |
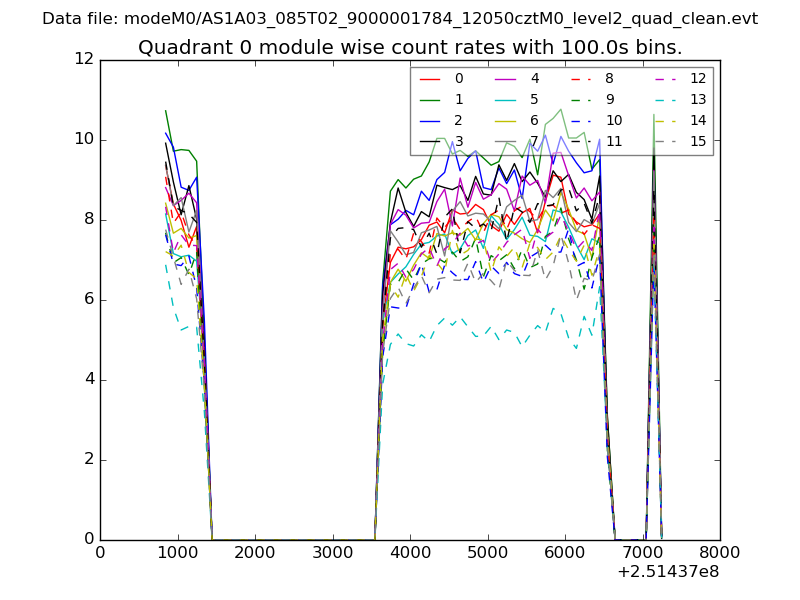 |
 |
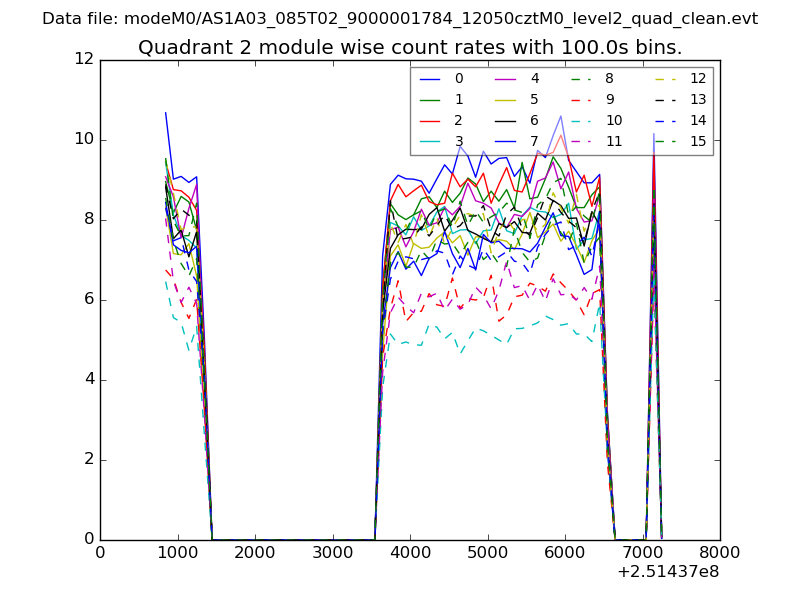
| Module-wise count rates for Quadrant B Data is divided into 100 sec bins |
 |
 |
| Module-wise count rates for Quadrant C Data is divided into 100 sec bins |
 |
 |
| Module-wise count rates for Quadrant D Data is divided into 100 sec bins |
 |
 |
| Parameter | Plot |
|---|---|
| CZT HV Monitor | 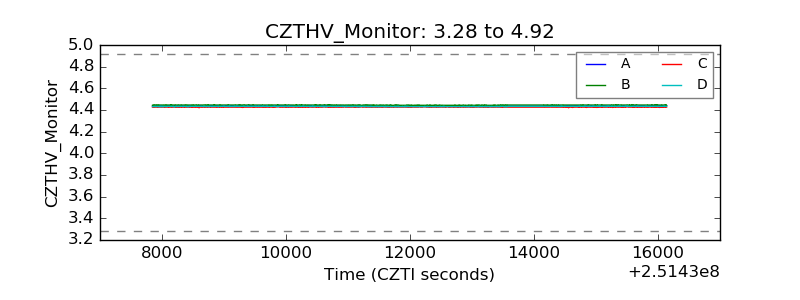 |
| D_VDD |  |
| Temperature 1 | 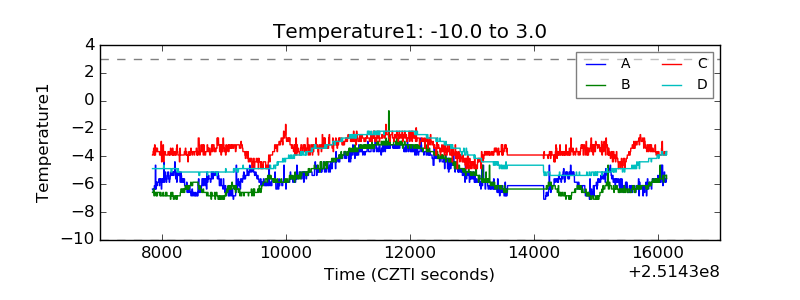 |
| Veto HV Monitor | 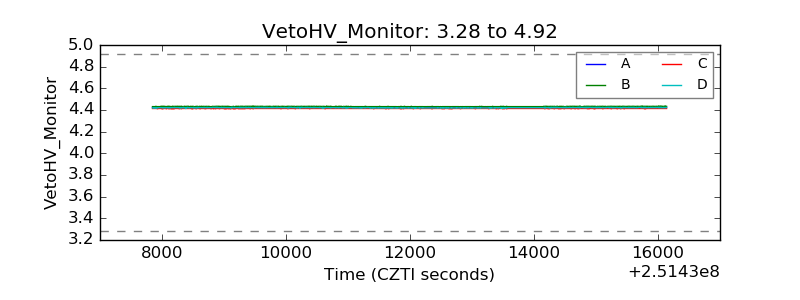 |
| Veto LLD | 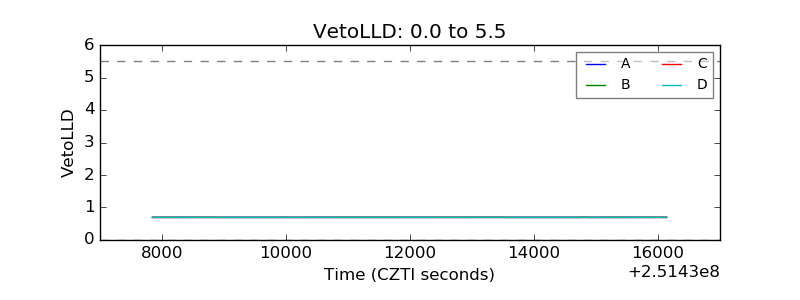 |
| Alpha Counter | 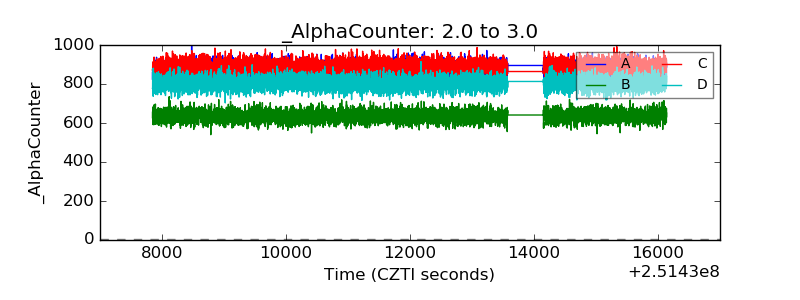 |
| _CPM_Rate | 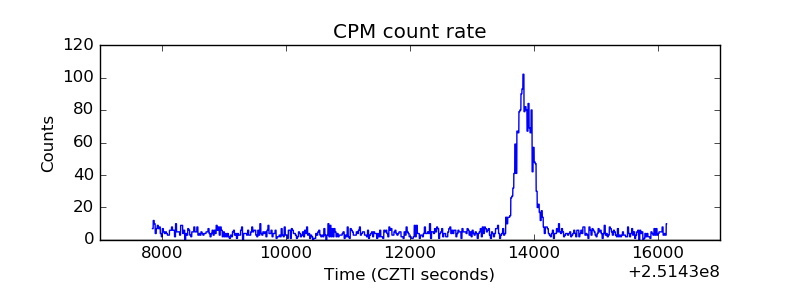 |
| CZT Counter |  |
| +2.5 Volts monitor |  |
| +5 Volts monitor |  |
| _ROLL_ROT | 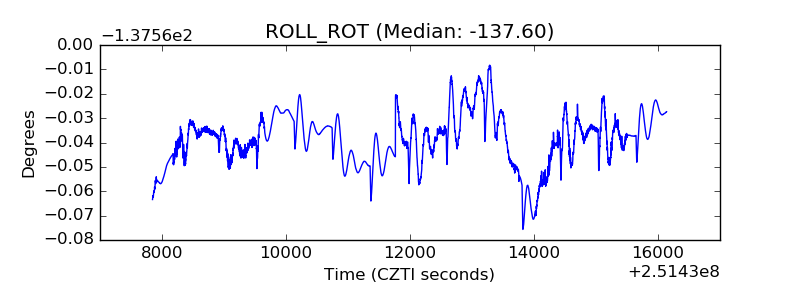 |
| _Roll_DEC | 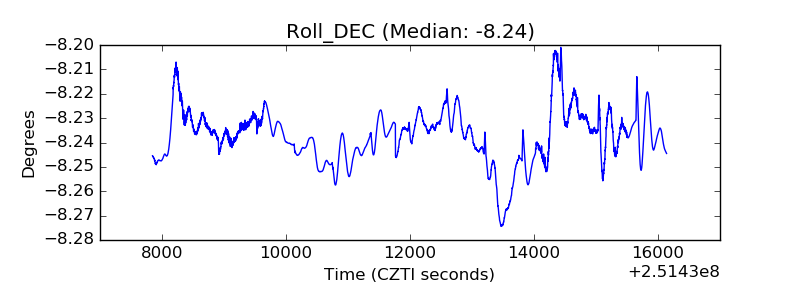 |
| _Roll_RA | 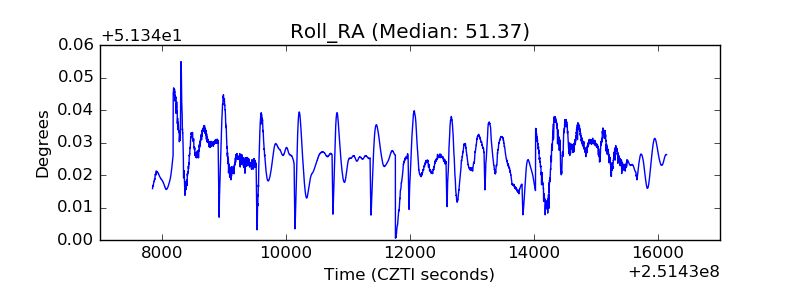 |
| Veto Counter | 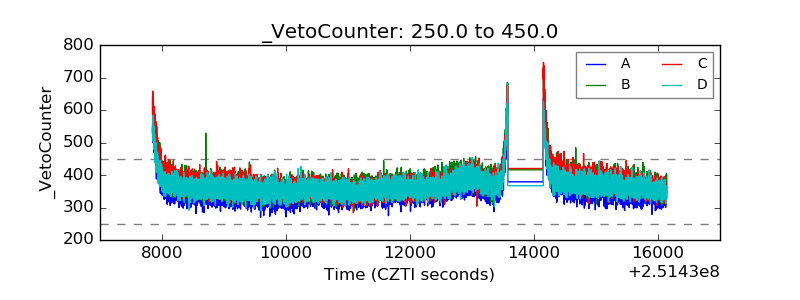 |