| Param | Original file | Final file |
|---|---|---|
| Filename | modeM0/AS1A03_085T02_9000001784_12051cztM0_level2.evt | modeM0/AS1A03_085T02_9000001784_12051cztM0_level2_quad_clean.evt |
| Size (bytes) | 937,817,280 | 132,531,840 |
| Size | 894.4 MB | 126.4 MB |
| Events in quadrant A | 5,803,002 | 820,304 |
| Events in quadrant B | 9,572,603 | 771,718 |
| Events in quadrant C | 5,584,328 | 810,647 |
| Events in quadrant D | 6,634,016 | 784,546 |
| Mode M9 | |||
|---|---|---|---|
| Quadrant | BADHDUFLAG | Total packets | Discarded packets |
| A | 0 | 16 | 0 |
| B | 0 | 16 | 0 |
| C | 0 | 16 | 0 |
| D | 0 | 16 | 0 |
| Mode SS | |||
|---|---|---|---|
| Quadrant | BADHDUFLAG | Total packets | Discarded packets |
| A | 0 | 240 | 0 |
| B | 0 | 240 | 0 |
| C | 0 | 240 | 0 |
| D | 0 | 240 | 0 |
| Mode M0 | |||
|---|---|---|---|
| Quadrant | BADHDUFLAG | Total packets | Discarded packets |
| A | 0 | 25045 | 3 |
| B | 0 | 36049 | 2 |
| C | 0 | 24885 | 2 |
| D | 0 | 26817 | 2 |
| Quadrant | Total seconds | Saturated seconds | Saturation percentage |
|---|---|---|---|
| A | 11953 | 168 | 1.405505% |
| B | 11953 | 1345 | 11.252405% |
| C | 11953 | 111 | 0.928637% |
| D | 11953 | 239 | 1.999498% |
Noise dominated data is calculated using 1-second bins in cleaned event files. If a bin has >2000 counts, and if more than 50% of those come from <1% of pixels, then it is considered to be noise-dominated and hence unusable.
| Quadrant | # 1 sec bins | Bins with >0 counts | Bins with >2000 counts | High rate bins dominated by noise | Noise dominated (total time) | Noise dominated (detector-on time) | Marked lightcurve |
|---|---|---|---|---|---|---|---|
| A | 13499 | 11954 | 8 | 8 | 0.06% | 0.07% | 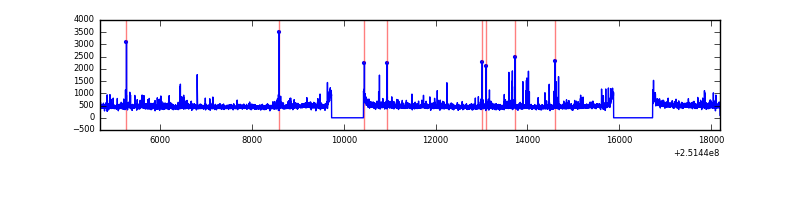 |
| B | 13499 | 11954 | 901 | 901 | 6.67% | 7.54% | 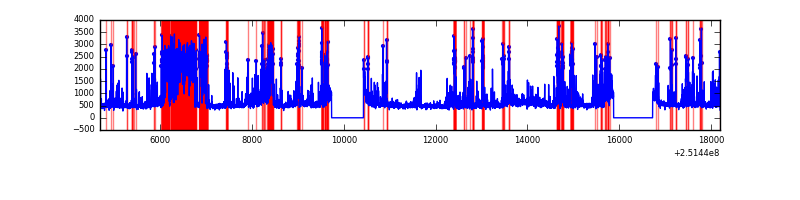 |
| C | 13499 | 11954 | 3 | 3 | 0.02% | 0.03% | 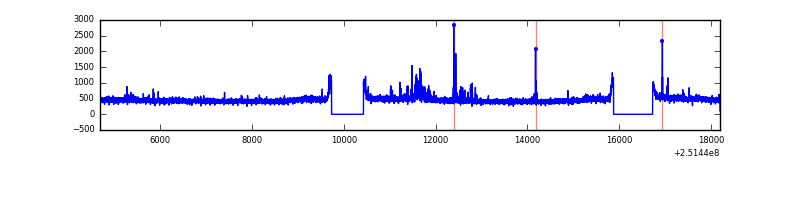 |
| D | 13499 | 11954 | 120 | 120 | 0.89% | 1.00% | 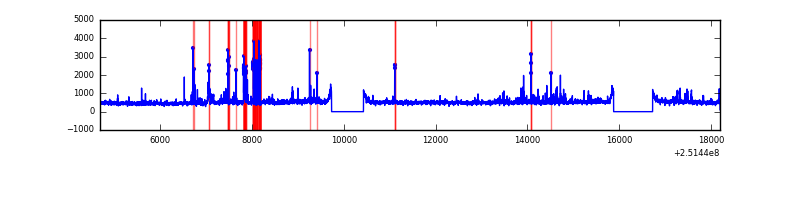 |
Top three noisy pixels from each quadrant. If the there are fewer than three noisy pixels in the level2.evt file, extra rows are filled as -1
| Pixel properties | Quadrant properties | ||||||
|---|---|---|---|---|---|---|---|
| Quadrant | DetID | PixID | Counts | Sigma | Mean | Median | Sigma |
| A | 1 | 162 | 108160 | 366.08 | 1425 | 1395 | 291.6 |
| A | 1 | 178 | 47179 | 156.98 | 1425 | 1395 | 291.6 |
| A | 1 | 161 | 42589 | 141.25 | 1425 | 1395 | 291.6 |
| B | 4 | 239 | 1945619 | 7375.11 | 1375 | 1340 | 263.6 |
| B | 0 | 85 | 1780647 | 6749.33 | 1375 | 1340 | 263.6 |
| B | 15 | 204 | 220048 | 829.61 | 1375 | 1340 | 263.6 |
| C | 7 | 247 | 148277 | 454.17 | 1386 | 1391 | 323.4 |
| C | 14 | 234 | 36904 | 109.81 | 1386 | 1391 | 323.4 |
| C | 13 | 61 | 10021 | 26.68 | 1386 | 1391 | 323.4 |
| D | 8 | 195 | 693534 | 2101.13 | 1372 | 1330 | 329.4 |
| D | 1 | 52 | 489411 | 1481.53 | 1372 | 1330 | 329.4 |
| D | 13 | 104 | 139727 | 420.09 | 1372 | 1330 | 329.4 |
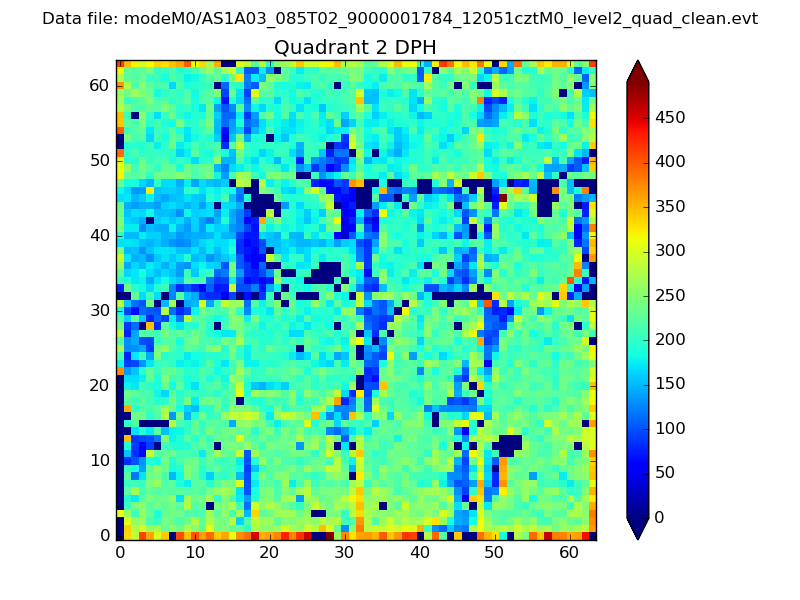
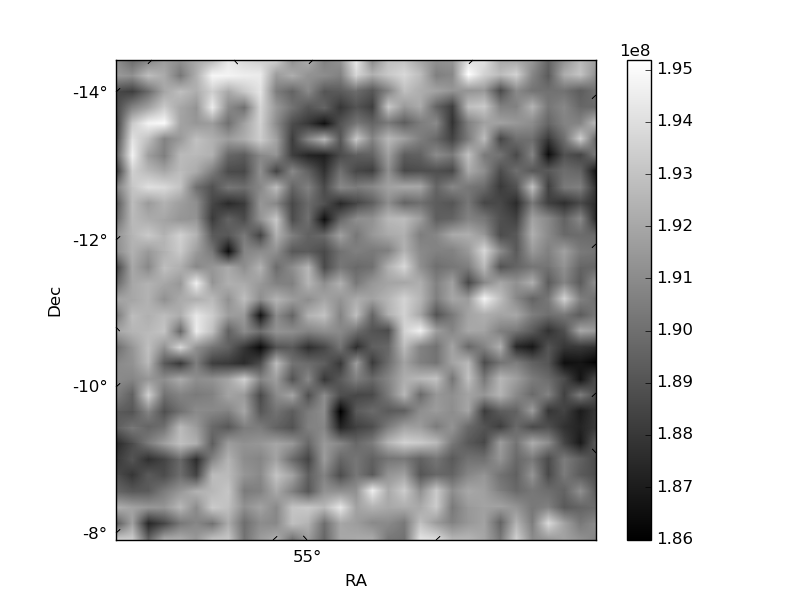
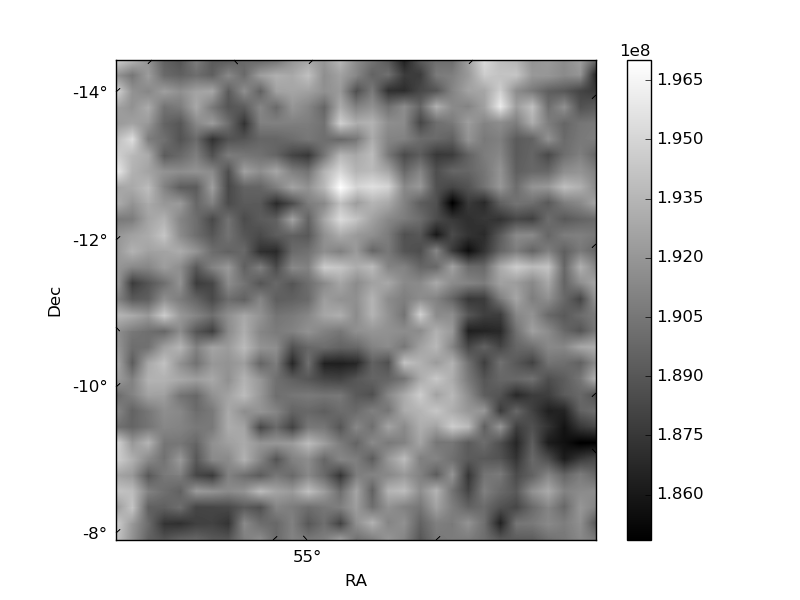
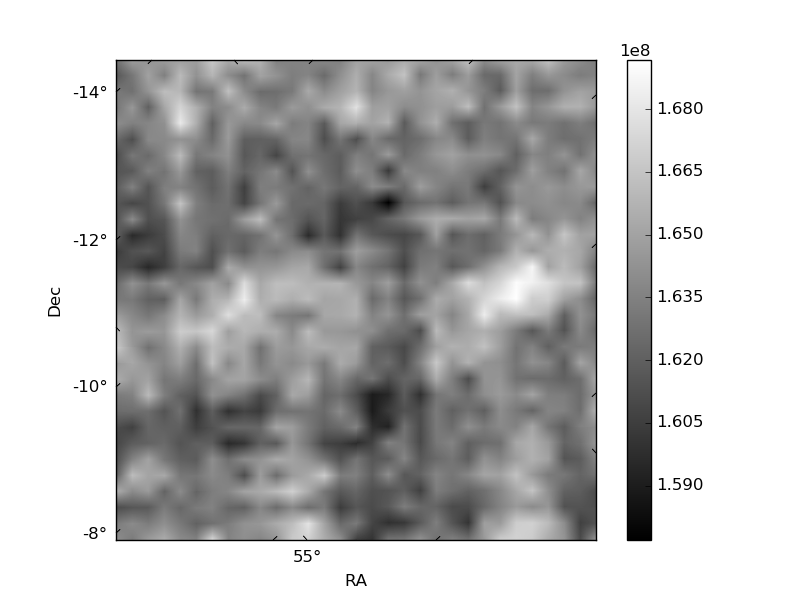
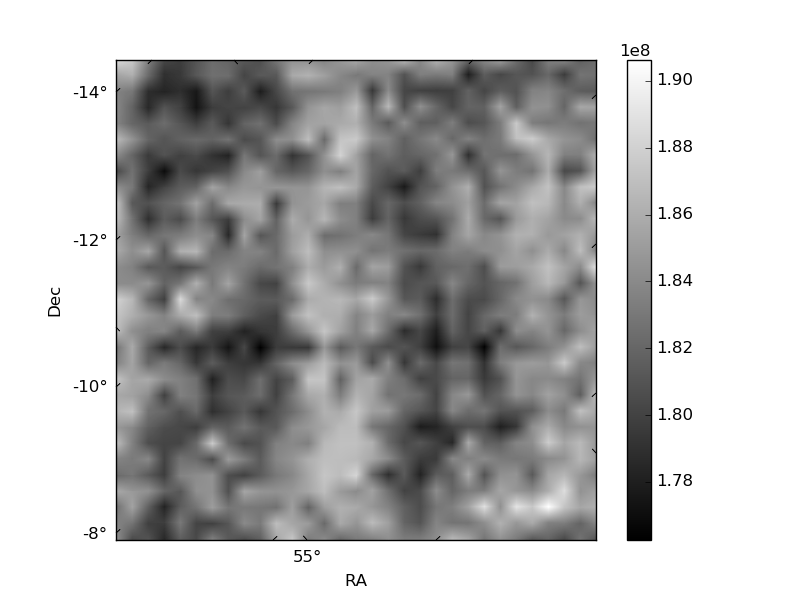
Histogram calculated using DETX and DETY for each event in the final _common_clean file
| Quadrant A | 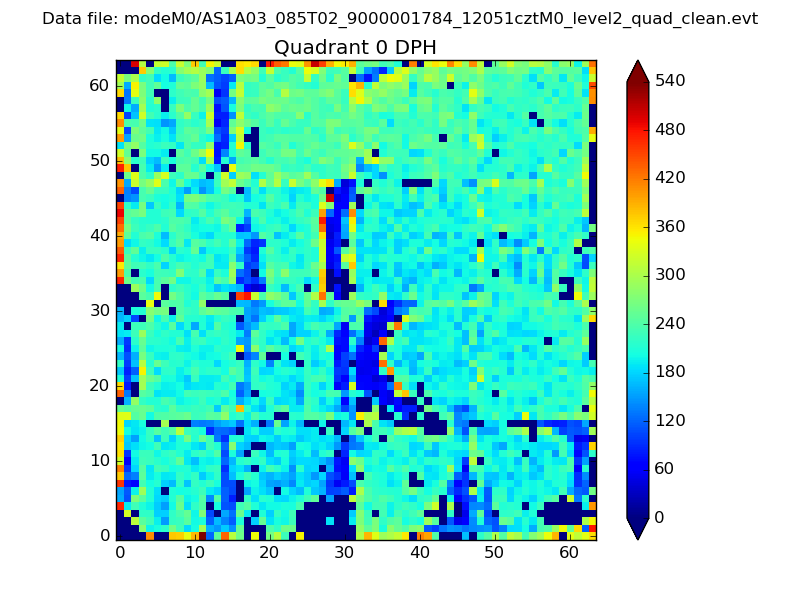 |
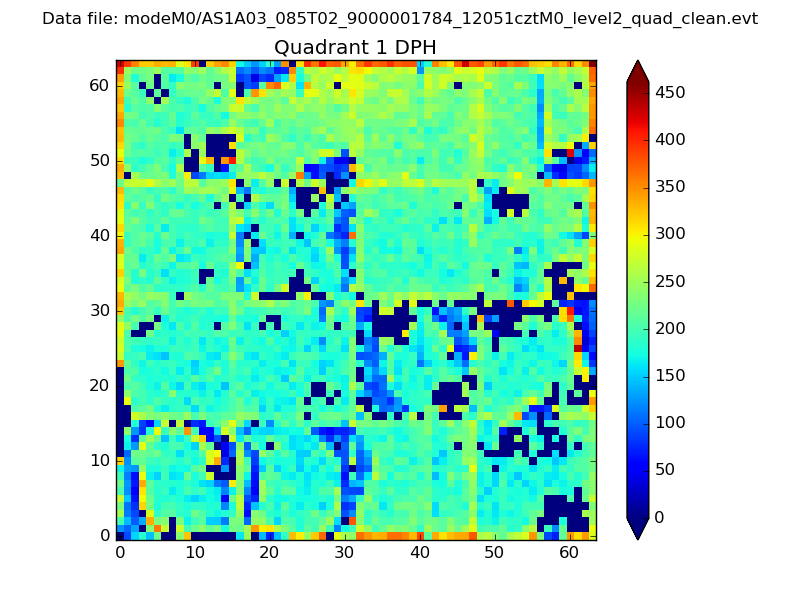 |
Quadrant B |
|---|---|---|---|
| Quadrant D | 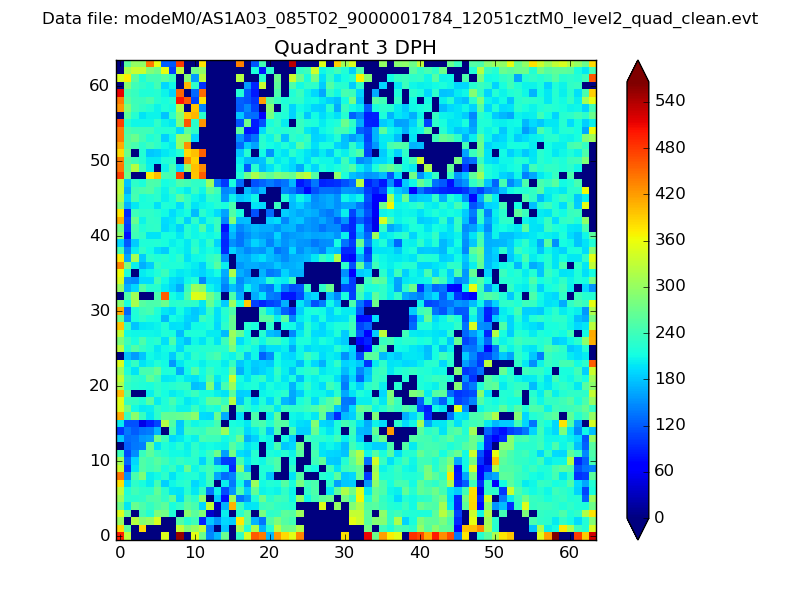 |
 |
Quadrant C |
| Plot type | Count rate plots | Images |
|---|---|---|
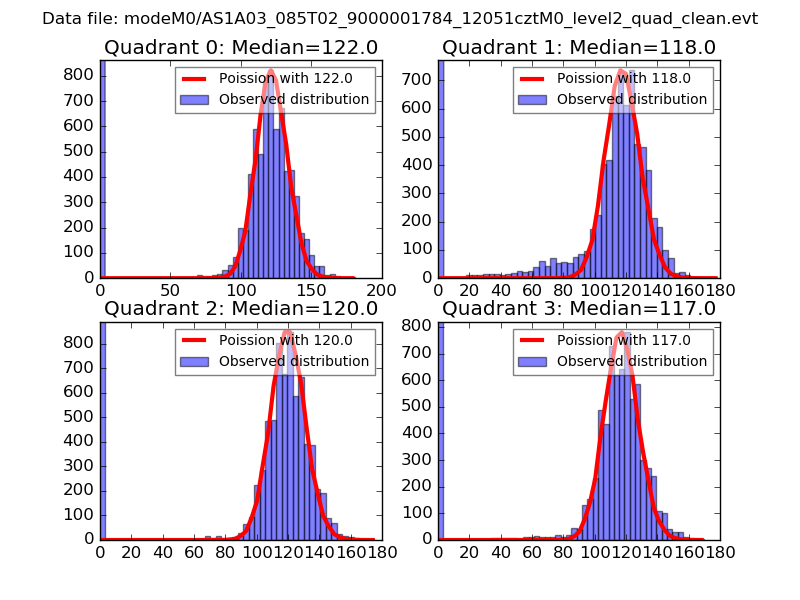
| Comparison with Poisson distribution Blue bars denote a histogram of data divided into 1 sec bins. Red curve is a Poisson curve with rate = median count rate of data. |
 |
 |
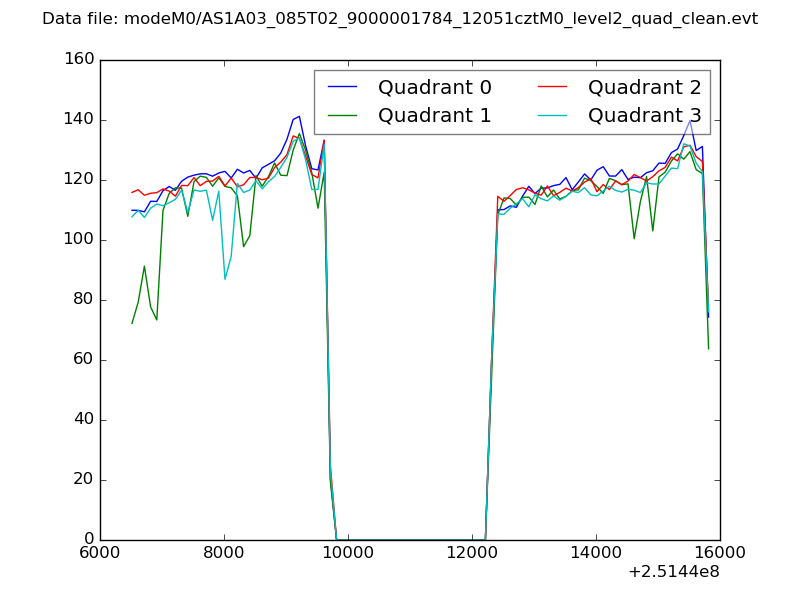
| Quadrant-wise count rates Data is divided into 100 sec bins |
 |
|
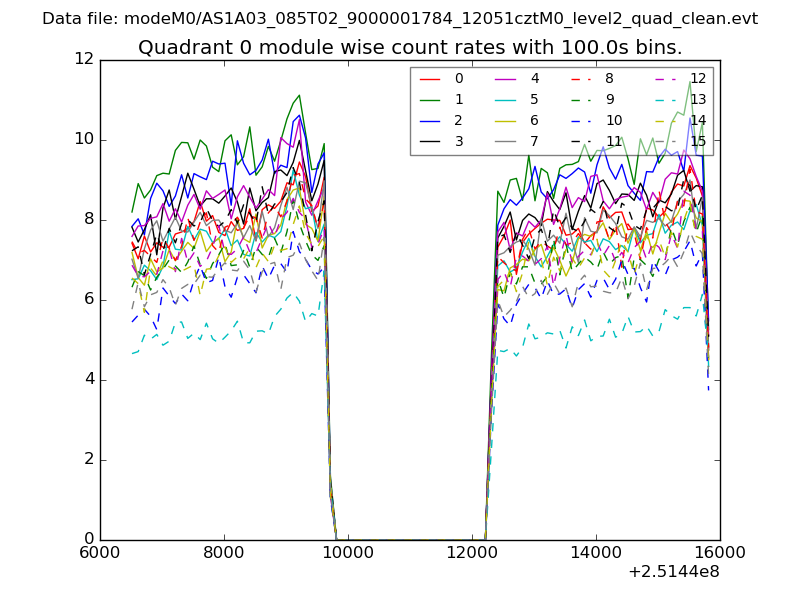
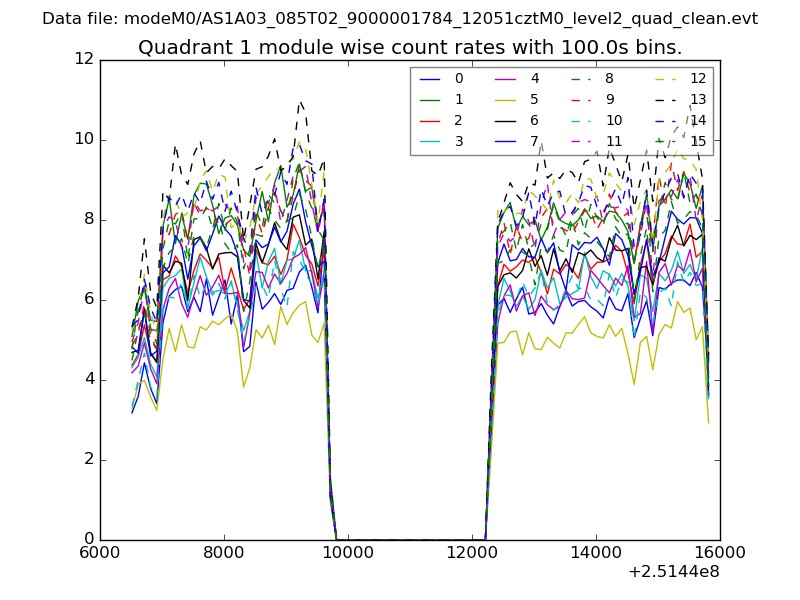
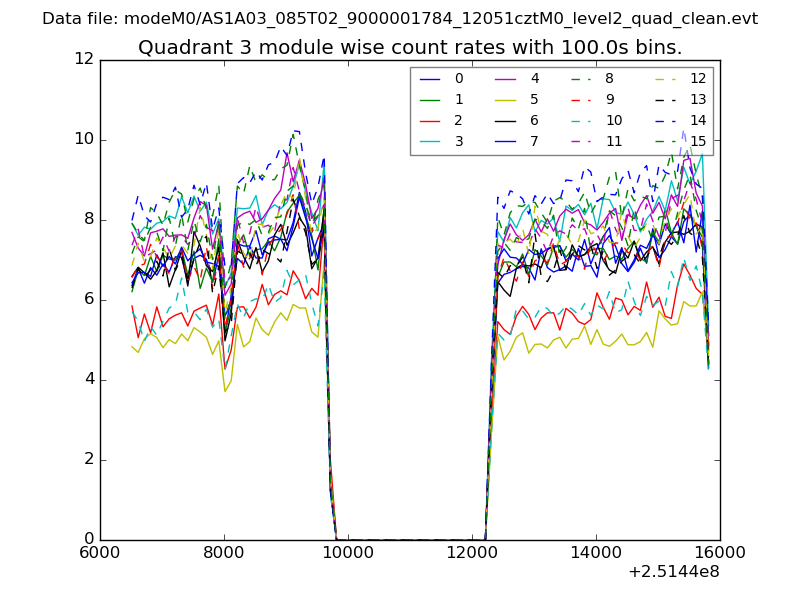
| Module-wise count rates for Quadrant A Data is divided into 100 sec bins |
 |
 |
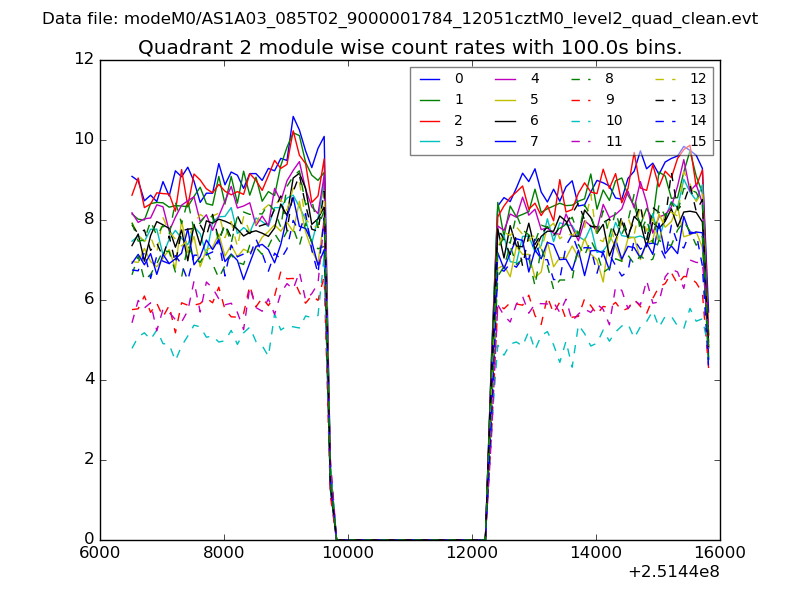
| Module-wise count rates for Quadrant B Data is divided into 100 sec bins |
 |
 |
| Module-wise count rates for Quadrant C Data is divided into 100 sec bins |
 |
 |
| Module-wise count rates for Quadrant D Data is divided into 100 sec bins |
 |
 |
| Parameter | Plot |
|---|---|
| CZT HV Monitor | 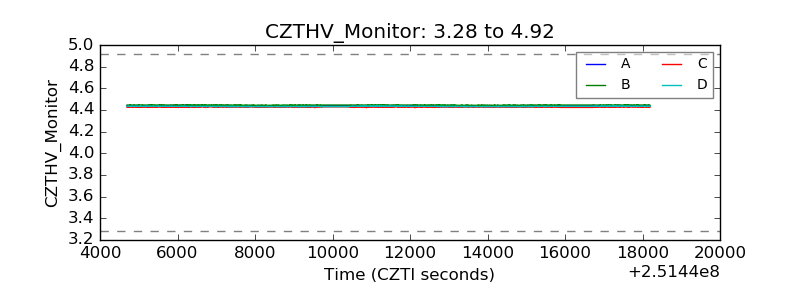 |
| D_VDD | 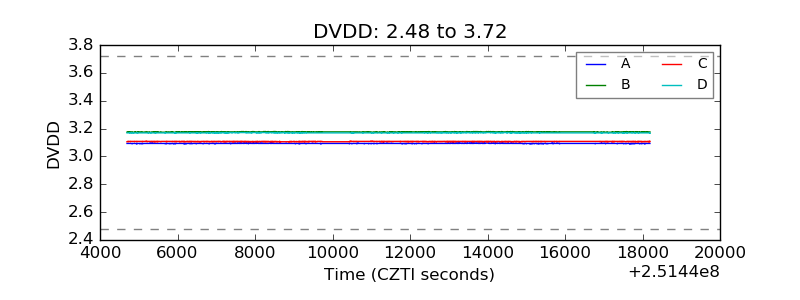 |
| Temperature 1 | 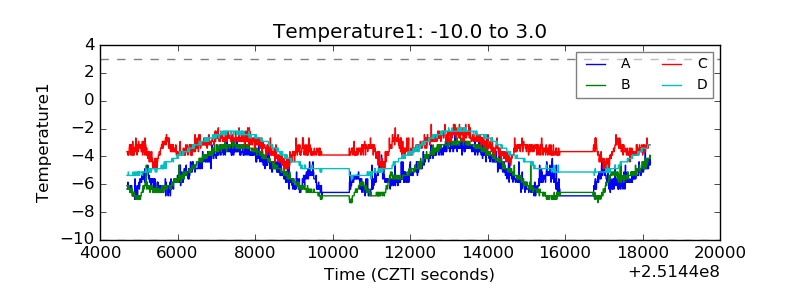 |
| Veto HV Monitor | 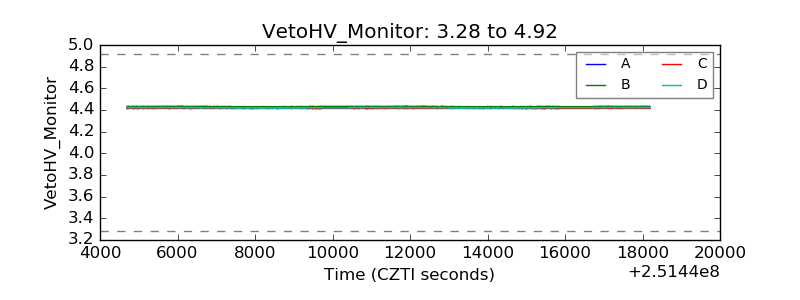 |
| Veto LLD | 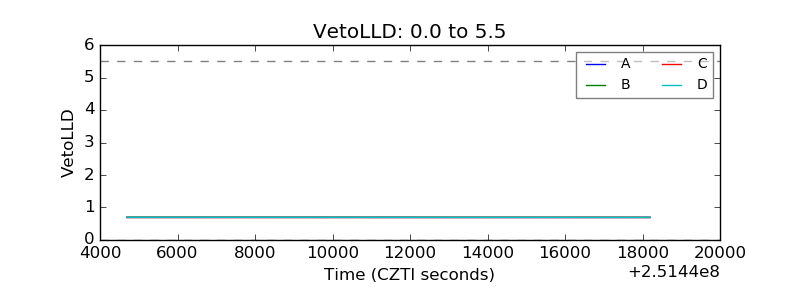 |
| Alpha Counter | 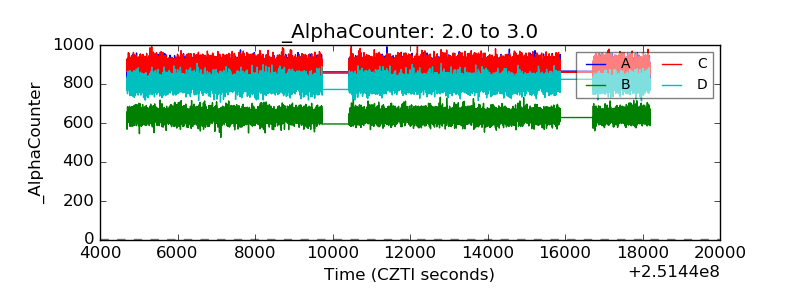 |
| _CPM_Rate | 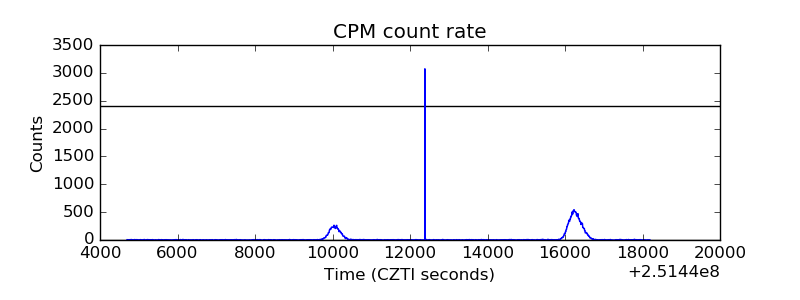 |
| CZT Counter | 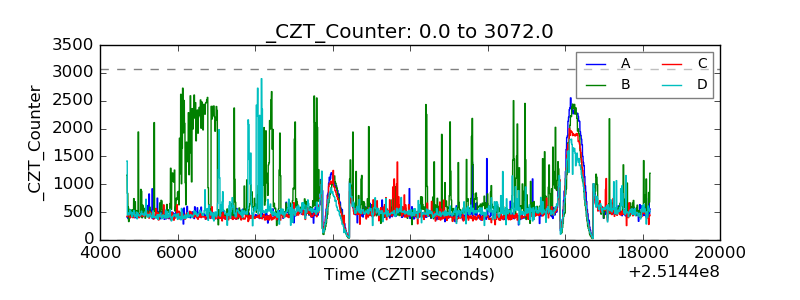 |
| +2.5 Volts monitor |  |
| +5 Volts monitor |  |
| _ROLL_ROT | 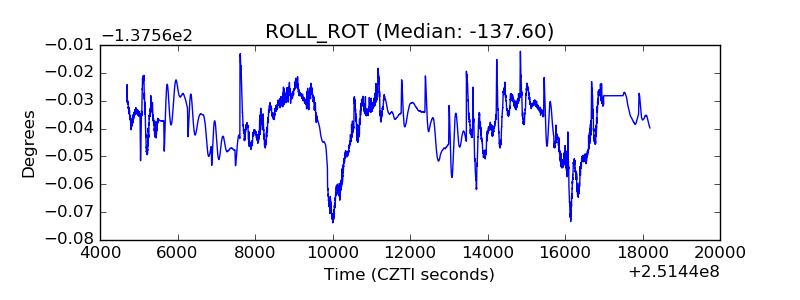 |
| _Roll_DEC | 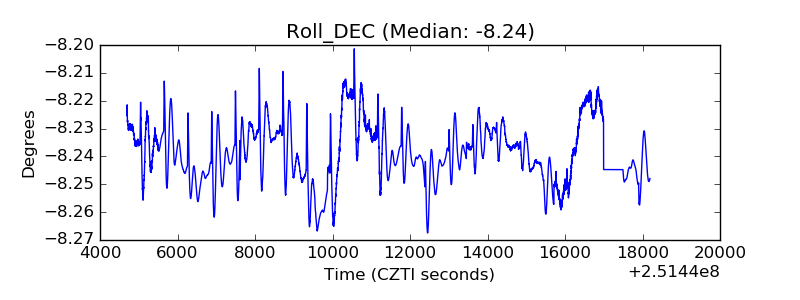 |
| _Roll_RA | 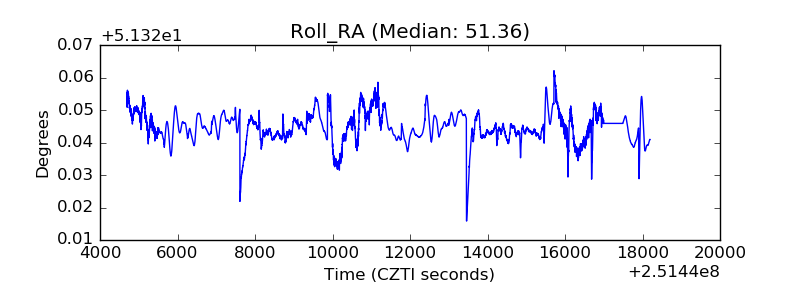 |
| Veto Counter | 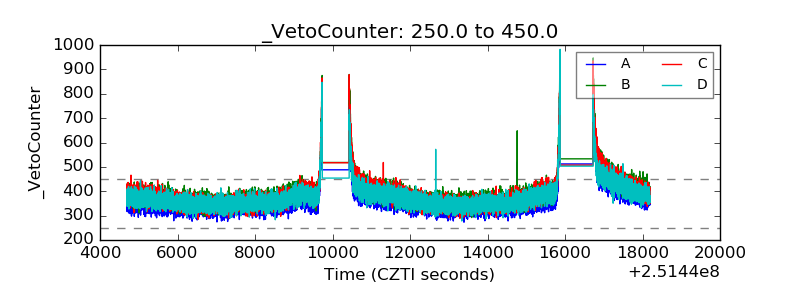 |