| Param | Original file | Final file |
|---|---|---|
| Filename | modeM0/AS1A03_085T02_9000001784_12054cztM0_level2.evt | modeM0/AS1A03_085T02_9000001784_12054cztM0_level2_quad_clean.evt |
| Size (bytes) | 503,870,400 | 85,847,040 |
| Size | 480.5 MB | 81.9 MB |
| Events in quadrant A | 3,185,268 | 558,848 |
| Events in quadrant B | 5,252,980 | 530,769 |
| Events in quadrant C | 2,948,515 | 547,409 |
| Events in quadrant D | 3,451,246 | 528,667 |
| Mode M9 | |||
|---|---|---|---|
| Quadrant | BADHDUFLAG | Total packets | Discarded packets |
| A | 0 | 12 | 0 |
| B | 0 | 12 | 0 |
| C | 0 | 12 | 0 |
| D | 0 | 12 | 0 |
| Mode SS | |||
|---|---|---|---|
| Quadrant | BADHDUFLAG | Total packets | Discarded packets |
| A | 0 | 126 | 0 |
| B | 0 | 126 | 0 |
| C | 0 | 126 | 0 |
| D | 0 | 126 | 0 |
| Mode M0 | |||
|---|---|---|---|
| Quadrant | BADHDUFLAG | Total packets | Discarded packets |
| A | 0 | 13394 | 2 |
| B | 0 | 20055 | 1 |
| C | 0 | 12926 | 1 |
| D | 0 | 14118 | 1 |
| Quadrant | Total seconds | Saturated seconds | Saturation percentage |
|---|---|---|---|
| A | 6217 | 61 | 0.981181% |
| B | 6217 | 619 | 9.956571% |
| C | 6217 | 37 | 0.595142% |
| D | 6217 | 82 | 1.318964% |
Noise dominated data is calculated using 1-second bins in cleaned event files. If a bin has >2000 counts, and if more than 50% of those come from <1% of pixels, then it is considered to be noise-dominated and hence unusable.
| Quadrant | # 1 sec bins | Bins with >0 counts | Bins with >2000 counts | High rate bins dominated by noise | Noise dominated (total time) | Noise dominated (detector-on time) | Marked lightcurve |
|---|---|---|---|---|---|---|---|
| A | 7358 | 6218 | 0 | 0 | 0.00% | 0.00% | 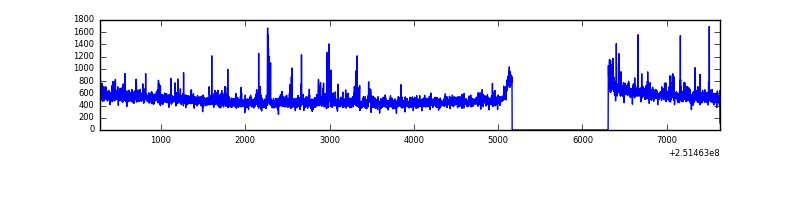 |
| B | 7358 | 6218 | 396 | 396 | 5.38% | 6.37% |  |
| C | 7358 | 6218 | 1 | 1 | 0.01% | 0.02% | 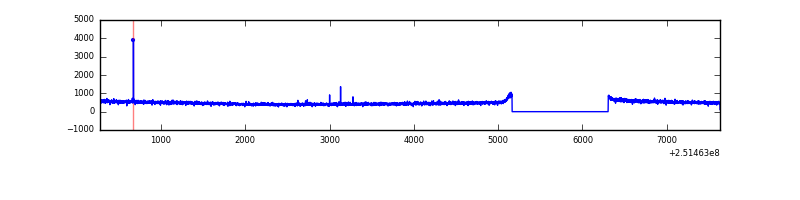 |
| D | 7358 | 6218 | 41 | 41 | 0.56% | 0.66% | 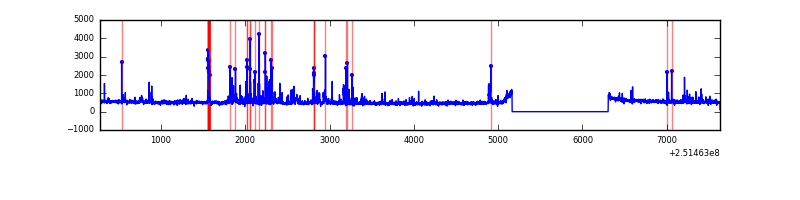 |
Top three noisy pixels from each quadrant. If the there are fewer than three noisy pixels in the level2.evt file, extra rows are filled as -1
| Pixel properties | Quadrant properties | ||||||
|---|---|---|---|---|---|---|---|
| Quadrant | DetID | PixID | Counts | Sigma | Mean | Median | Sigma |
| A | 1 | 162 | 36332 | 222.64 | 789 | 774 | 159.7 |
| A | 5 | 16 | 35792 | 219.26 | 789 | 774 | 159.7 |
| A | 1 | 178 | 18189 | 109.04 | 789 | 774 | 159.7 |
| B | 4 | 239 | 1340141 | 9275.88 | 760 | 744 | 144.4 |
| B | 0 | 85 | 402091 | 2779.49 | 760 | 744 | 144.4 |
| B | 15 | 204 | 213857 | 1475.9 | 760 | 744 | 144.4 |
| C | 14 | 234 | 7645 | 39.52 | 754 | 758 | 174.3 |
| C | 13 | 61 | 5517 | 27.31 | 754 | 758 | 174.3 |
| C | 7 | 247 | 2909 | 12.34 | 754 | 758 | 174.3 |
| D | 1 | 52 | 271570 | 1509.6 | 752 | 731 | 179.4 |
| D | 8 | 195 | 187427 | 1040.6 | 752 | 731 | 179.4 |
| D | 9 | 85 | 53607 | 294.72 | 752 | 731 | 179.4 |
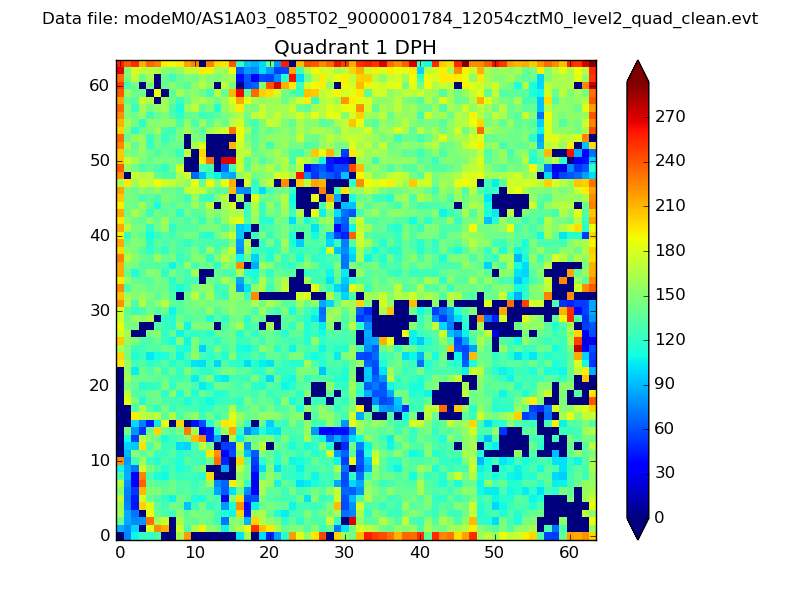
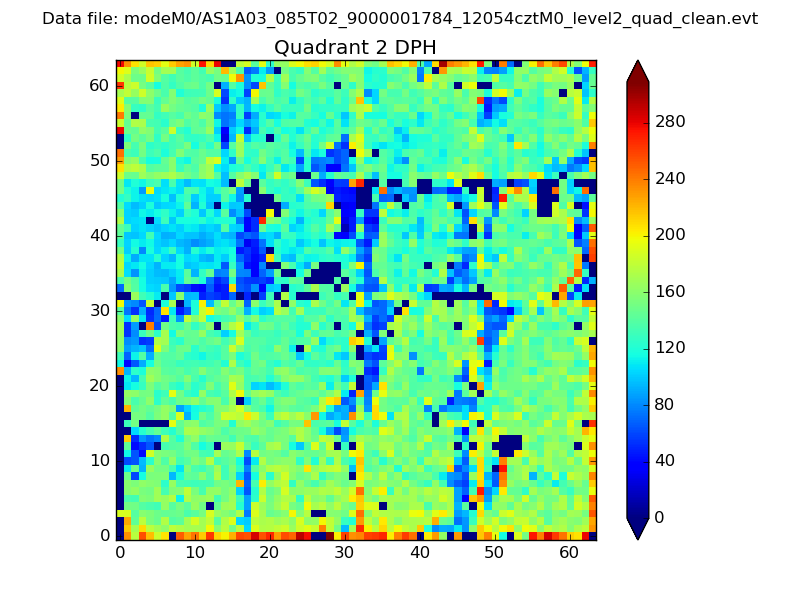
Histogram calculated using DETX and DETY for each event in the final _common_clean file
| Quadrant A | 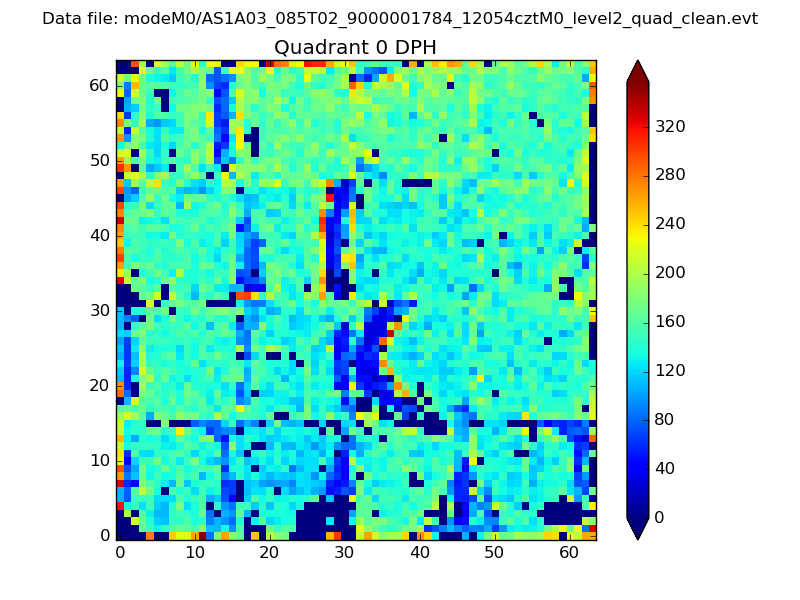 |
 |
Quadrant B |
|---|---|---|---|
| Quadrant D | 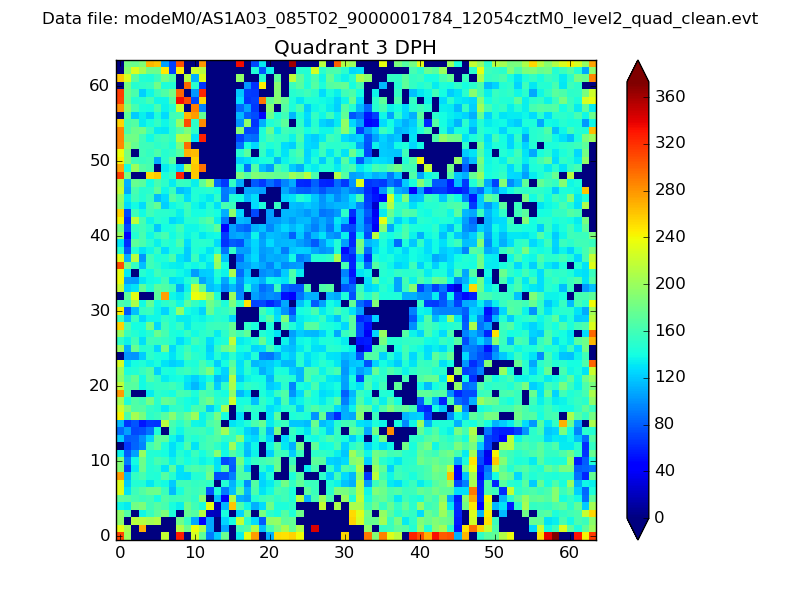 |
 |
Quadrant C |
| Plot type | Count rate plots | Images |
|---|---|---|
| Comparison with Poisson distribution Blue bars denote a histogram of data divided into 1 sec bins. Red curve is a Poisson curve with rate = median count rate of data. |
 |
 |
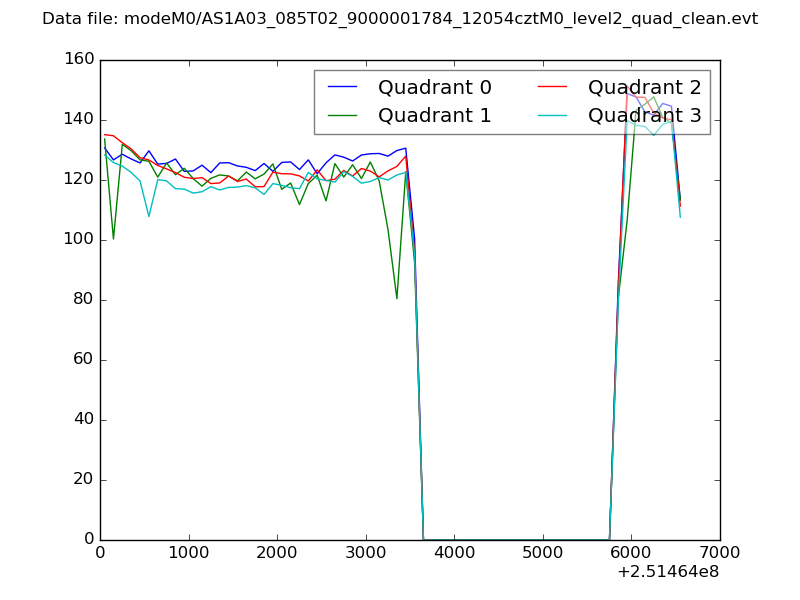
| Quadrant-wise count rates Data is divided into 100 sec bins |
 |
|
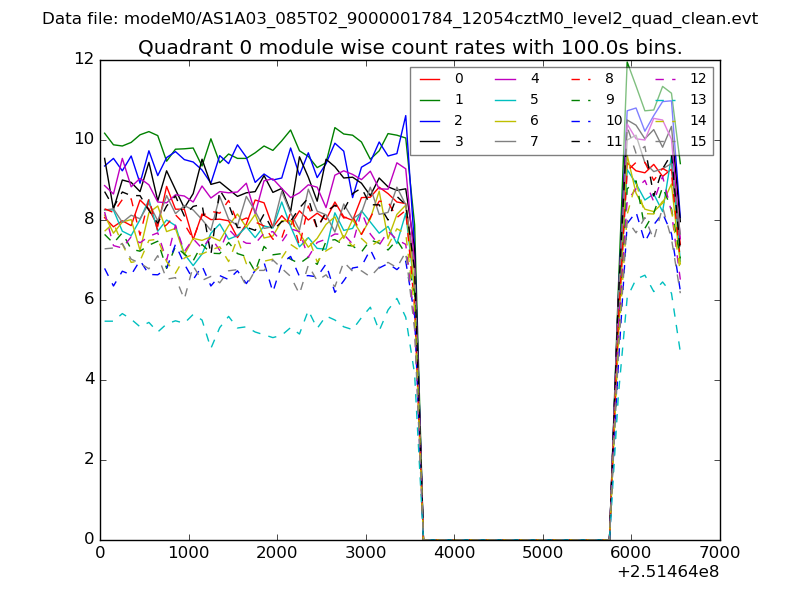
| Module-wise count rates for Quadrant A Data is divided into 100 sec bins |
 |
 |
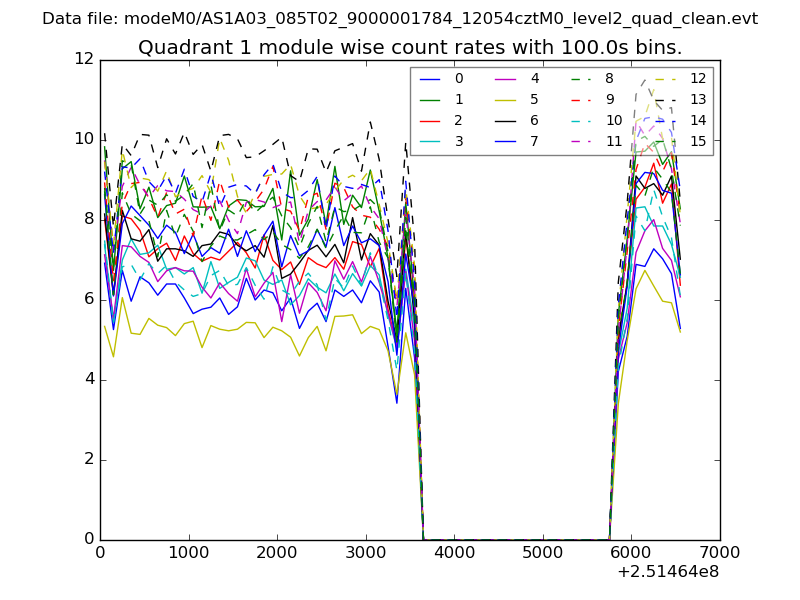
| Module-wise count rates for Quadrant B Data is divided into 100 sec bins |
 |
 |
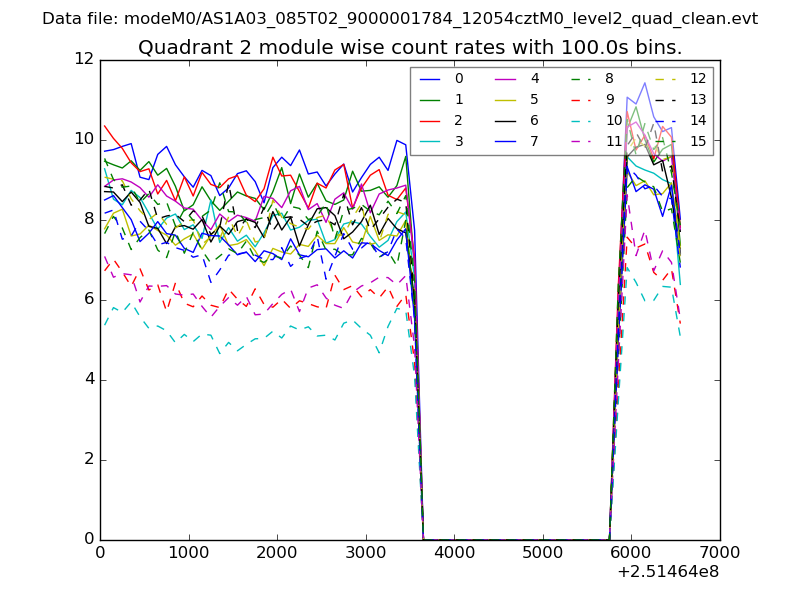
| Module-wise count rates for Quadrant C Data is divided into 100 sec bins |
 |
 |
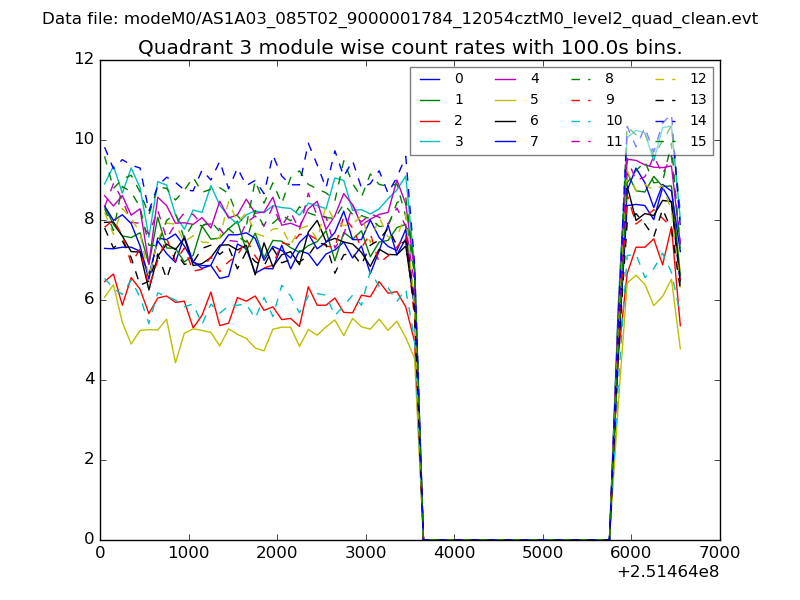
| Module-wise count rates for Quadrant D Data is divided into 100 sec bins |
 |
 |
| Parameter | Plot |
|---|---|
| CZT HV Monitor | 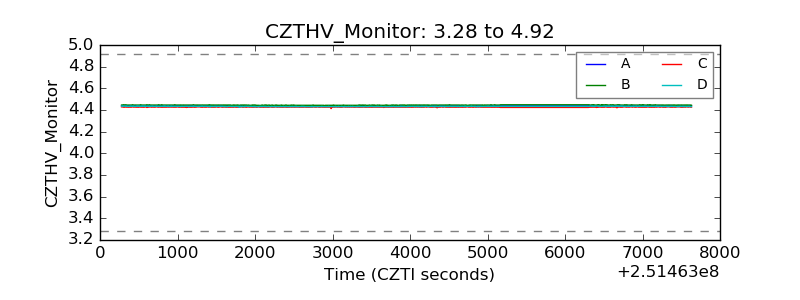 |
| D_VDD | 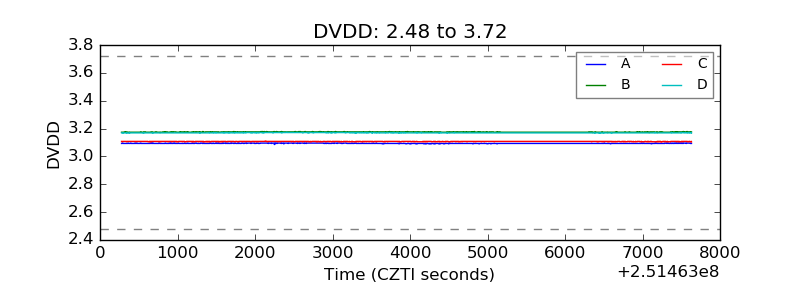 |
| Temperature 1 | 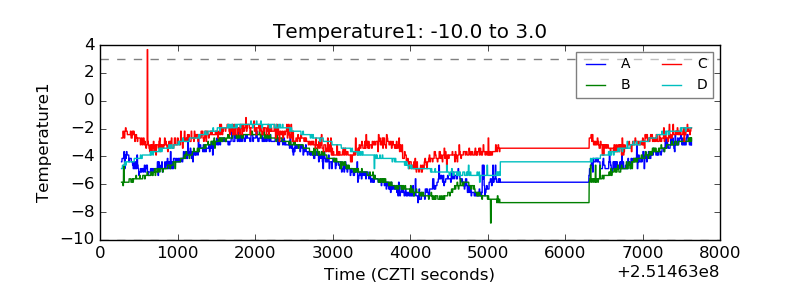 |
| Veto HV Monitor |  |
| Veto LLD | 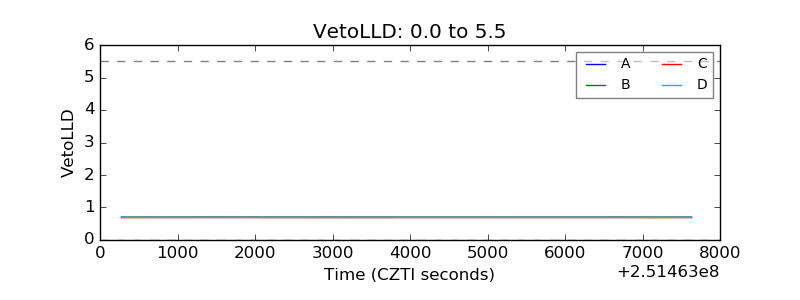 |
| Alpha Counter | 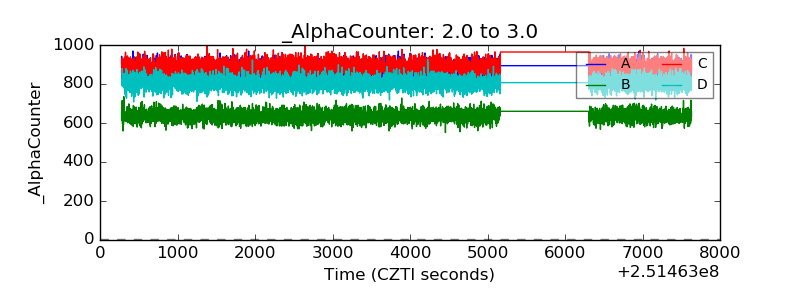 |
| _CPM_Rate | 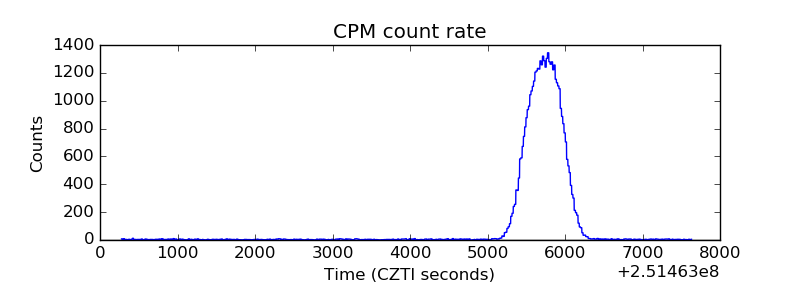 |
| CZT Counter | 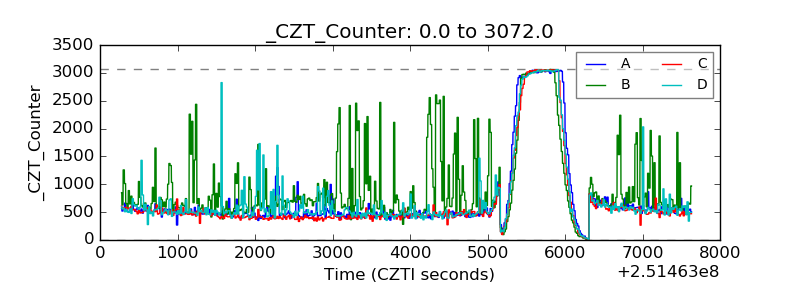 |
| +2.5 Volts monitor |  |
| +5 Volts monitor |  |
| _ROLL_ROT |  |
| _Roll_DEC | 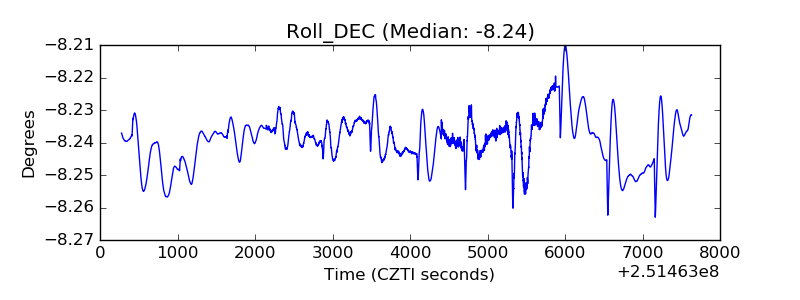 |
| _Roll_RA | 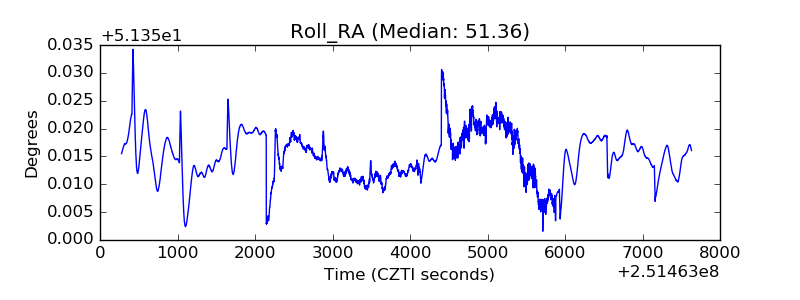 |
| Veto Counter | 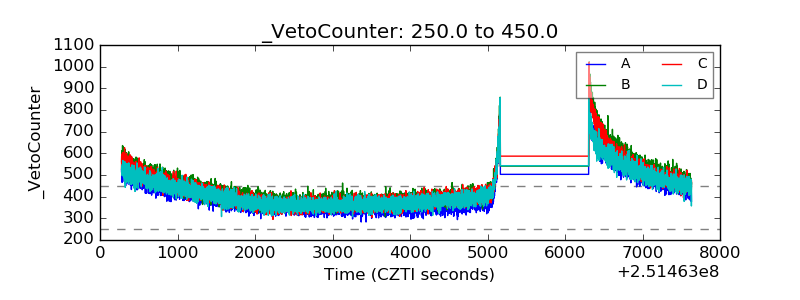 |