| Param | Original file | Final file |
|---|---|---|
| Filename | modeM0/AS1A03_085T02_9000001784_12055cztM0_level2.evt | modeM0/AS1A03_085T02_9000001784_12055cztM0_level2_quad_clean.evt |
| Size (bytes) | 528,223,680 | 98,928,000 |
| Size | 503.8 MB | 94.3 MB |
| Events in quadrant A | 3,477,415 | 657,524 |
| Events in quadrant B | 5,426,515 | 636,457 |
| Events in quadrant C | 3,087,822 | 640,250 |
| Events in quadrant D | 3,575,636 | 619,293 |
| Mode M9 | |||
|---|---|---|---|
| Quadrant | BADHDUFLAG | Total packets | Discarded packets |
| A | 0 | 16 | 0 |
| B | 0 | 16 | 0 |
| C | 0 | 16 | 0 |
| D | 0 | 17 | 0 |
| Mode SS | |||
|---|---|---|---|
| Quadrant | BADHDUFLAG | Total packets | Discarded packets |
| A | 0 | 128 | 0 |
| B | 0 | 128 | 0 |
| C | 0 | 128 | 0 |
| D | 0 | 128 | 0 |
| Mode M0 | |||
|---|---|---|---|
| Quadrant | BADHDUFLAG | Total packets | Discarded packets |
| A | 0 | 14444 | 3 |
| B | 0 | 20626 | 2 |
| C | 0 | 13375 | 2 |
| D | 0 | 14651 | 2 |
| Quadrant | Total seconds | Saturated seconds | Saturation percentage |
|---|---|---|---|
| A | 6340 | 140 | 2.208202% |
| B | 6340 | 690 | 10.883281% |
| C | 6340 | 40 | 0.630915% |
| D | 6340 | 59 | 0.930599% |
Noise dominated data is calculated using 1-second bins in cleaned event files. If a bin has >2000 counts, and if more than 50% of those come from <1% of pixels, then it is considered to be noise-dominated and hence unusable.
| Quadrant | # 1 sec bins | Bins with >0 counts | Bins with >2000 counts | High rate bins dominated by noise | Noise dominated (total time) | Noise dominated (detector-on time) | Marked lightcurve |
|---|---|---|---|---|---|---|---|
| A | 7566 | 6341 | 11 | 11 | 0.15% | 0.17% | 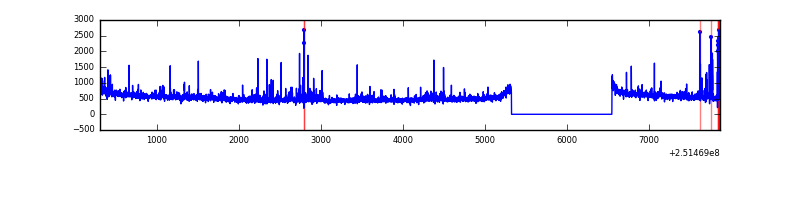 |
| B | 7566 | 6341 | 370 | 370 | 4.89% | 5.84% | 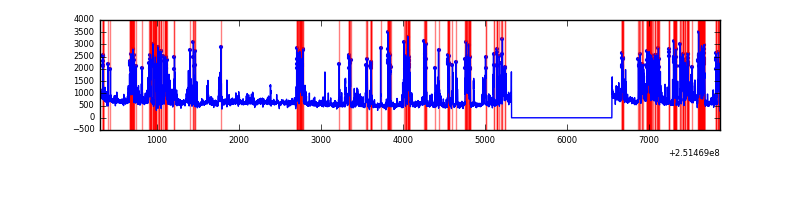 |
| C | 7566 | 6341 | 0 | 0 | 0.00% | 0.00% | 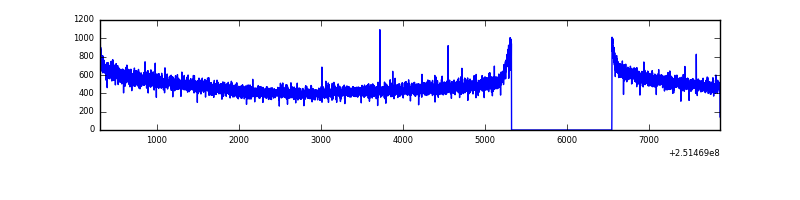 |
| D | 7566 | 6341 | 12 | 12 | 0.16% | 0.19% | 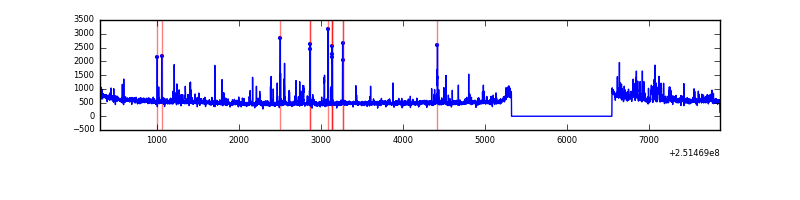 |
Top three noisy pixels from each quadrant. If the there are fewer than three noisy pixels in the level2.evt file, extra rows are filled as -1
| Pixel properties | Quadrant properties | ||||||
|---|---|---|---|---|---|---|---|
| Quadrant | DetID | PixID | Counts | Sigma | Mean | Median | Sigma |
| A | 1 | 162 | 94071 | 559.89 | 835 | 823 | 166.5 |
| A | 1 | 178 | 43476 | 256.1 | 835 | 823 | 166.5 |
| A | 1 | 161 | 39089 | 229.76 | 835 | 823 | 166.5 |
| B | 4 | 239 | 1199706 | 7870.93 | 805 | 790 | 152.3 |
| B | 0 | 85 | 559900 | 3670.58 | 805 | 790 | 152.3 |
| B | 4 | 206 | 169093 | 1104.92 | 805 | 790 | 152.3 |
| C | 13 | 61 | 5799 | 27.45 | 792 | 798 | 182.2 |
| C | 14 | 234 | 1932 | 6.23 | 792 | 798 | 182.2 |
| C | 3 | 202 | 1893 | 6.01 | 792 | 798 | 182.2 |
| D | 8 | 195 | 255265 | 1351.49 | 796 | 776 | 188.3 |
| D | 1 | 52 | 188596 | 997.44 | 796 | 776 | 188.3 |
| D | 10 | 50 | 54741 | 286.59 | 796 | 776 | 188.3 |
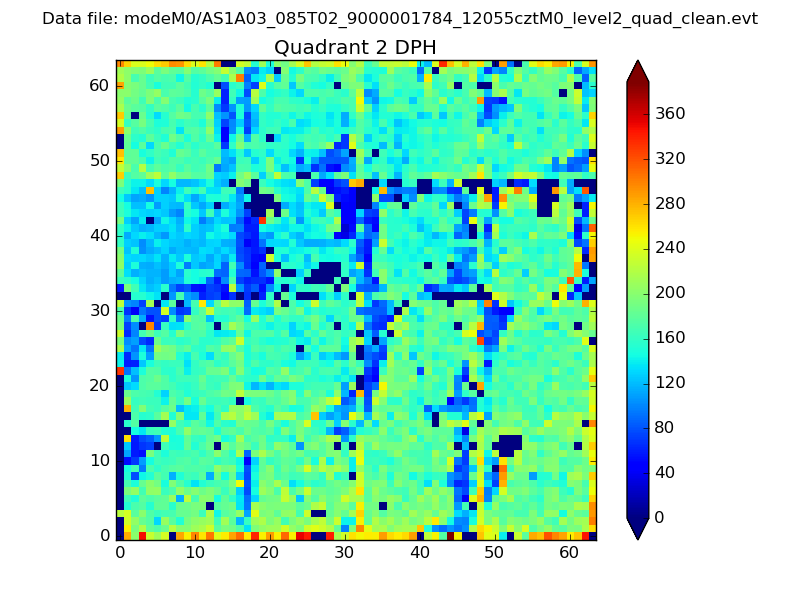
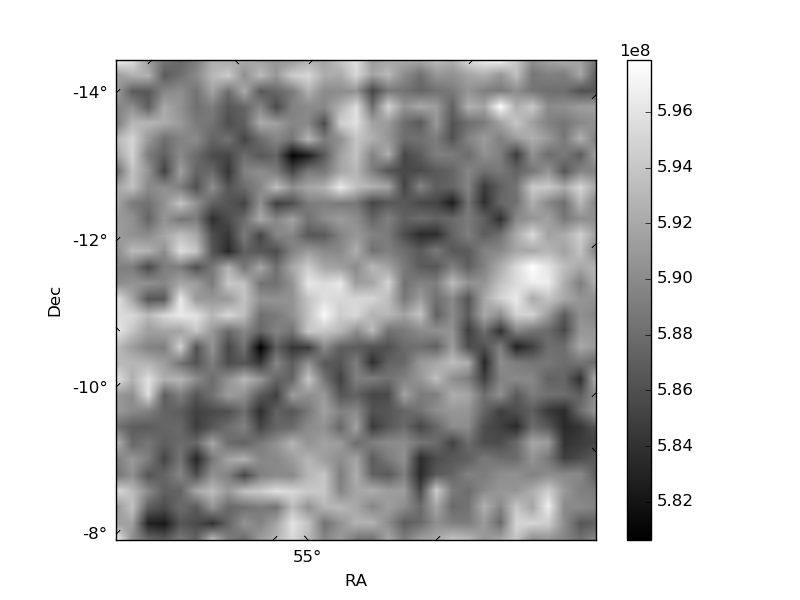
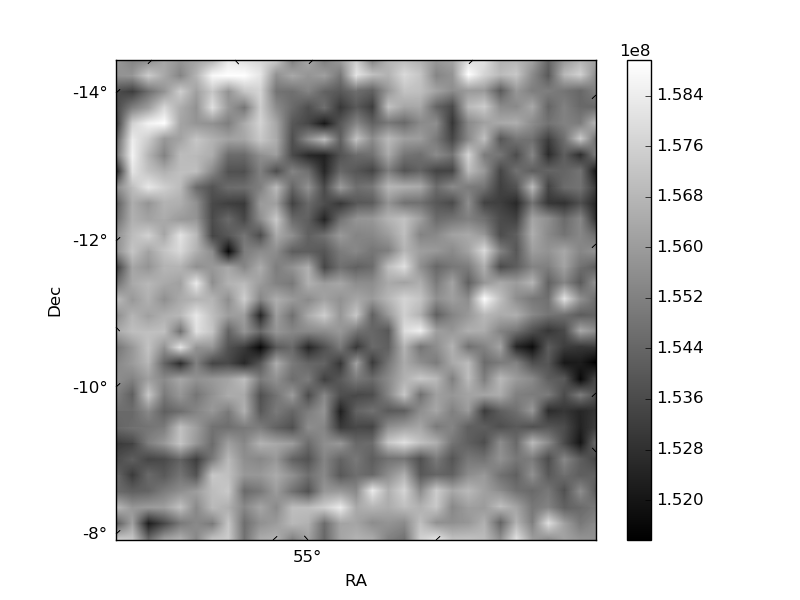
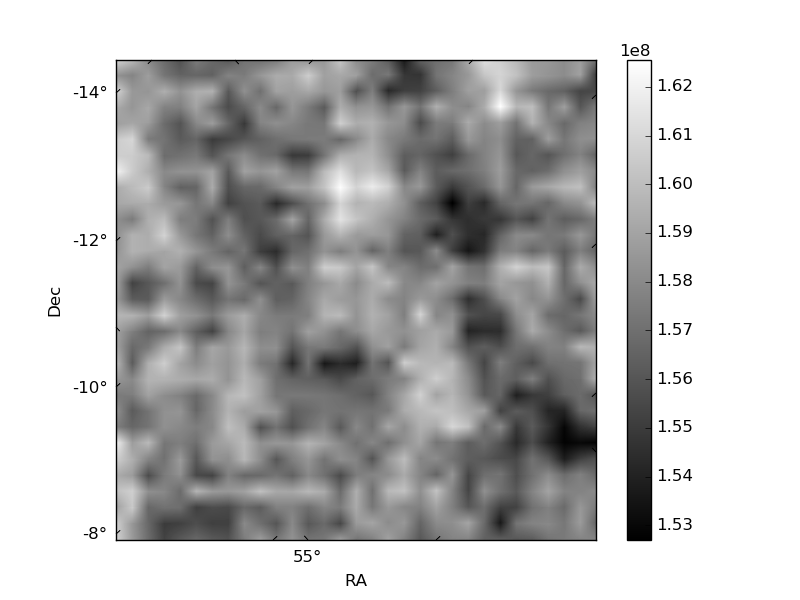
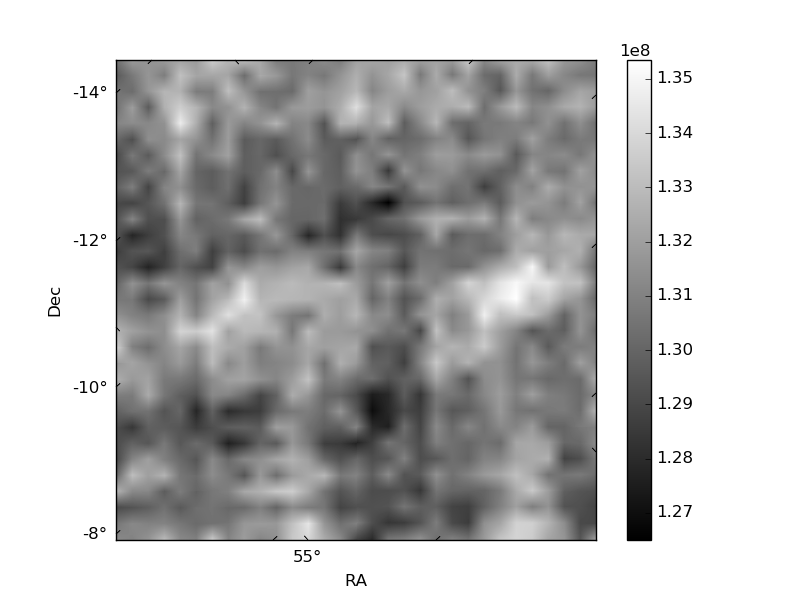
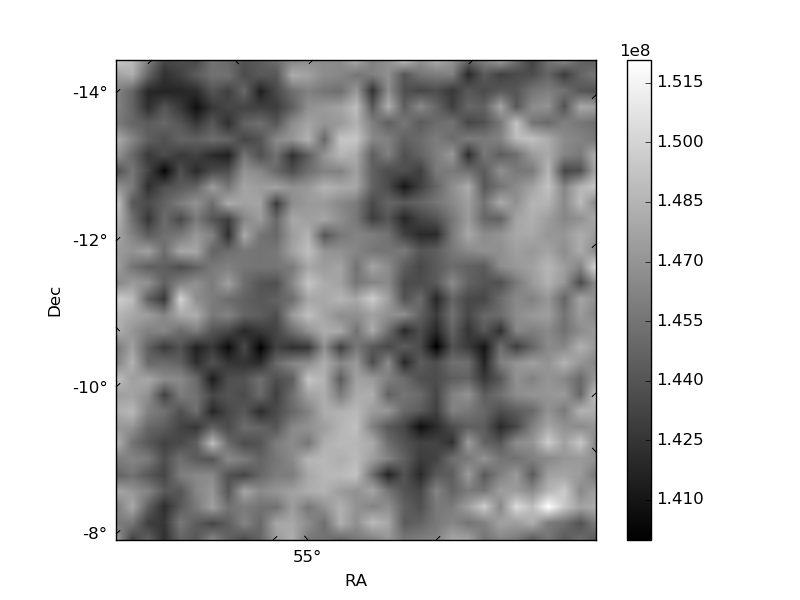
Histogram calculated using DETX and DETY for each event in the final _common_clean file
| Quadrant A | 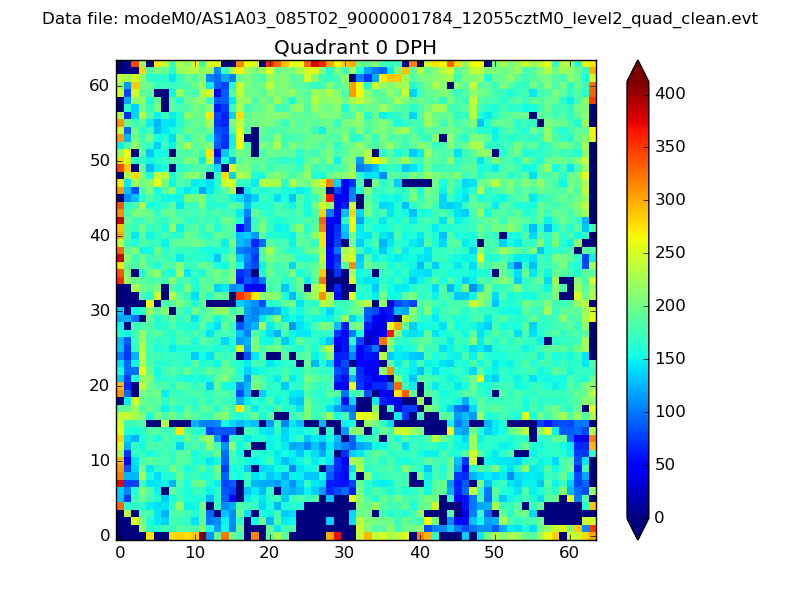 |
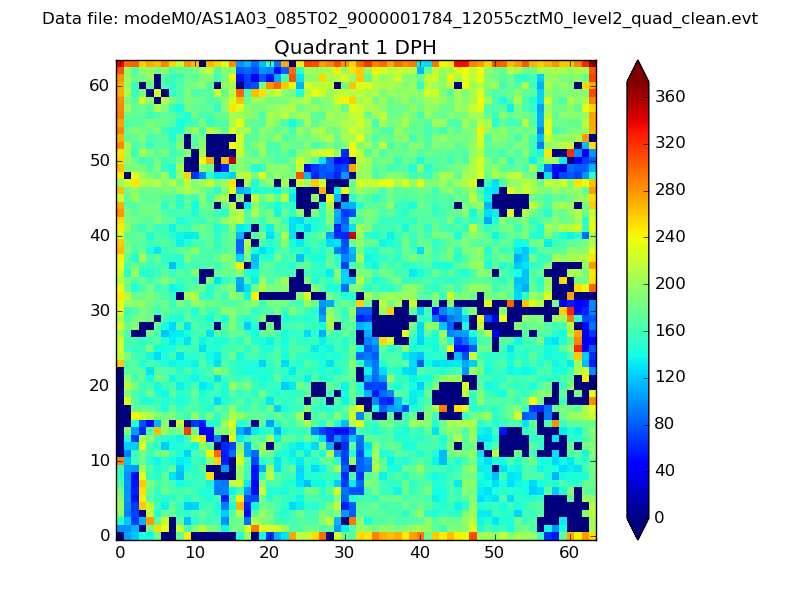 |
Quadrant B |
|---|---|---|---|
| Quadrant D | 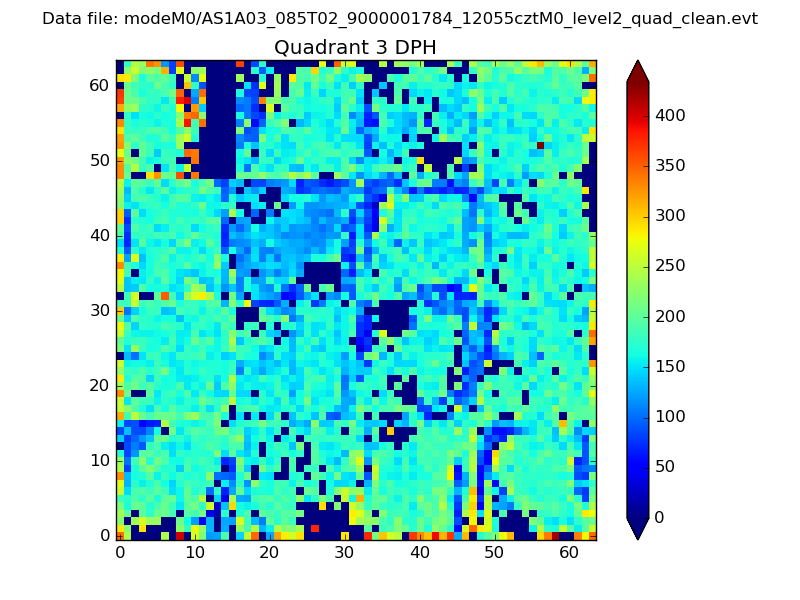 |
 |
Quadrant C |
| Plot type | Count rate plots | Images |
|---|---|---|
| Comparison with Poisson distribution Blue bars denote a histogram of data divided into 1 sec bins. Red curve is a Poisson curve with rate = median count rate of data. |
 |
 |
| Quadrant-wise count rates Data is divided into 100 sec bins |
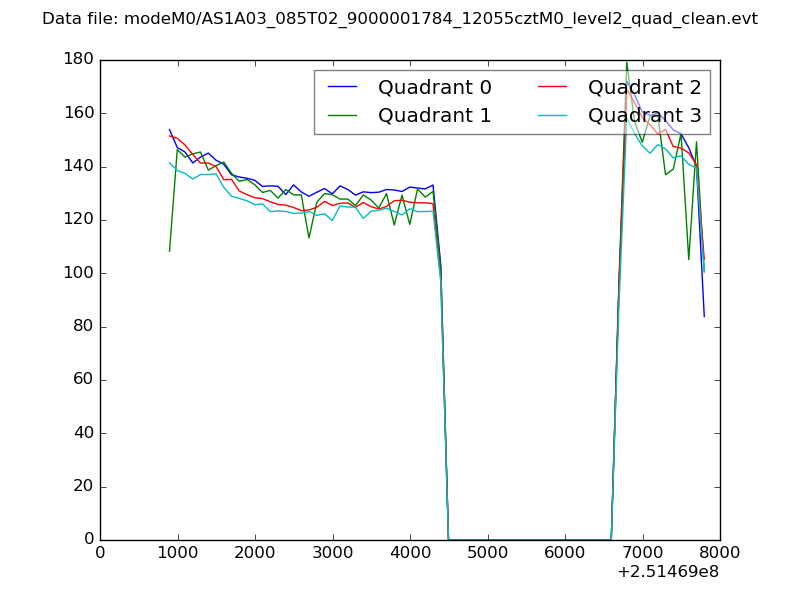 |
|
| Module-wise count rates for Quadrant A Data is divided into 100 sec bins |
 |
 |
| Module-wise count rates for Quadrant B Data is divided into 100 sec bins |
 |
 |
| Module-wise count rates for Quadrant C Data is divided into 100 sec bins |
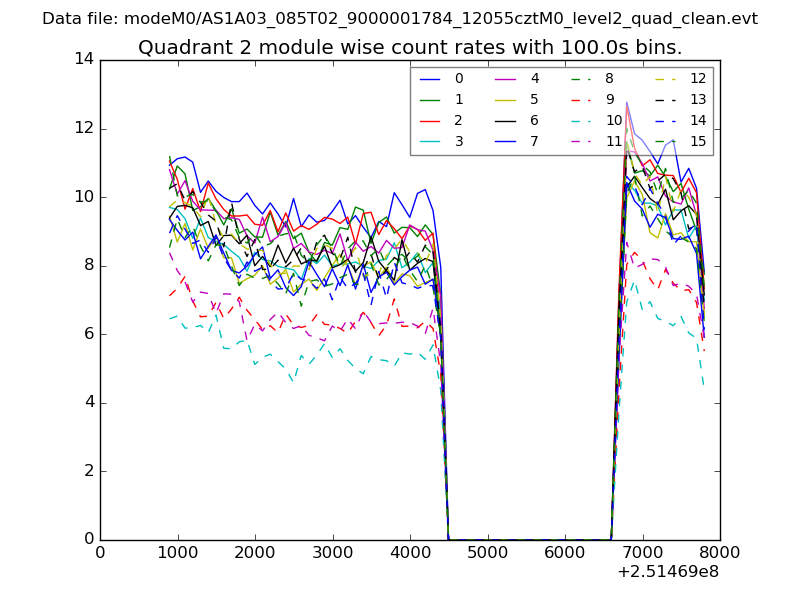 |
 |
| Module-wise count rates for Quadrant D Data is divided into 100 sec bins |
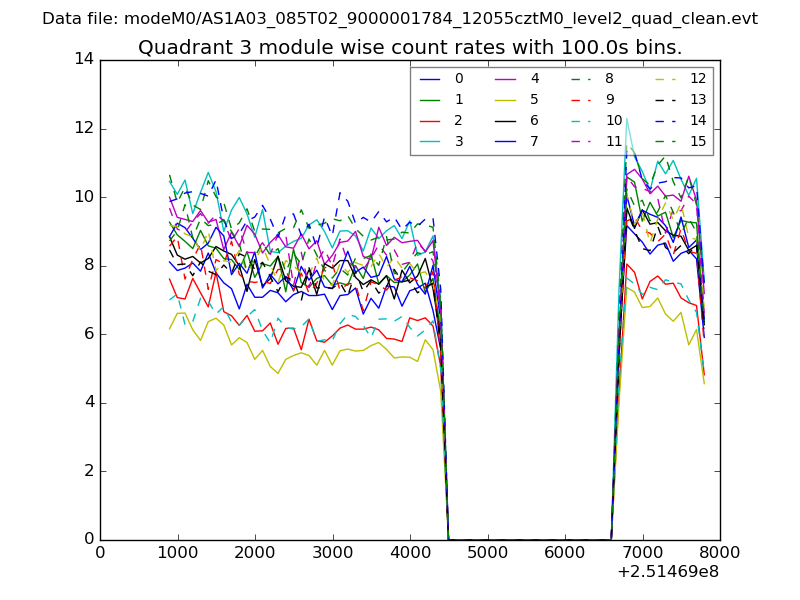 |
 |
| Parameter | Plot |
|---|---|
| CZT HV Monitor | 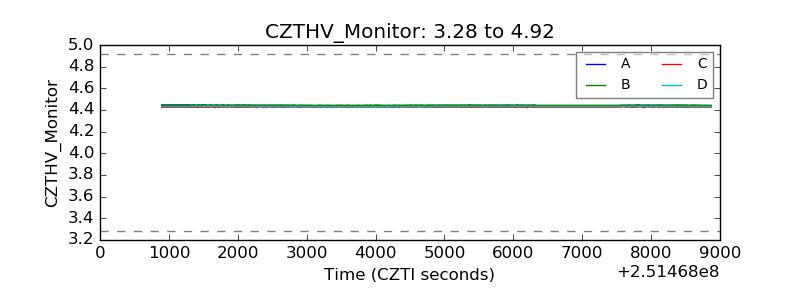 |
| D_VDD | 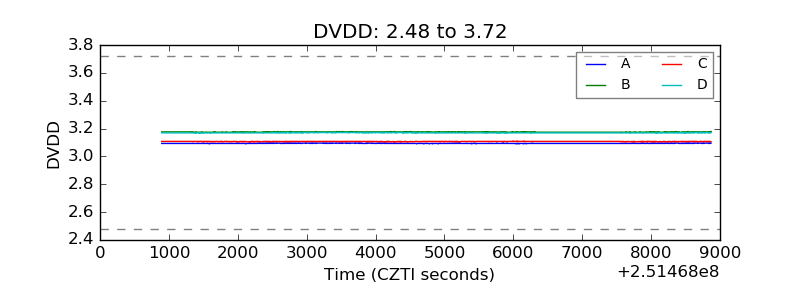 |
| Temperature 1 |  |
| Veto HV Monitor | 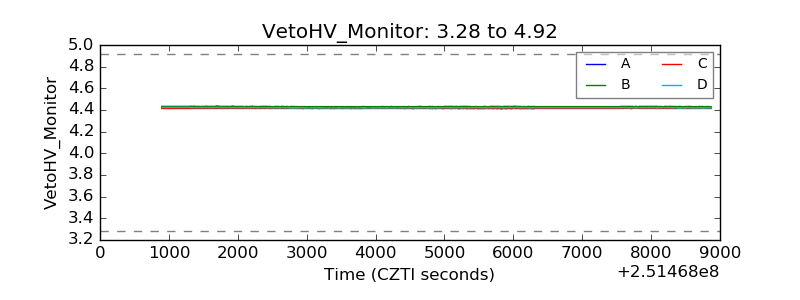 |
| Veto LLD | 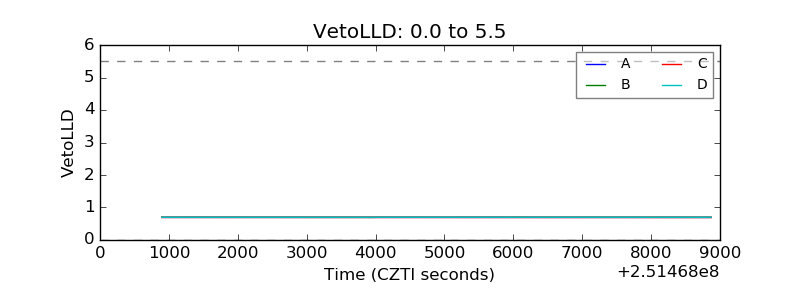 |
| Alpha Counter | 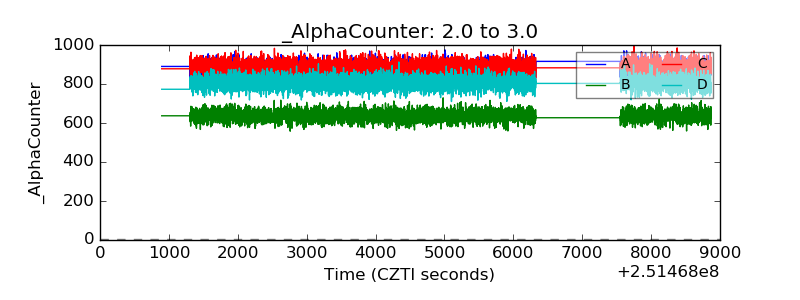 |
| _CPM_Rate | 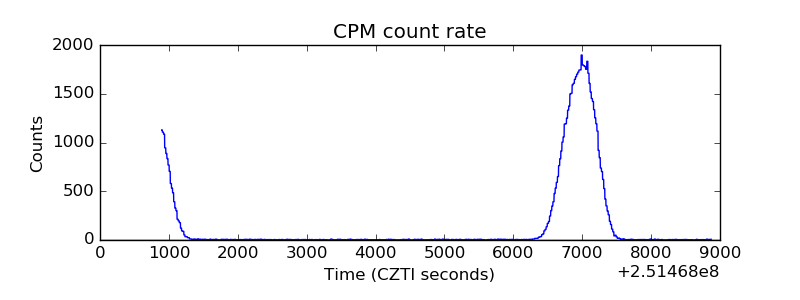 |
| CZT Counter | 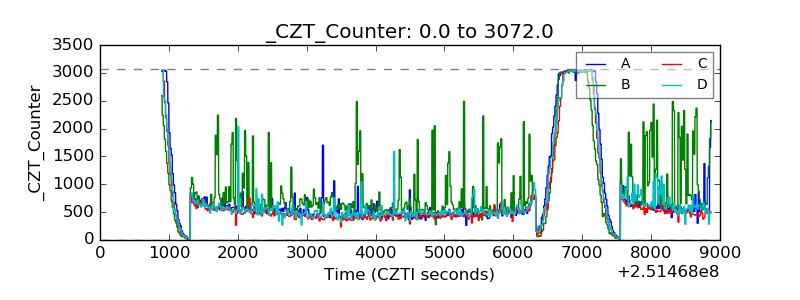 |
| +2.5 Volts monitor |  |
| +5 Volts monitor |  |
| _ROLL_ROT |  |
| _Roll_DEC | 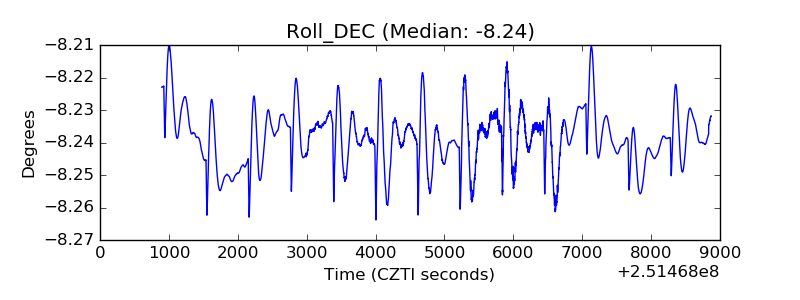 |
| _Roll_RA | 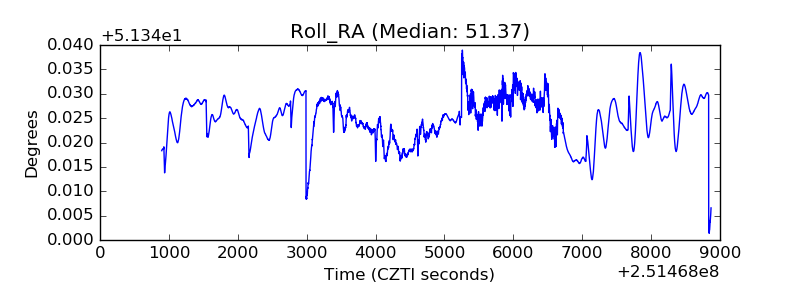 |
| Veto Counter | 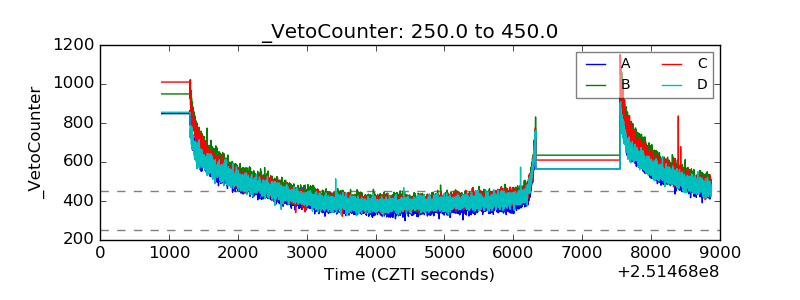 |