| Param | Original file | Final file |
|---|---|---|
| Filename | modeM0/AS1A03_085T02_9000001784_12056cztM0_level2.evt | modeM0/AS1A03_085T02_9000001784_12056cztM0_level2_quad_clean.evt |
| Size (bytes) | 620,352,000 | 103,308,480 |
| Size | 591.6 MB | 98.5 MB |
| Events in quadrant A | 3,450,375 | 715,157 |
| Events in quadrant B | 7,722,296 | 617,873 |
| Events in quadrant C | 3,112,034 | 688,954 |
| Events in quadrant D | 4,074,315 | 664,857 |
| Mode M9 | |||
|---|---|---|---|
| Quadrant | BADHDUFLAG | Total packets | Discarded packets |
| A | 0 | 25 | 0 |
| B | 0 | 25 | 0 |
| C | 0 | 25 | 0 |
| D | 0 | 25 | 0 |
| Mode SS | |||
|---|---|---|---|
| Quadrant | BADHDUFLAG | Total packets | Discarded packets |
| A | 0 | 132 | 0 |
| B | 0 | 132 | 0 |
| C | 0 | 132 | 0 |
| D | 0 | 132 | 0 |
| Mode M0 | |||
|---|---|---|---|
| Quadrant | BADHDUFLAG | Total packets | Discarded packets |
| A | 0 | 14302 | 3 |
| B | 0 | 27284 | 2 |
| C | 0 | 13362 | 2 |
| D | 0 | 16069 | 2 |
| Quadrant | Total seconds | Saturated seconds | Saturation percentage |
|---|---|---|---|
| A | 6318 | 201 | 3.181387% |
| B | 6318 | 1846 | 29.218107% |
| C | 6318 | 85 | 1.345362% |
| D | 6318 | 180 | 2.849003% |
Noise dominated data is calculated using 1-second bins in cleaned event files. If a bin has >2000 counts, and if more than 50% of those come from <1% of pixels, then it is considered to be noise-dominated and hence unusable.
| Quadrant | # 1 sec bins | Bins with >0 counts | Bins with >2000 counts | High rate bins dominated by noise | Noise dominated (total time) | Noise dominated (detector-on time) | Marked lightcurve |
|---|---|---|---|---|---|---|---|
| A | 8814 | 6319 | 10 | 10 | 0.11% | 0.16% | 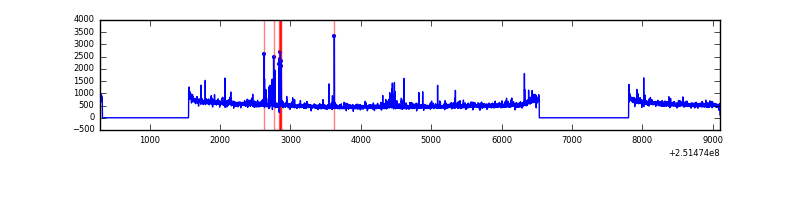 |
| B | 8814 | 6319 | 1383 | 1383 | 15.69% | 21.89% | 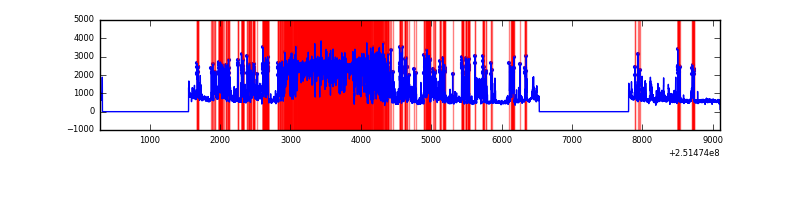 |
| C | 8814 | 6319 | 1 | 1 | 0.01% | 0.02% |  |
| D | 8814 | 6319 | 58 | 58 | 0.66% | 0.92% |  |
Top three noisy pixels from each quadrant. If the there are fewer than three noisy pixels in the level2.evt file, extra rows are filled as -1
| Pixel properties | Quadrant properties | ||||||
|---|---|---|---|---|---|---|---|
| Quadrant | DetID | PixID | Counts | Sigma | Mean | Median | Sigma |
| A | 1 | 162 | 67272 | 391.98 | 839 | 825 | 169.5 |
| A | 9 | 143 | 39196 | 226.35 | 839 | 825 | 169.5 |
| A | 1 | 178 | 29736 | 170.55 | 839 | 825 | 169.5 |
| B | 0 | 85 | 3301791 | 22796.89 | 759 | 744 | 144.8 |
| B | 4 | 239 | 1146437 | 7912.11 | 759 | 744 | 144.8 |
| B | 4 | 206 | 169079 | 1162.51 | 759 | 744 | 144.8 |
| C | 14 | 234 | 6815 | 32.76 | 796 | 800 | 183.6 |
| C | 13 | 61 | 5833 | 27.41 | 796 | 800 | 183.6 |
| C | 12 | 4 | 1917 | 6.08 | 796 | 800 | 183.6 |
| D | 1 | 52 | 666812 | 3538.12 | 798 | 778 | 188.2 |
| D | 8 | 195 | 296281 | 1569.78 | 798 | 778 | 188.2 |
| D | 10 | 50 | 57377 | 300.67 | 798 | 778 | 188.2 |
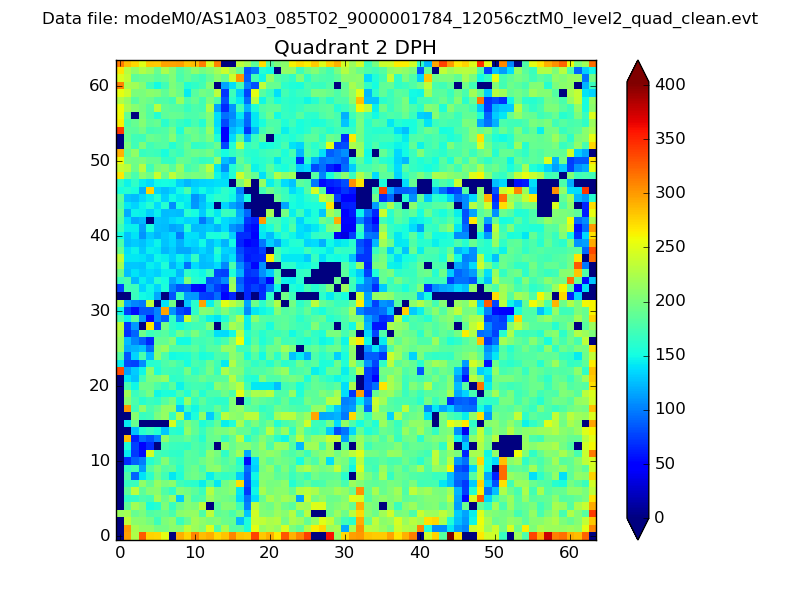
Histogram calculated using DETX and DETY for each event in the final _common_clean file
| Quadrant A | 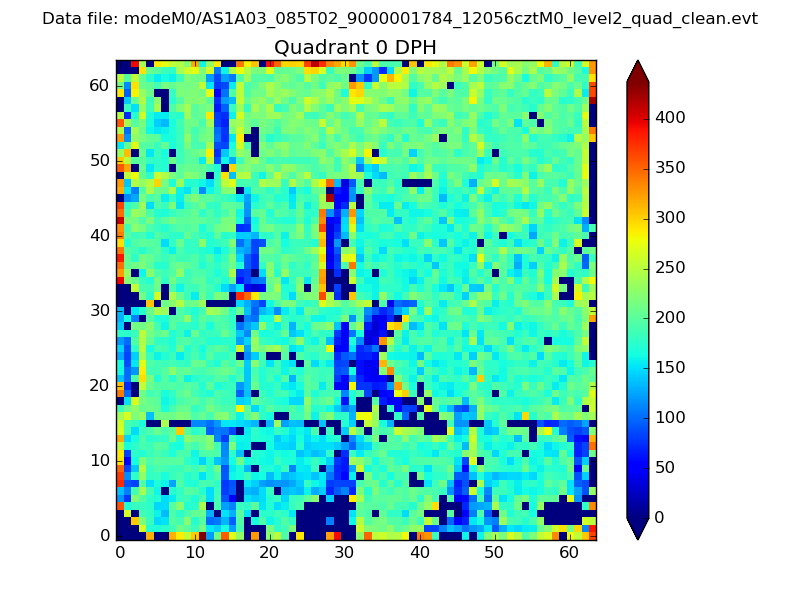 |
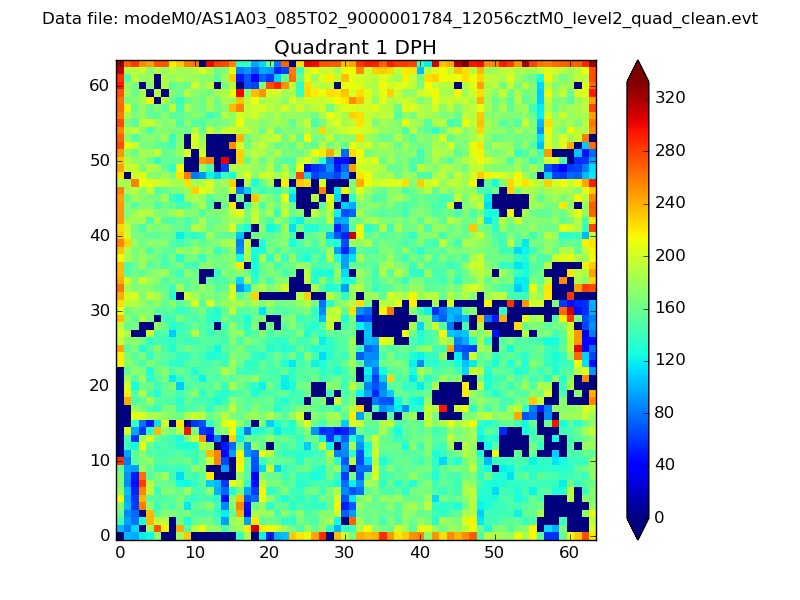 |
Quadrant B |
|---|---|---|---|
| Quadrant D | 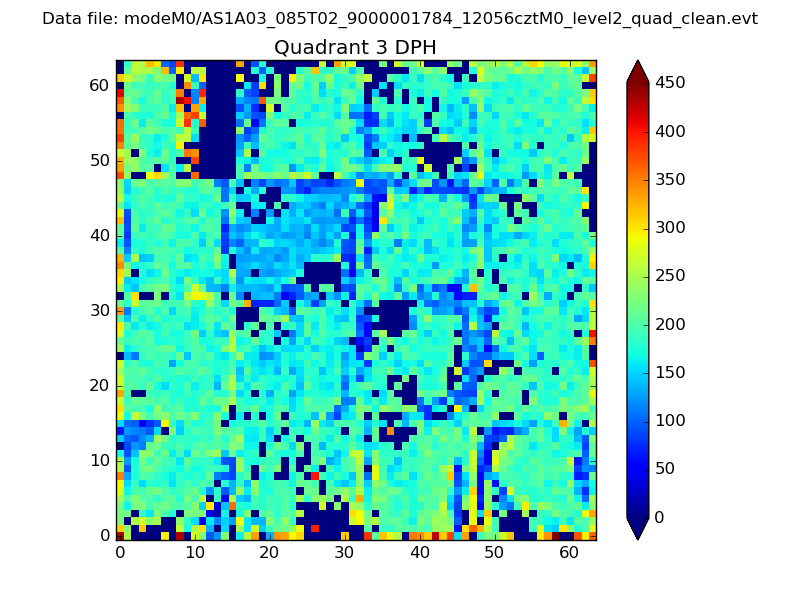 |
 |
Quadrant C |
| Plot type | Count rate plots | Images |
|---|---|---|
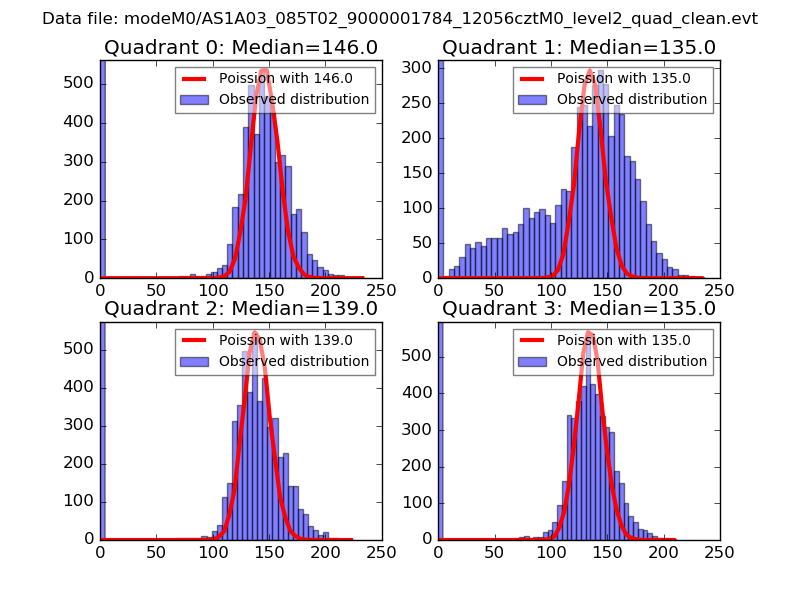
| Comparison with Poisson distribution Blue bars denote a histogram of data divided into 1 sec bins. Red curve is a Poisson curve with rate = median count rate of data. |
 |
 |
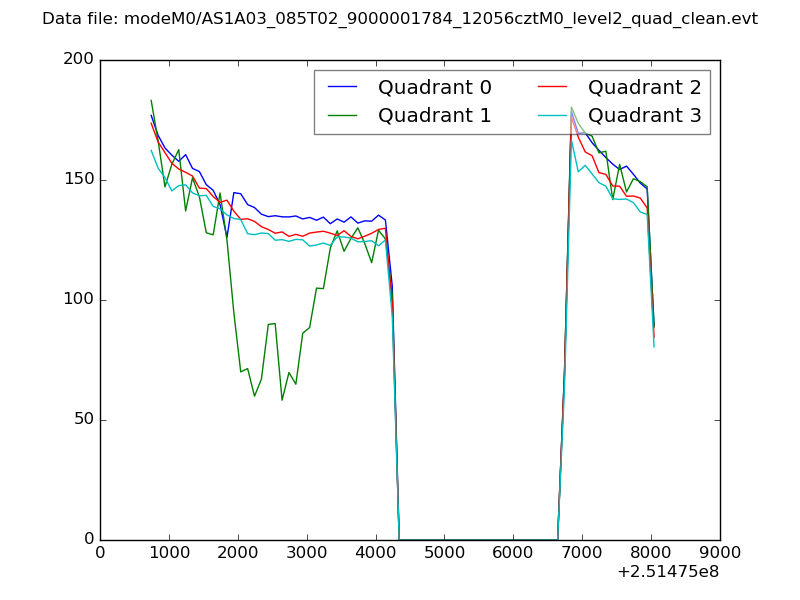
| Quadrant-wise count rates Data is divided into 100 sec bins |
 |
|
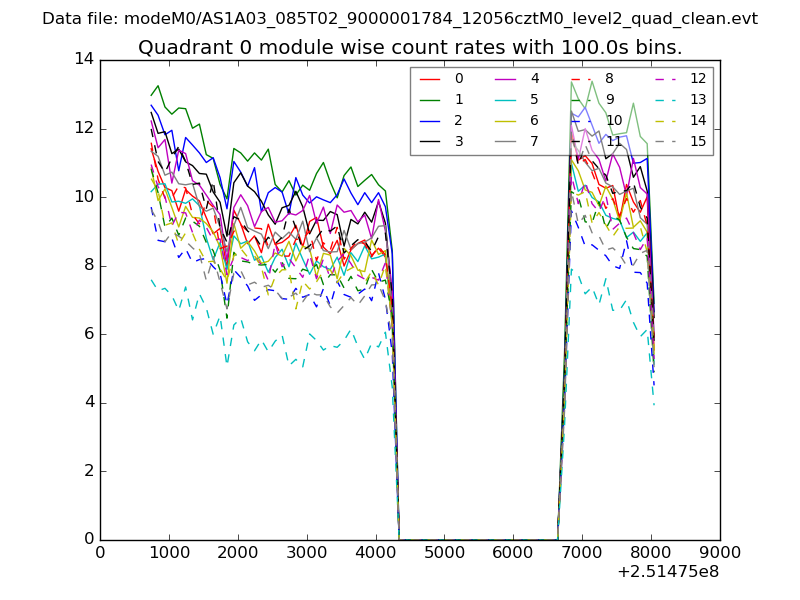
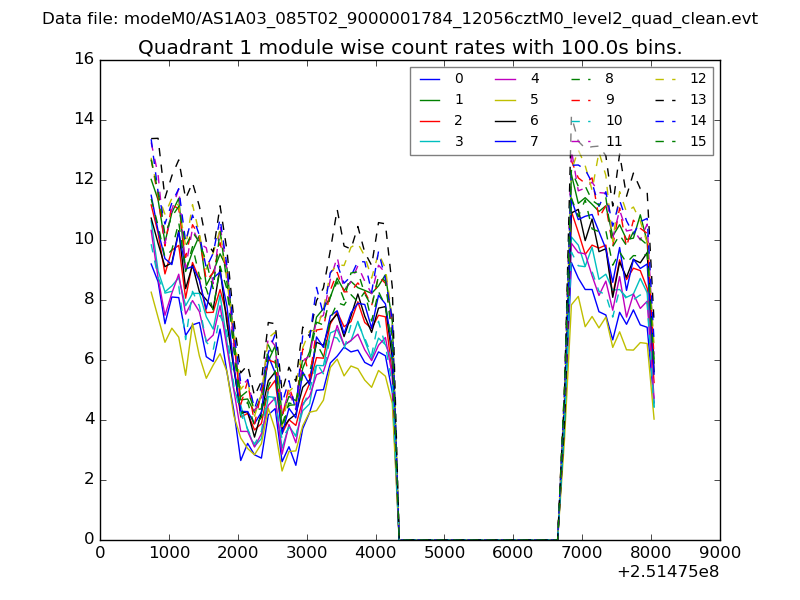
| Module-wise count rates for Quadrant A Data is divided into 100 sec bins |
 |
 |
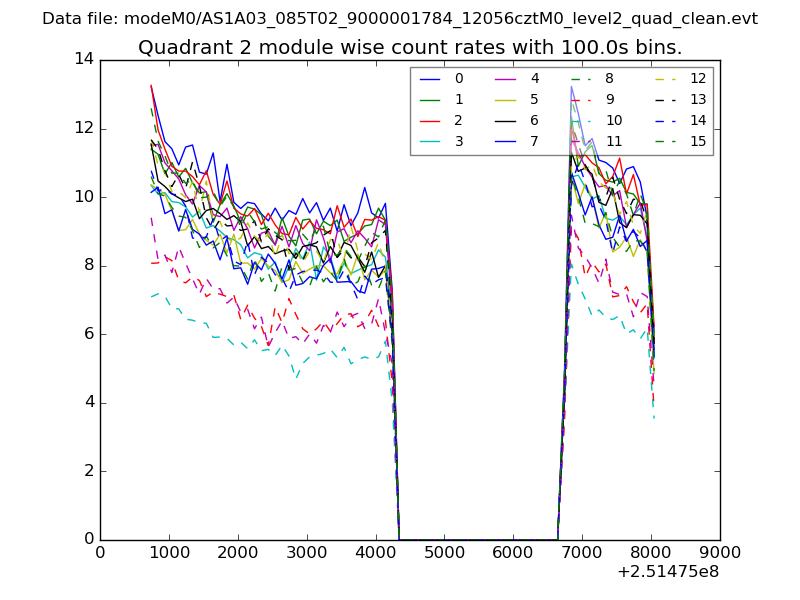
| Module-wise count rates for Quadrant B Data is divided into 100 sec bins |
 |
 |
| Module-wise count rates for Quadrant C Data is divided into 100 sec bins |
 |
 |
| Module-wise count rates for Quadrant D Data is divided into 100 sec bins |
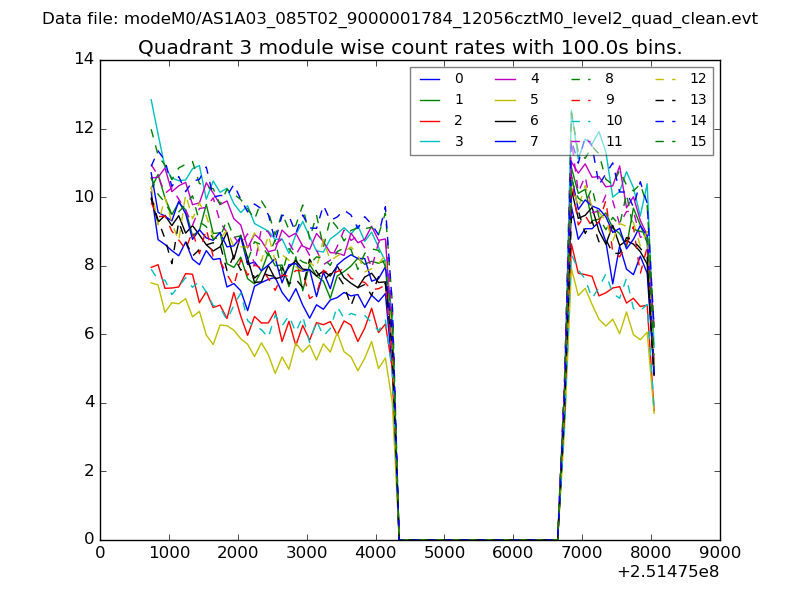 |
 |
| Parameter | Plot |
|---|---|
| CZT HV Monitor | 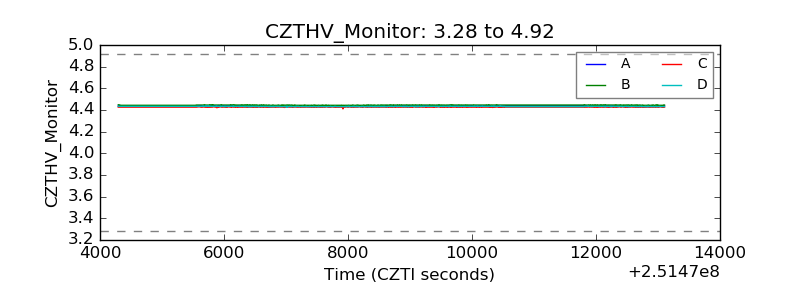 |
| D_VDD |  |
| Temperature 1 | 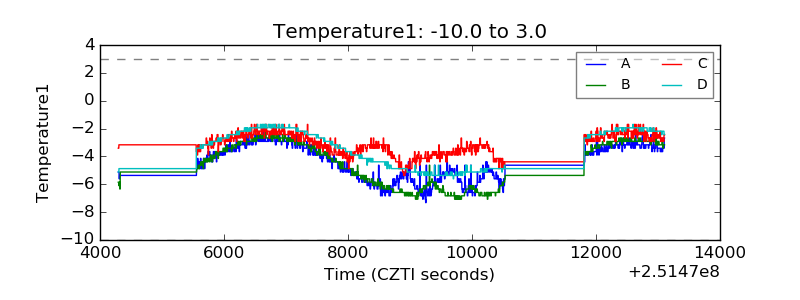 |
| Veto HV Monitor |  |
| Veto LLD | 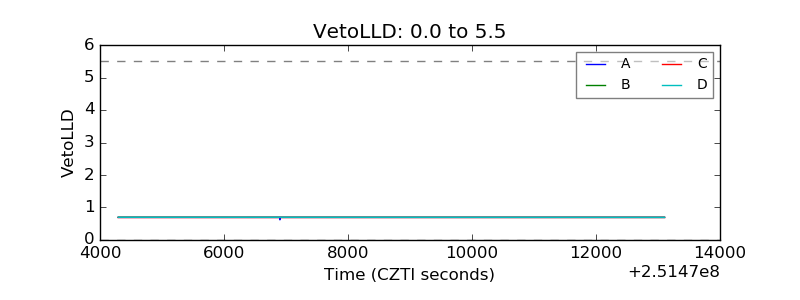 |
| Alpha Counter | 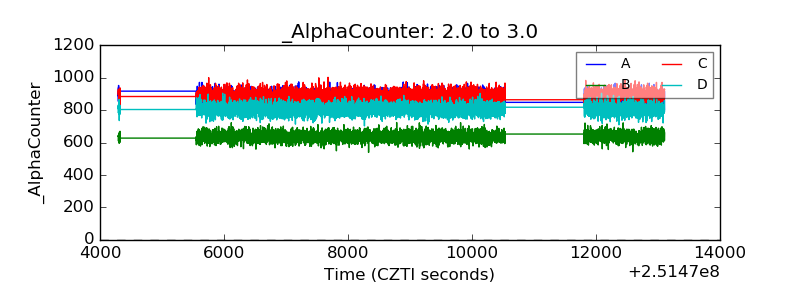 |
| _CPM_Rate |  |
| CZT Counter | 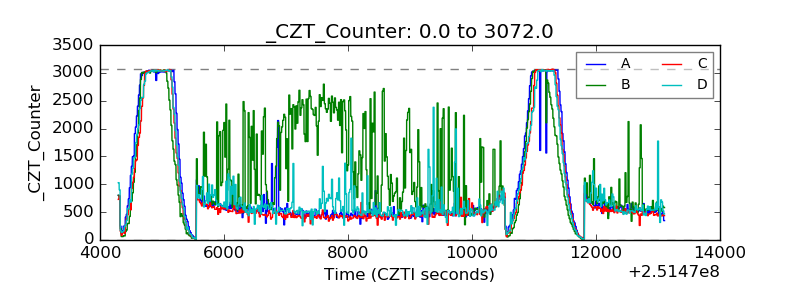 |
| +2.5 Volts monitor |  |
| +5 Volts monitor |  |
| _ROLL_ROT | 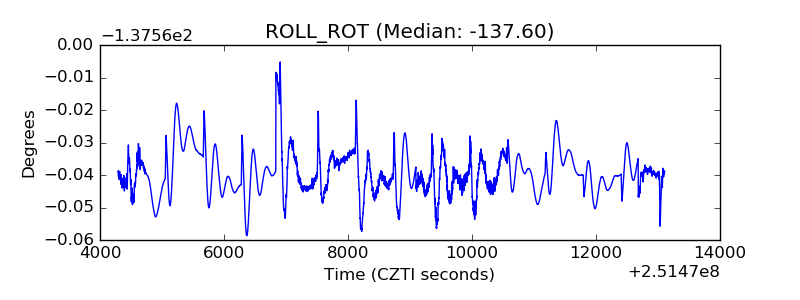 |
| _Roll_DEC | 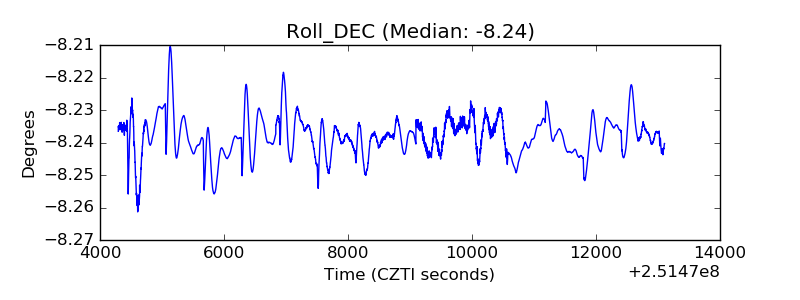 |
| _Roll_RA |  |
| Veto Counter | 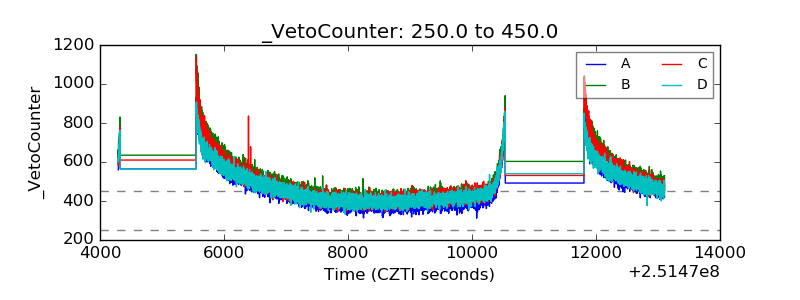 |