| Param | Original file | Final file |
|---|---|---|
| Filename | modeM0/AS1A03_085T02_9000001784_12058cztM0_level2.evt | modeM0/AS1A03_085T02_9000001784_12058cztM0_level2_quad_clean.evt |
| Size (bytes) | 558,457,920 | 93,000,960 |
| Size | 532.6 MB | 88.7 MB |
| Events in quadrant A | 3,302,329 | 613,978 |
| Events in quadrant B | 5,132,513 | 601,519 |
| Events in quadrant C | 3,091,030 | 588,989 |
| Events in quadrant D | 4,941,837 | 554,049 |
| Mode M9 | |||
|---|---|---|---|
| Quadrant | BADHDUFLAG | Total packets | Discarded packets |
| A | 0 | 16 | 0 |
| B | 0 | 16 | 0 |
| C | 0 | 16 | 0 |
| D | 0 | 17 | 0 |
| Mode SS | |||
|---|---|---|---|
| Quadrant | BADHDUFLAG | Total packets | Discarded packets |
| A | 0 | 134 | 0 |
| B | 0 | 134 | 0 |
| C | 0 | 134 | 0 |
| D | 0 | 134 | 0 |
| Mode M0 | |||
|---|---|---|---|
| Quadrant | BADHDUFLAG | Total packets | Discarded packets |
| A | 0 | 14068 | 3 |
| B | 0 | 19723 | 2 |
| C | 0 | 13672 | 2 |
| D | 0 | 18931 | 2 |
| Quadrant | Total seconds | Saturated seconds | Saturation percentage |
|---|---|---|---|
| A | 6561 | 75 | 1.143118% |
| B | 6561 | 731 | 11.141594% |
| C | 6561 | 21 | 0.320073% |
| D | 6561 | 321 | 4.892547% |
Noise dominated data is calculated using 1-second bins in cleaned event files. If a bin has >2000 counts, and if more than 50% of those come from <1% of pixels, then it is considered to be noise-dominated and hence unusable.
| Quadrant | # 1 sec bins | Bins with >0 counts | Bins with >2000 counts | High rate bins dominated by noise | Noise dominated (total time) | Noise dominated (detector-on time) | Marked lightcurve |
|---|---|---|---|---|---|---|---|
| A | 7742 | 6563 | 2 | 2 | 0.03% | 0.03% | 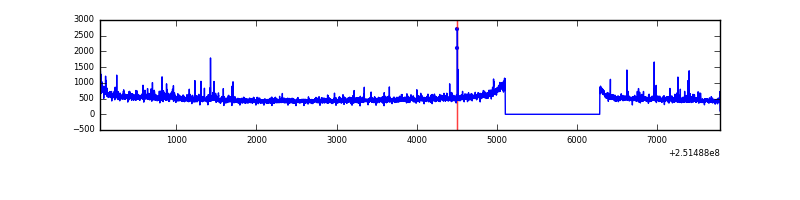 |
| B | 7742 | 6562 | 341 | 341 | 4.40% | 5.20% | 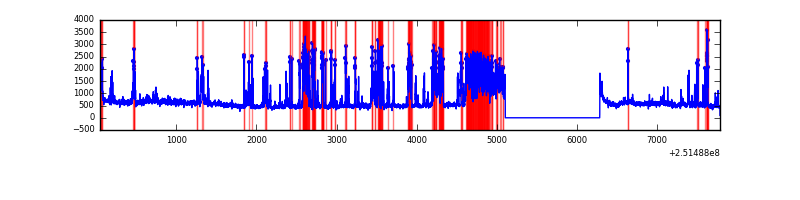 |
| C | 7742 | 6563 | 0 | 0 | 0.00% | 0.00% |  |
| D | 7742 | 6563 | 286 | 286 | 3.69% | 4.36% | 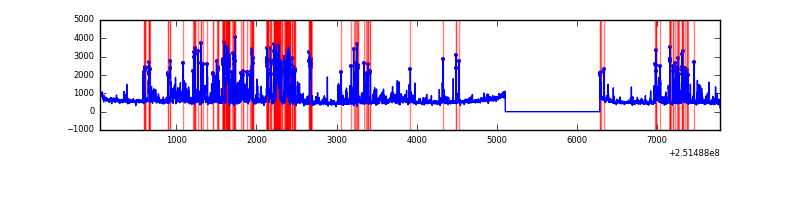 |
Top three noisy pixels from each quadrant. If the there are fewer than three noisy pixels in the level2.evt file, extra rows are filled as -1
| Pixel properties | Quadrant properties | ||||||
|---|---|---|---|---|---|---|---|
| Quadrant | DetID | PixID | Counts | Sigma | Mean | Median | Sigma |
| A | 1 | 162 | 41549 | 242.29 | 826 | 809 | 168.1 |
| A | 1 | 178 | 17723 | 100.59 | 826 | 809 | 168.1 |
| A | 1 | 161 | 16089 | 90.87 | 826 | 809 | 168.1 |
| B | 4 | 239 | 1693377 | 11199.91 | 793 | 775 | 151.1 |
| B | 4 | 206 | 244612 | 1613.46 | 793 | 775 | 151.1 |
| B | 15 | 204 | 64532 | 421.88 | 793 | 775 | 151.1 |
| C | 5 | 96 | 26566 | 140.64 | 785 | 790 | 183.3 |
| C | 13 | 61 | 5849 | 27.6 | 785 | 790 | 183.3 |
| C | 14 | 234 | 2611 | 9.94 | 785 | 790 | 183.3 |
| D | 1 | 52 | 1605227 | 8666.43 | 773 | 752 | 185.1 |
| D | 8 | 195 | 295224 | 1590.56 | 773 | 752 | 185.1 |
| D | 13 | 249 | 79712 | 426.5 | 773 | 752 | 185.1 |
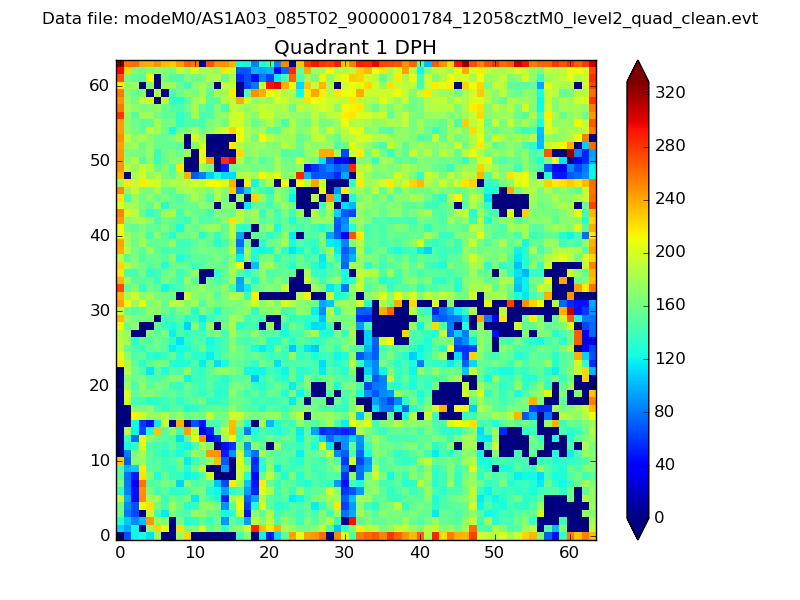
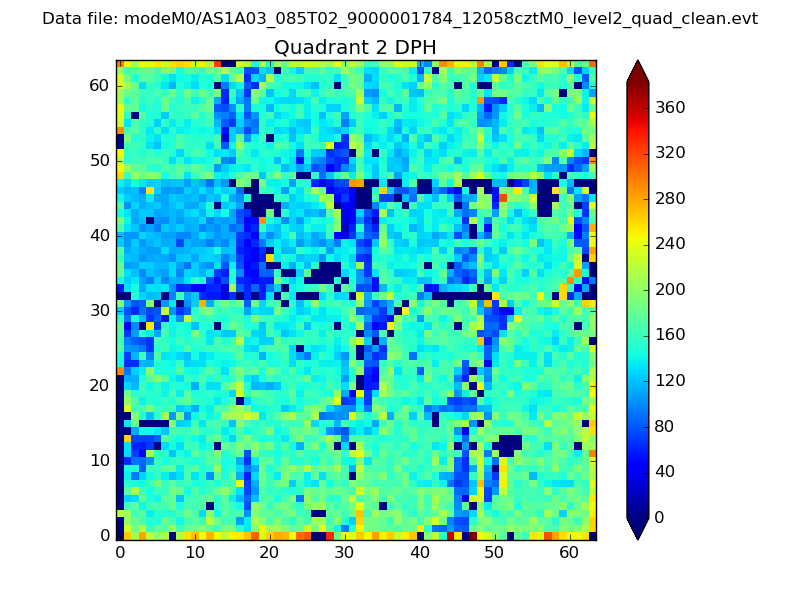
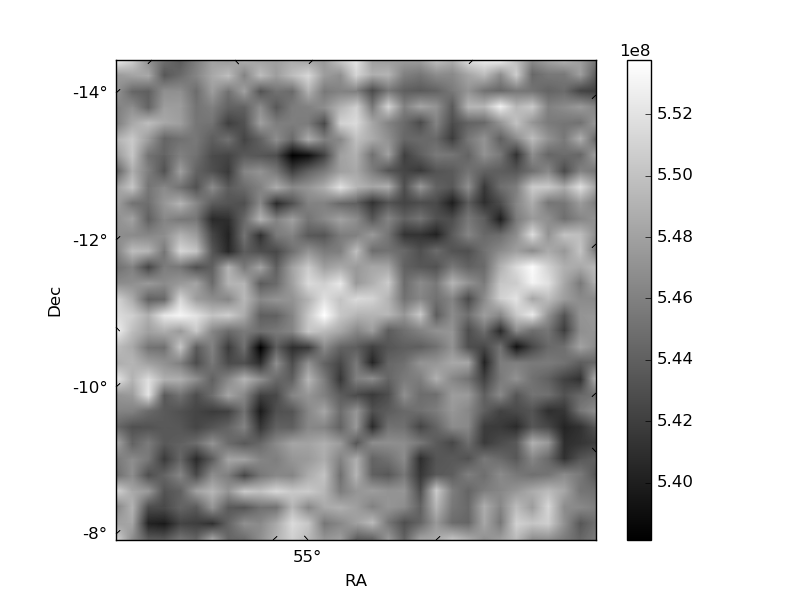
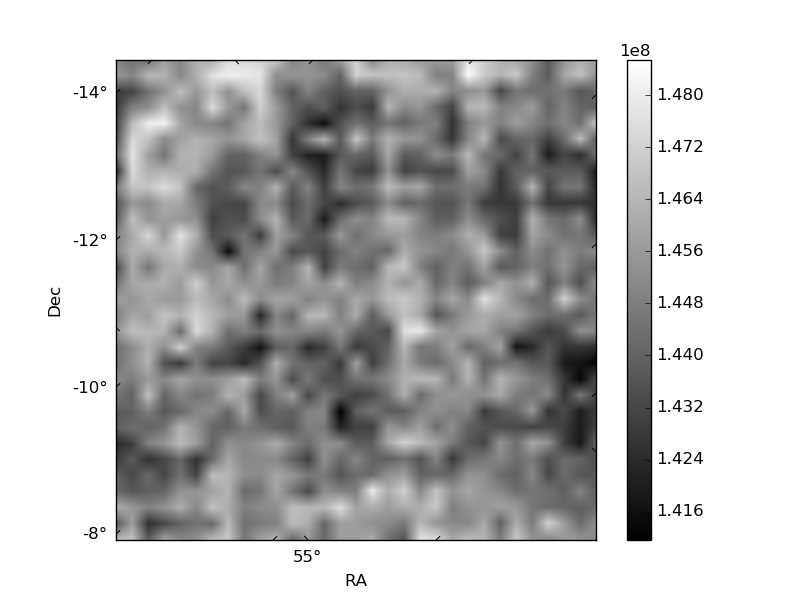
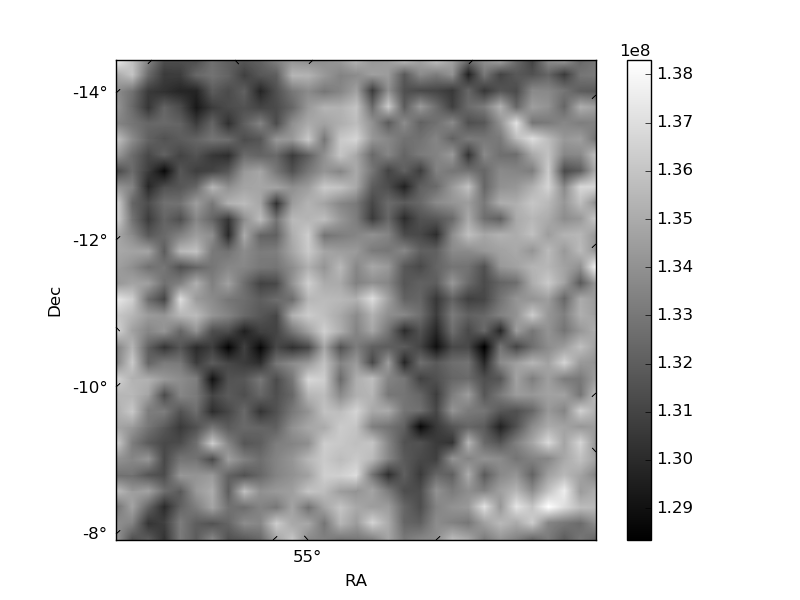
Histogram calculated using DETX and DETY for each event in the final _common_clean file
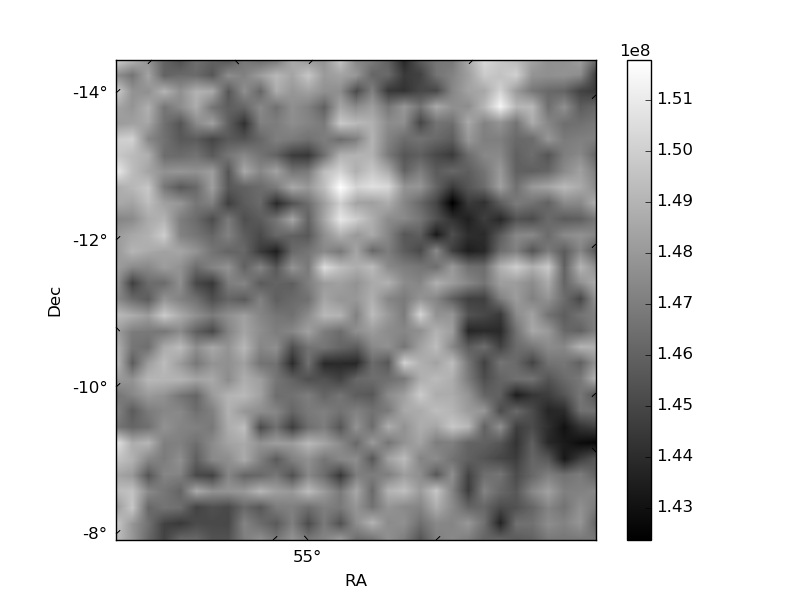
| Quadrant A | 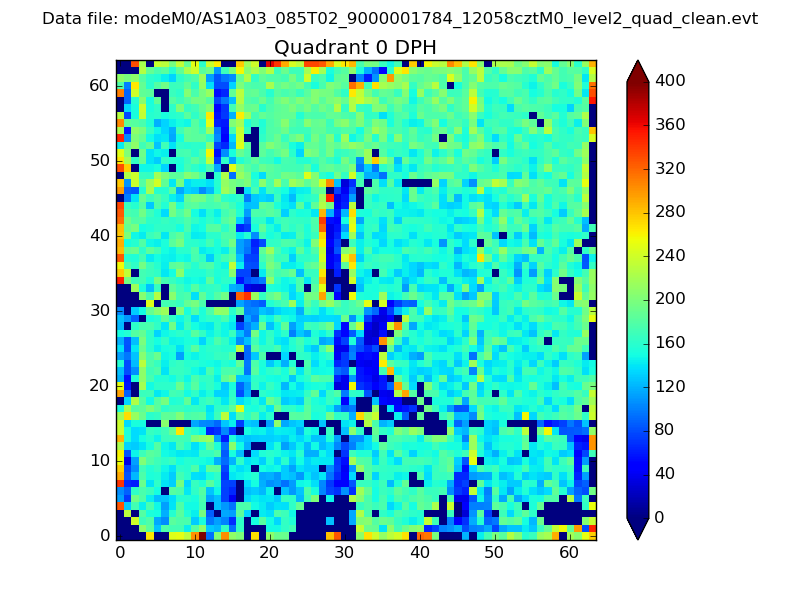 |
 |
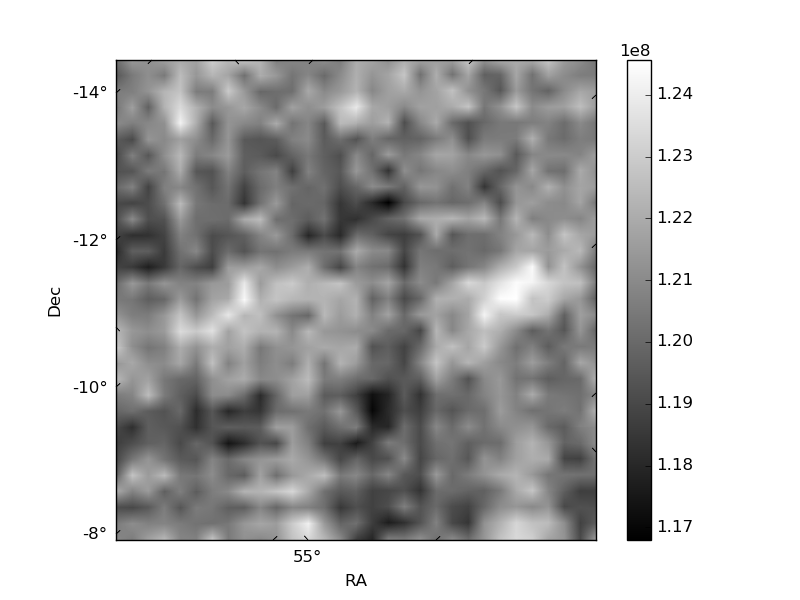
Quadrant B |
|---|---|---|---|
| Quadrant D | 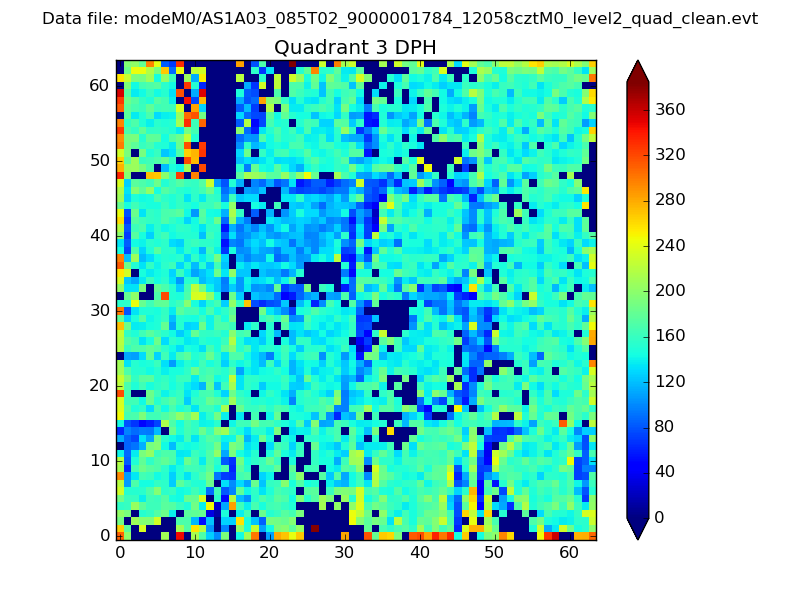 |
 |
Quadrant C |
| Plot type | Count rate plots | Images |
|---|---|---|
| Comparison with Poisson distribution Blue bars denote a histogram of data divided into 1 sec bins. Red curve is a Poisson curve with rate = median count rate of data. |
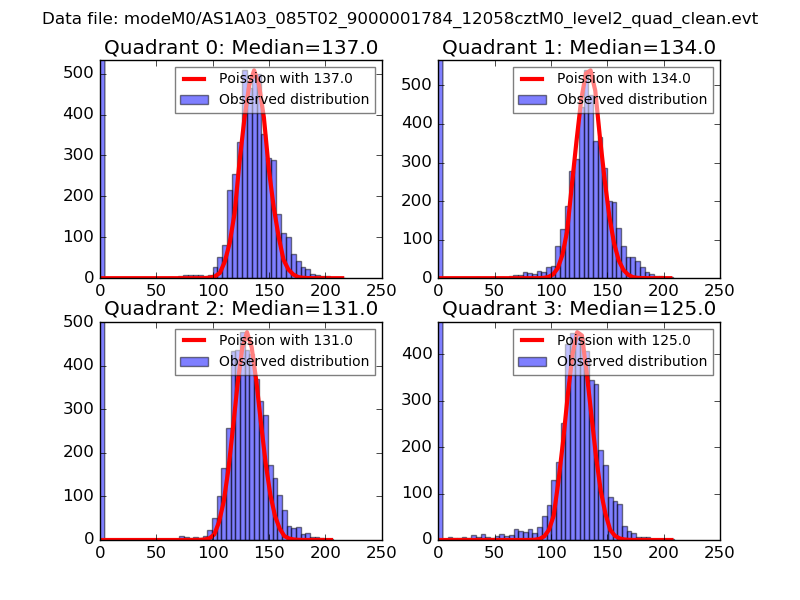 |
 |
| Quadrant-wise count rates Data is divided into 100 sec bins |
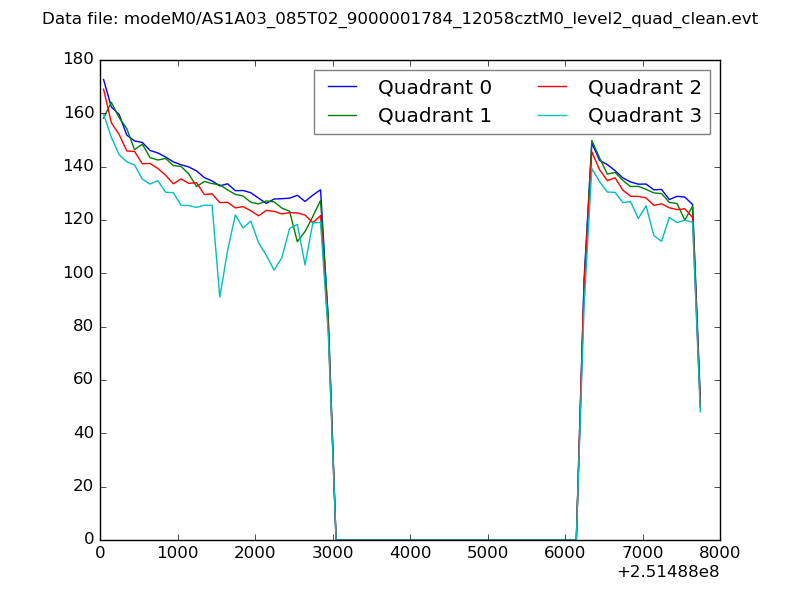 |
|
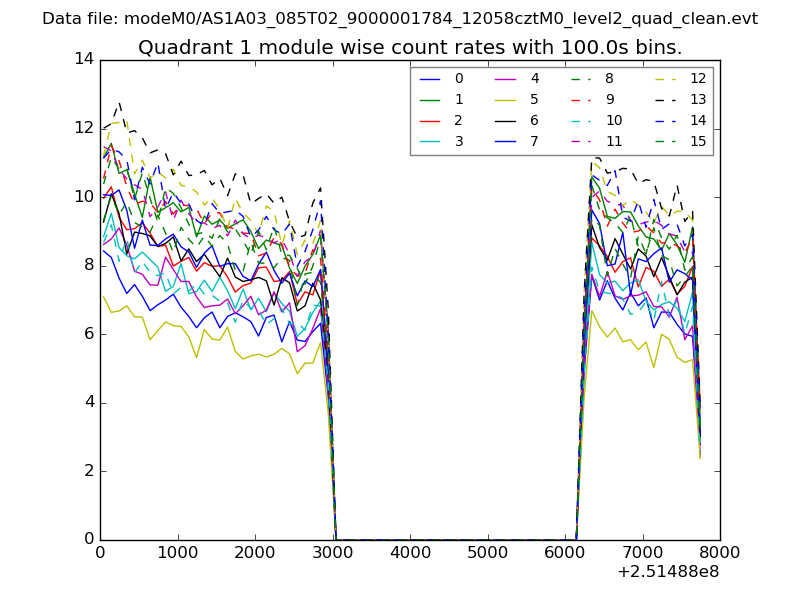
| Module-wise count rates for Quadrant A Data is divided into 100 sec bins |
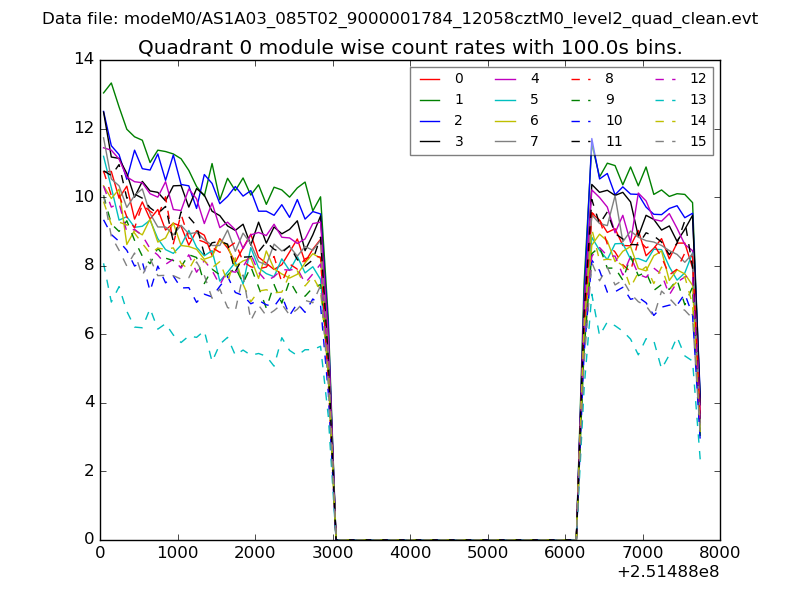 |
 |
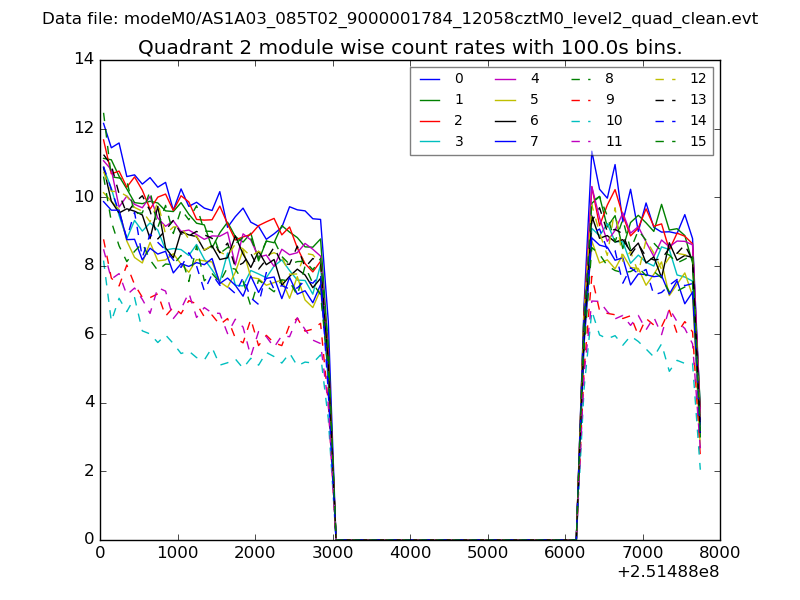
| Module-wise count rates for Quadrant B Data is divided into 100 sec bins |
 |
 |
| Module-wise count rates for Quadrant C Data is divided into 100 sec bins |
 |
 |
| Module-wise count rates for Quadrant D Data is divided into 100 sec bins |
 |
 |
| Parameter | Plot |
|---|---|
| CZT HV Monitor | 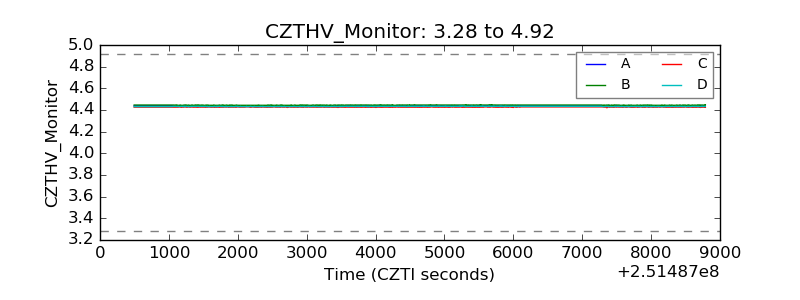 |
| D_VDD | 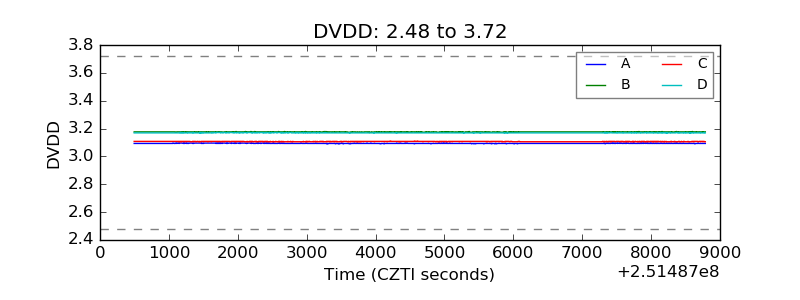 |
| Temperature 1 | 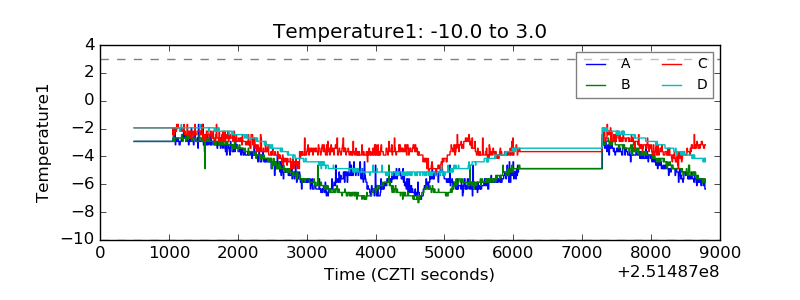 |
| Veto HV Monitor | 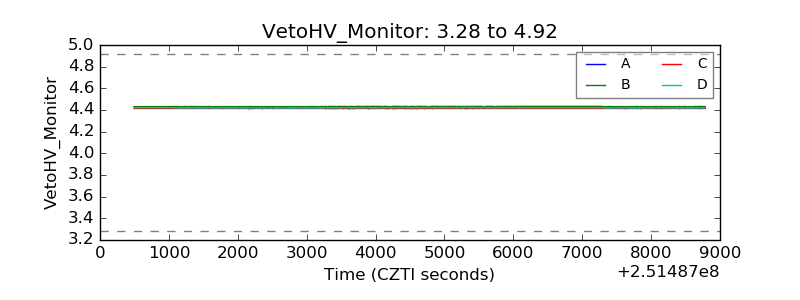 |
| Veto LLD | 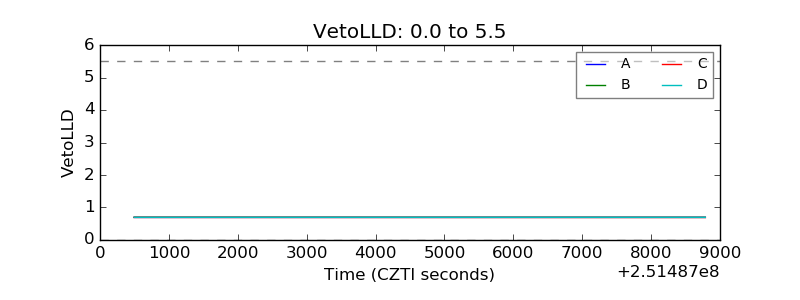 |
| Alpha Counter | 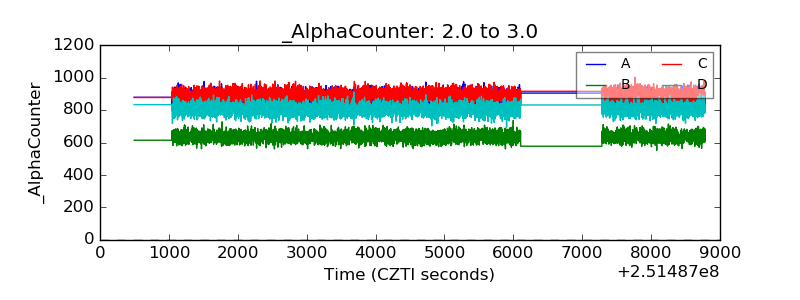 |
| _CPM_Rate | 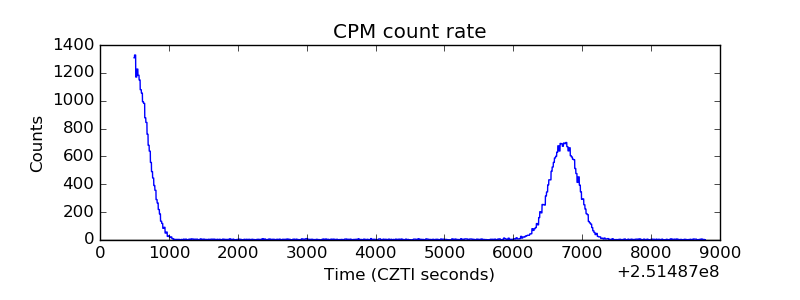 |
| CZT Counter | 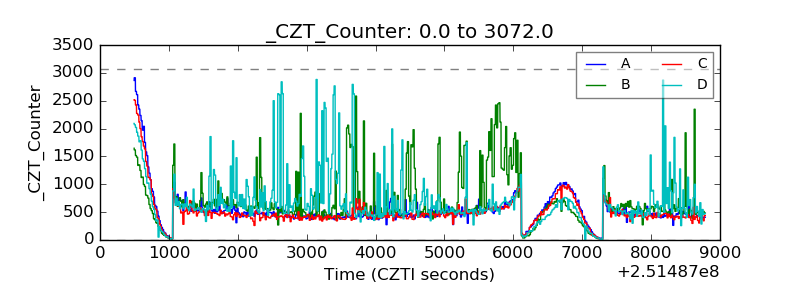 |
| +2.5 Volts monitor |  |
| +5 Volts monitor |  |
| _ROLL_ROT | 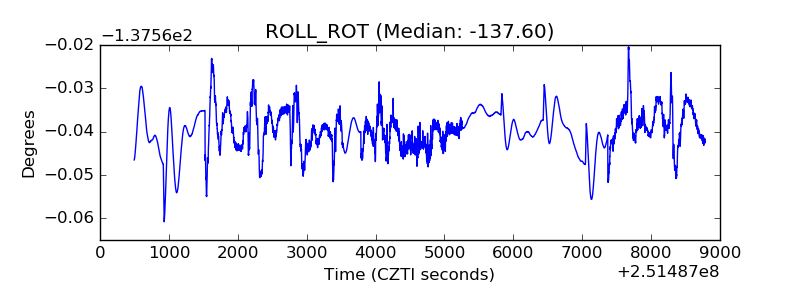 |
| _Roll_DEC | 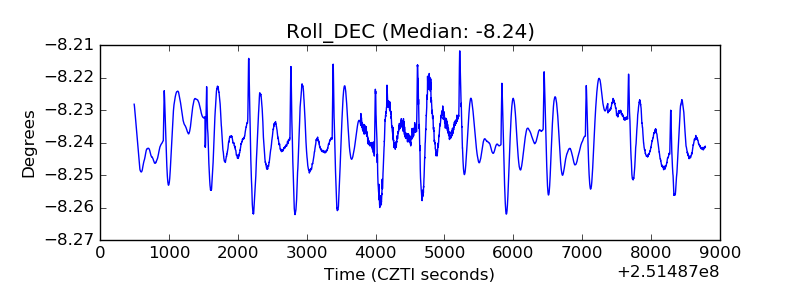 |
| _Roll_RA | 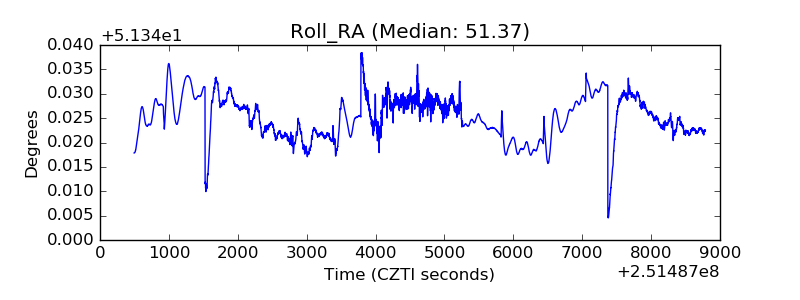 |
| Veto Counter | 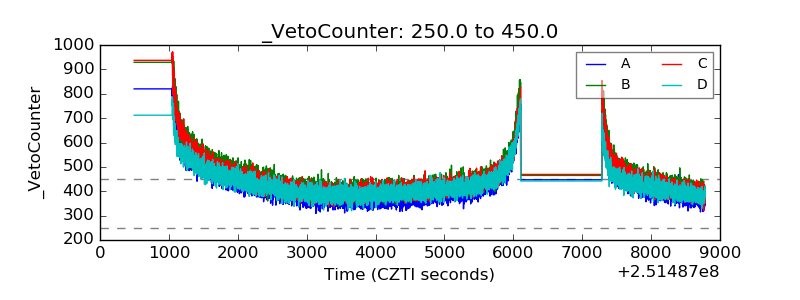 |