| Param | Original file | Final file |
|---|---|---|
| Filename | modeM0/AS1A03_085T02_9000001784_12059cztM0_level2.evt | modeM0/AS1A03_085T02_9000001784_12059cztM0_level2_quad_clean.evt |
| Size (bytes) | 515,151,360 | 88,179,840 |
| Size | 491.3 MB | 84.1 MB |
| Events in quadrant A | 3,287,776 | 568,798 |
| Events in quadrant B | 4,779,604 | 553,278 |
| Events in quadrant C | 3,021,093 | 553,253 |
| Events in quadrant D | 4,063,427 | 533,199 |
| Mode M9 | |||
|---|---|---|---|
| Quadrant | BADHDUFLAG | Total packets | Discarded packets |
| A | 0 | 10 | 0 |
| B | 0 | 10 | 0 |
| C | 0 | 10 | 0 |
| D | 0 | 11 | 0 |
| Mode SS | |||
|---|---|---|---|
| Quadrant | BADHDUFLAG | Total packets | Discarded packets |
| A | 0 | 134 | 0 |
| B | 0 | 134 | 0 |
| C | 0 | 134 | 0 |
| D | 0 | 134 | 0 |
| Mode M0 | |||
|---|---|---|---|
| Quadrant | BADHDUFLAG | Total packets | Discarded packets |
| A | 0 | 14197 | 3 |
| B | 0 | 18556 | 2 |
| C | 0 | 13607 | 2 |
| D | 0 | 16666 | 2 |
| Quadrant | Total seconds | Saturated seconds | Saturation percentage |
|---|---|---|---|
| A | 6624 | 75 | 1.132246% |
| B | 6624 | 489 | 7.382246% |
| C | 6624 | 12 | 0.181159% |
| D | 6624 | 133 | 2.007850% |
Noise dominated data is calculated using 1-second bins in cleaned event files. If a bin has >2000 counts, and if more than 50% of those come from <1% of pixels, then it is considered to be noise-dominated and hence unusable.
| Quadrant | # 1 sec bins | Bins with >0 counts | Bins with >2000 counts | High rate bins dominated by noise | Noise dominated (total time) | Noise dominated (detector-on time) | Marked lightcurve |
|---|---|---|---|---|---|---|---|
| A | 7550 | 6626 | 6 | 6 | 0.08% | 0.09% | 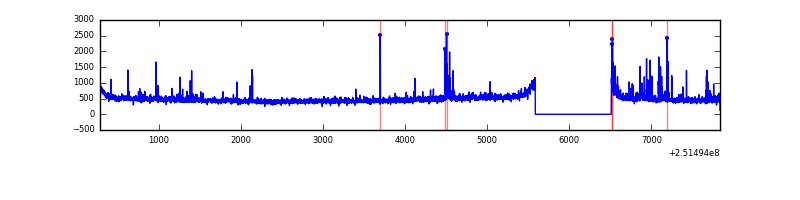 |
| B | 7550 | 6626 | 271 | 271 | 3.59% | 4.09% | 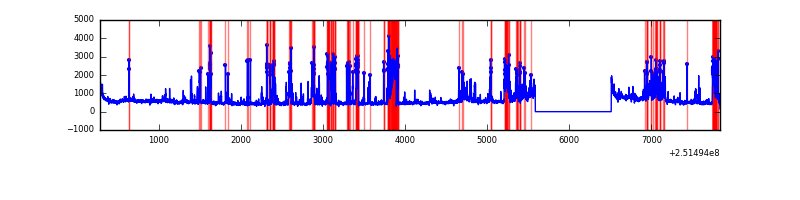 |
| C | 7550 | 6626 | 0 | 0 | 0.00% | 0.00% | 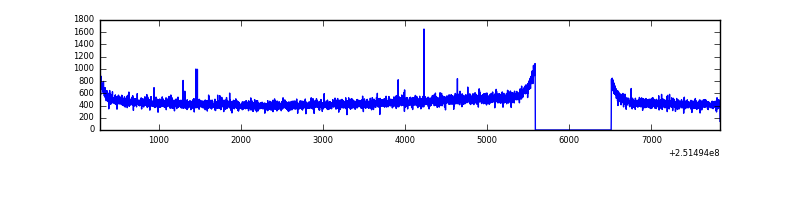 |
| D | 7550 | 6626 | 92 | 92 | 1.22% | 1.39% | 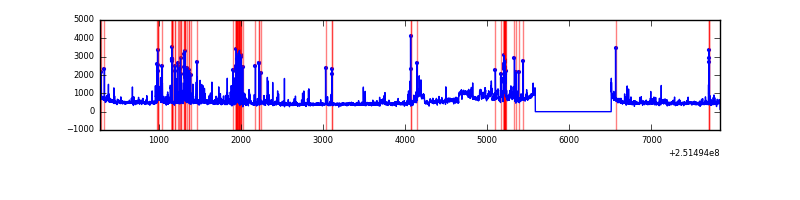 |
Top three noisy pixels from each quadrant. If the there are fewer than three noisy pixels in the level2.evt file, extra rows are filled as -1
| Pixel properties | Quadrant properties | ||||||
|---|---|---|---|---|---|---|---|
| Quadrant | DetID | PixID | Counts | Sigma | Mean | Median | Sigma |
| A | 5 | 16 | 55729 | 335.8 | 804 | 787 | 163.6 |
| A | 13 | 251 | 48279 | 290.27 | 804 | 787 | 163.6 |
| A | 1 | 162 | 36854 | 220.44 | 804 | 787 | 163.6 |
| B | 4 | 239 | 1316742 | 8703.87 | 788 | 769 | 151.2 |
| B | 4 | 206 | 252992 | 1668.2 | 788 | 769 | 151.2 |
| B | 15 | 204 | 61517 | 401.79 | 788 | 769 | 151.2 |
| C | 13 | 61 | 5665 | 27.09 | 773 | 779 | 180.4 |
| C | 14 | 234 | 5454 | 25.92 | 773 | 779 | 180.4 |
| C | 7 | 247 | 2468 | 9.36 | 773 | 779 | 180.4 |
| D | 1 | 52 | 970276 | 5248.11 | 765 | 743 | 184.7 |
| D | 8 | 195 | 104132 | 559.65 | 765 | 743 | 184.7 |
| D | 13 | 249 | 42308 | 224.99 | 765 | 743 | 184.7 |
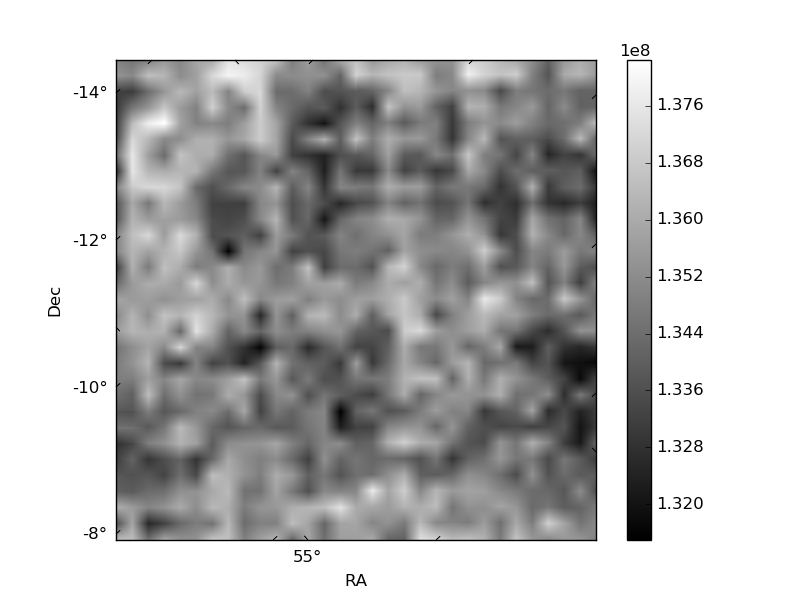
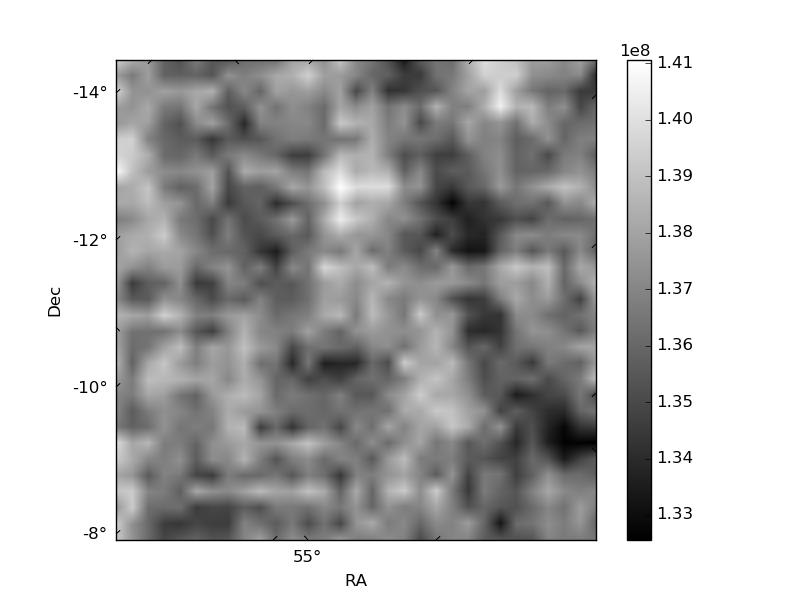
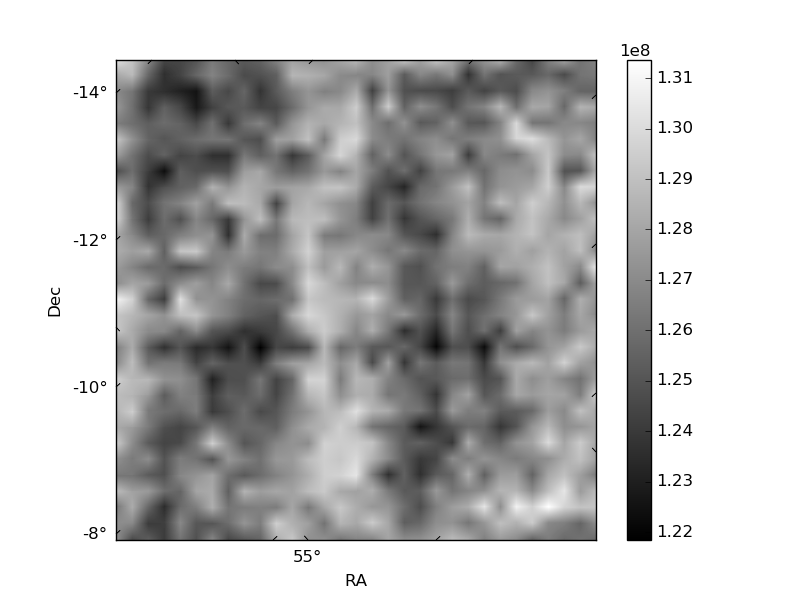
Histogram calculated using DETX and DETY for each event in the final _common_clean file
| Quadrant A | 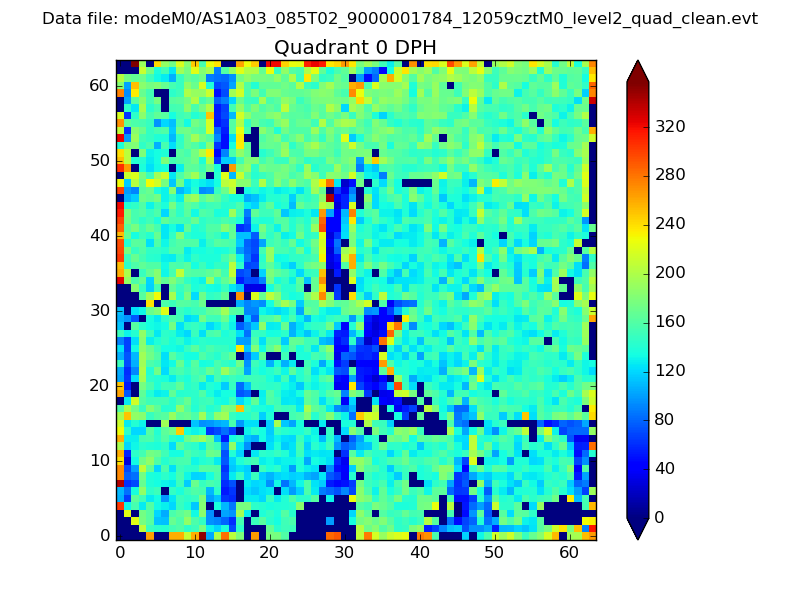 |
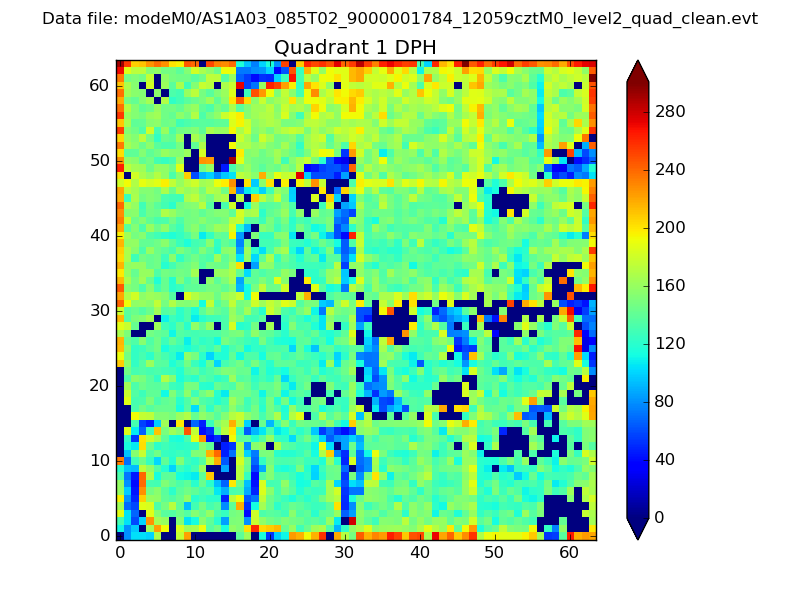 |
Quadrant B |
|---|---|---|---|
| Quadrant D | 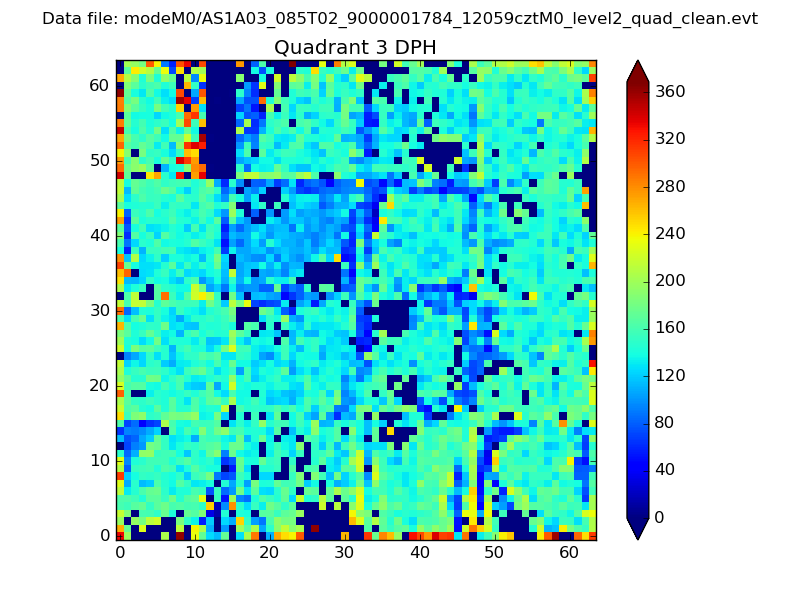 |
 |
Quadrant C |
| Plot type | Count rate plots | Images |
|---|---|---|
| Comparison with Poisson distribution Blue bars denote a histogram of data divided into 1 sec bins. Red curve is a Poisson curve with rate = median count rate of data. |
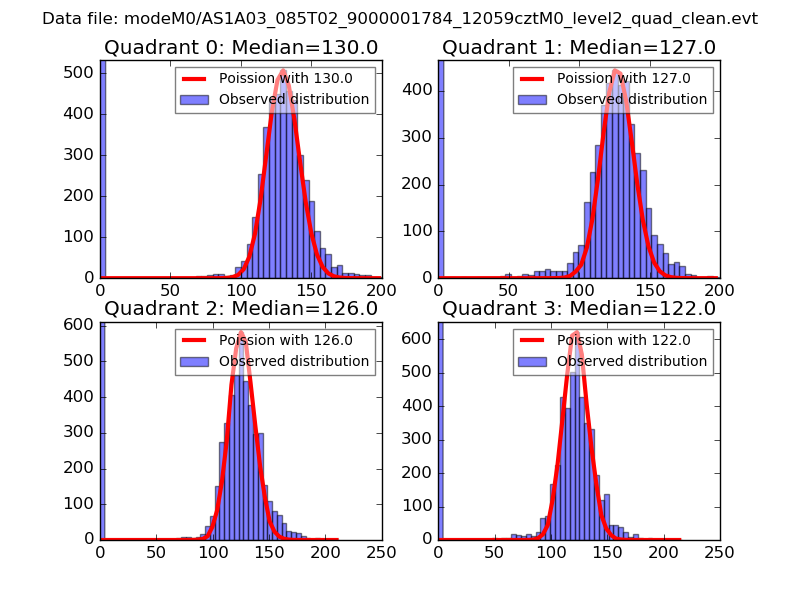 |
 |
| Quadrant-wise count rates Data is divided into 100 sec bins |
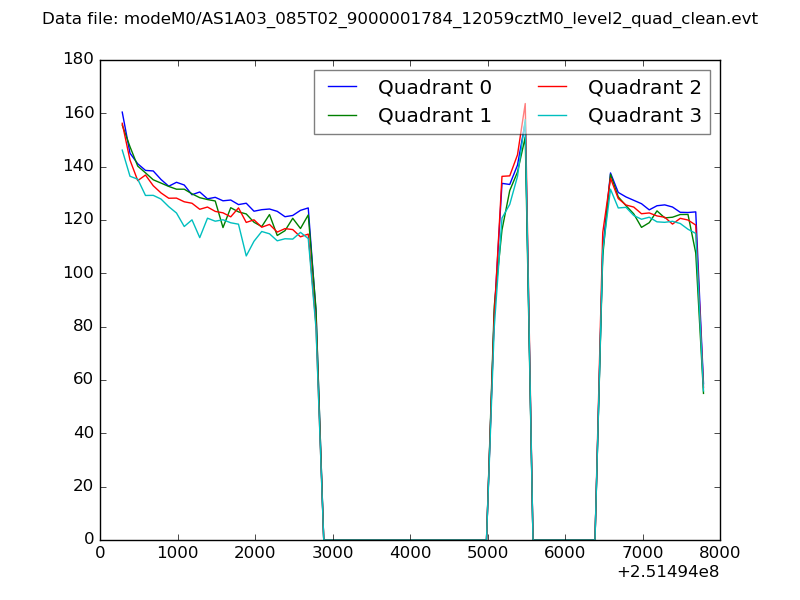 |
|
| Module-wise count rates for Quadrant A Data is divided into 100 sec bins |
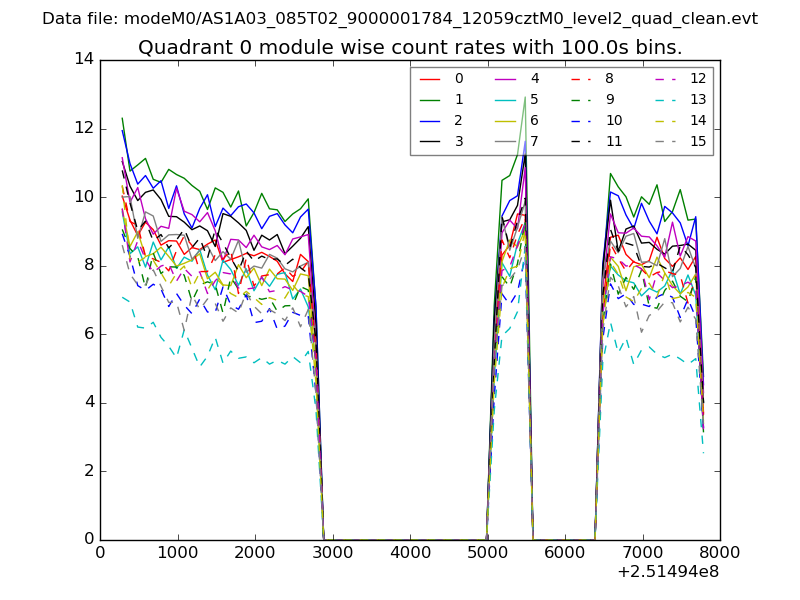 |
 |
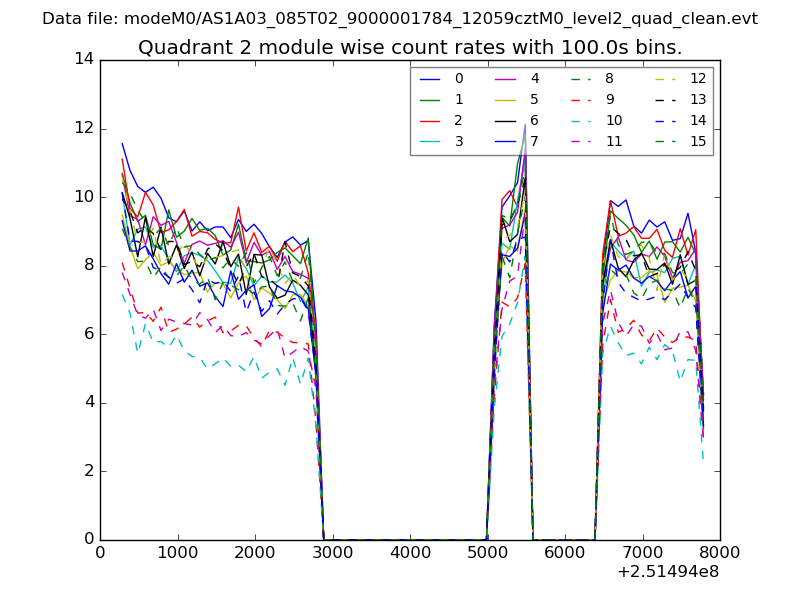
| Module-wise count rates for Quadrant B Data is divided into 100 sec bins |
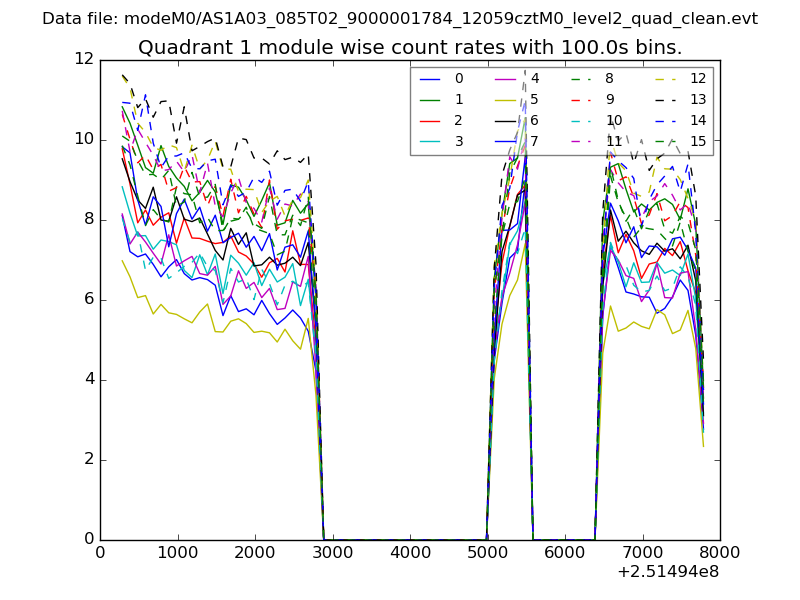 |
 |
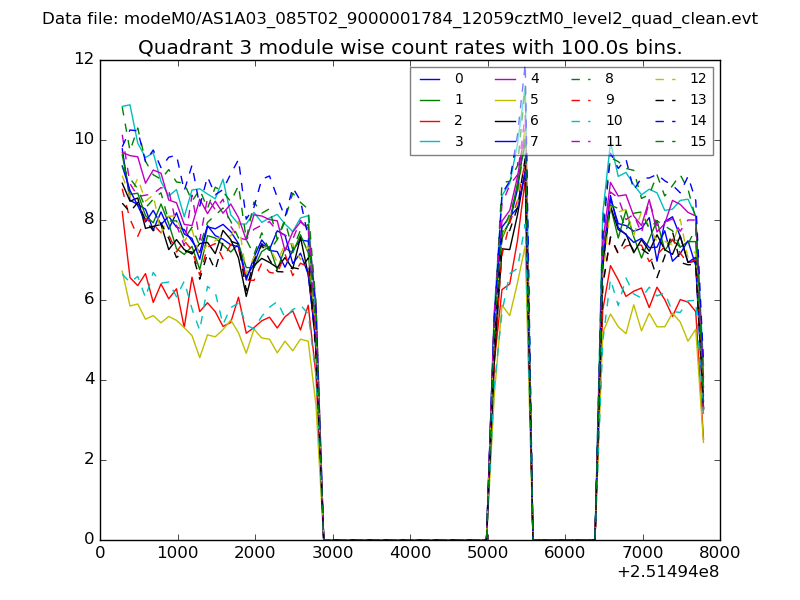
| Module-wise count rates for Quadrant C Data is divided into 100 sec bins |
 |
 |
| Module-wise count rates for Quadrant D Data is divided into 100 sec bins |
 |
 |
| Parameter | Plot |
|---|---|
| CZT HV Monitor | 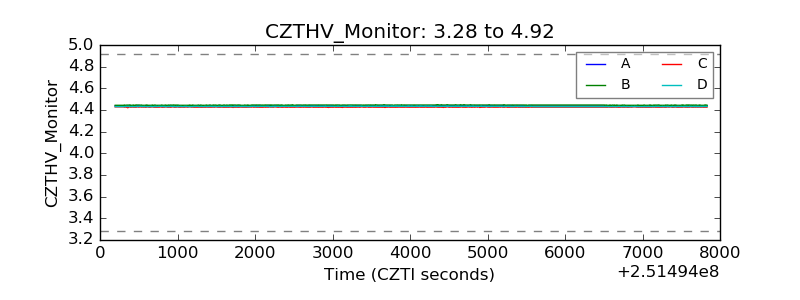 |
| D_VDD | 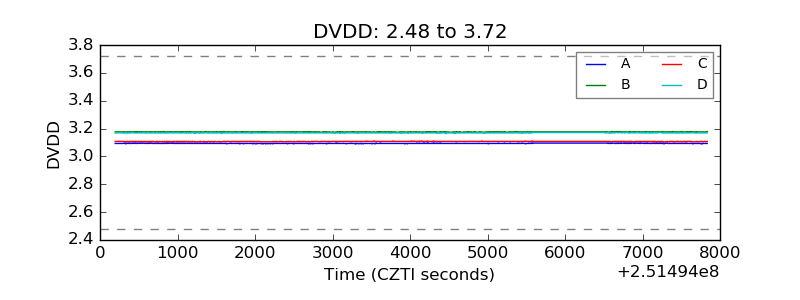 |
| Temperature 1 | 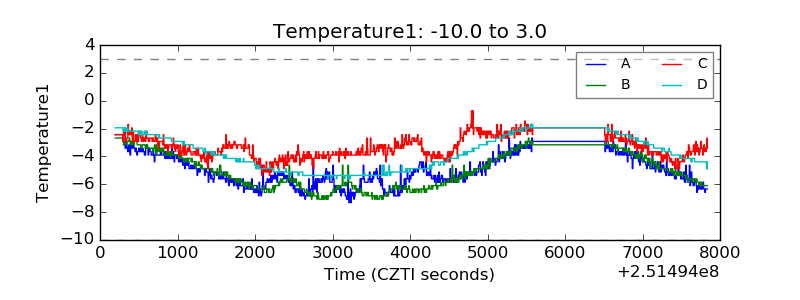 |
| Veto HV Monitor |  |
| Veto LLD | 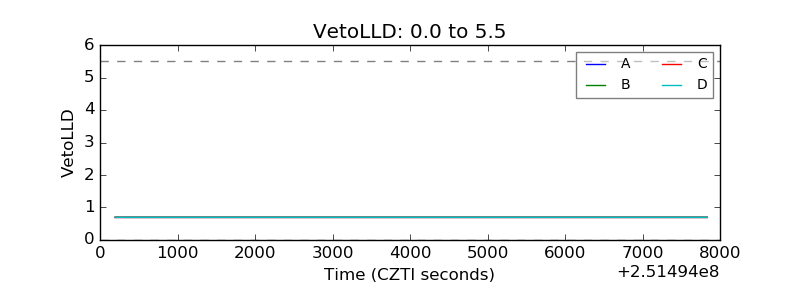 |
| Alpha Counter | 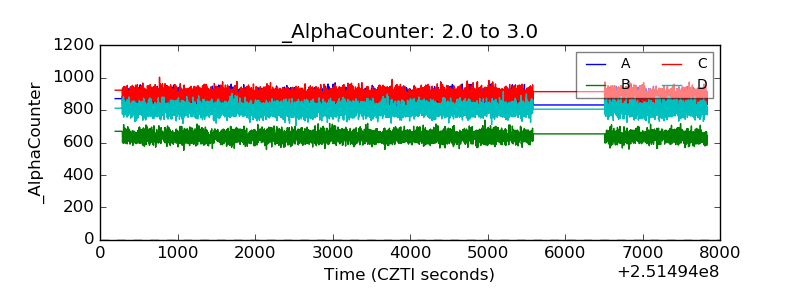 |
| _CPM_Rate | 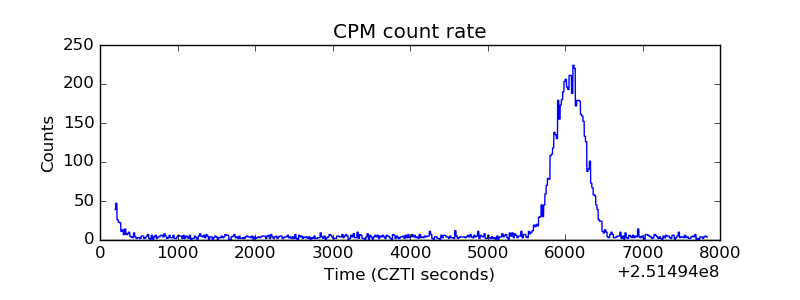 |
| CZT Counter | 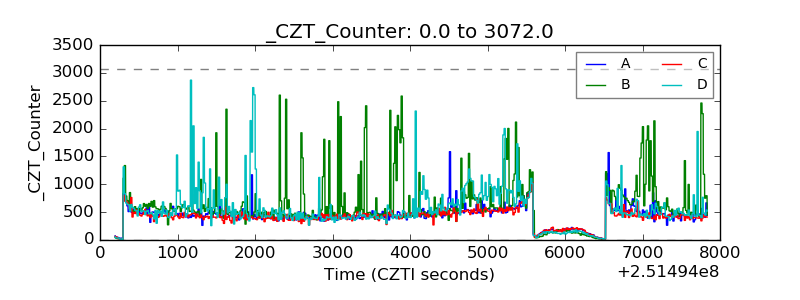 |
| +2.5 Volts monitor |  |
| +5 Volts monitor |  |
| _ROLL_ROT | 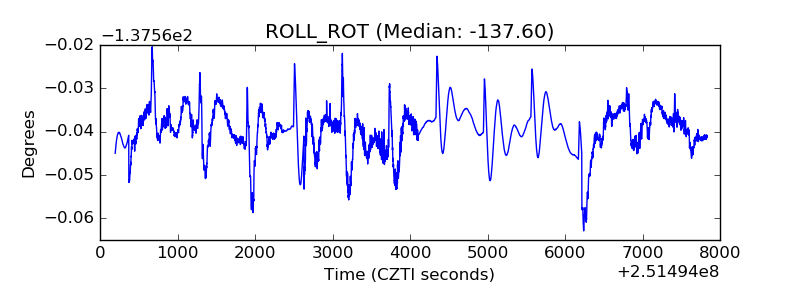 |
| _Roll_DEC | 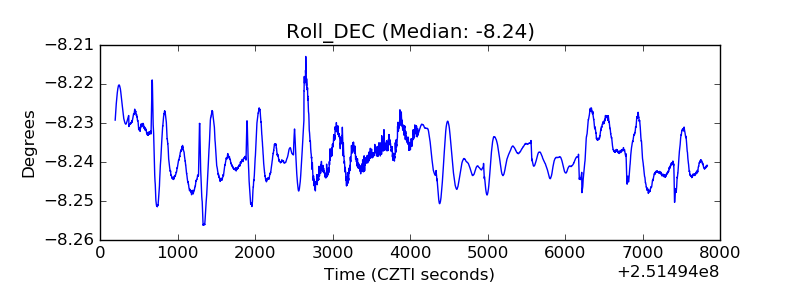 |
| _Roll_RA |  |
| Veto Counter | 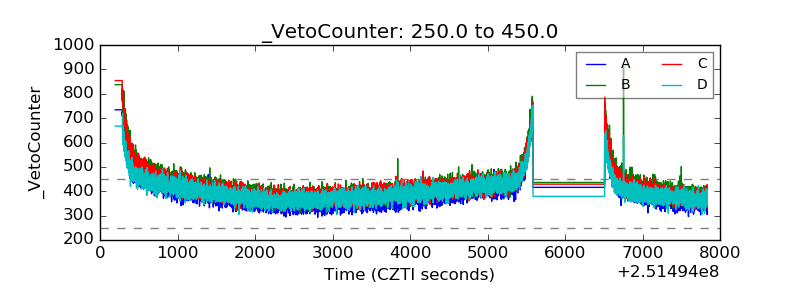 |