| Param | Original file | Final file |
|---|---|---|
| Filename | modeM0/AS1A03_085T02_9000001784_12060cztM0_level2.evt | modeM0/AS1A03_085T02_9000001784_12060cztM0_level2_quad_clean.evt |
| Size (bytes) | 548,902,080 | 97,067,520 |
| Size | 523.5 MB | 92.6 MB |
| Events in quadrant A | 3,541,098 | 628,447 |
| Events in quadrant B | 5,230,797 | 602,905 |
| Events in quadrant C | 3,253,223 | 613,187 |
| Events in quadrant D | 4,107,348 | 591,015 |
| Mode M9 | |||
|---|---|---|---|
| Quadrant | BADHDUFLAG | Total packets | Discarded packets |
| A | 0 | 12 | 0 |
| B | 0 | 12 | 0 |
| C | 0 | 12 | 0 |
| D | 0 | 13 | 0 |
| Mode SS | |||
|---|---|---|---|
| Quadrant | BADHDUFLAG | Total packets | Discarded packets |
| A | 0 | 146 | 0 |
| B | 0 | 146 | 0 |
| C | 0 | 146 | 0 |
| D | 0 | 146 | 0 |
| Mode M0 | |||
|---|---|---|---|
| Quadrant | BADHDUFLAG | Total packets | Discarded packets |
| A | 0 | 15411 | 3 |
| B | 0 | 20436 | 2 |
| C | 0 | 14756 | 2 |
| D | 0 | 17091 | 2 |
| Quadrant | Total seconds | Saturated seconds | Saturation percentage |
|---|---|---|---|
| A | 7238 | 67 | 0.925670% |
| B | 7238 | 498 | 6.880354% |
| C | 7238 | 18 | 0.248687% |
| D | 7238 | 182 | 2.514507% |
Noise dominated data is calculated using 1-second bins in cleaned event files. If a bin has >2000 counts, and if more than 50% of those come from <1% of pixels, then it is considered to be noise-dominated and hence unusable.
| Quadrant | # 1 sec bins | Bins with >0 counts | Bins with >2000 counts | High rate bins dominated by noise | Noise dominated (total time) | Noise dominated (detector-on time) | Marked lightcurve |
|---|---|---|---|---|---|---|---|
| A | 7764 | 7240 | 6 | 6 | 0.08% | 0.08% | 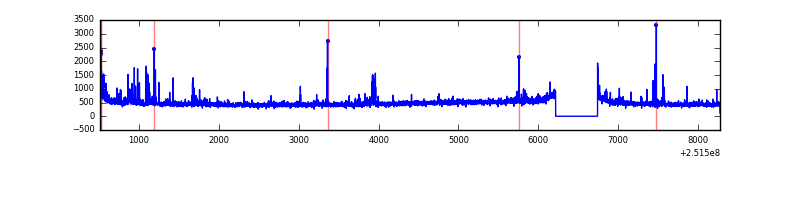 |
| B | 7764 | 7240 | 268 | 268 | 3.45% | 3.70% | 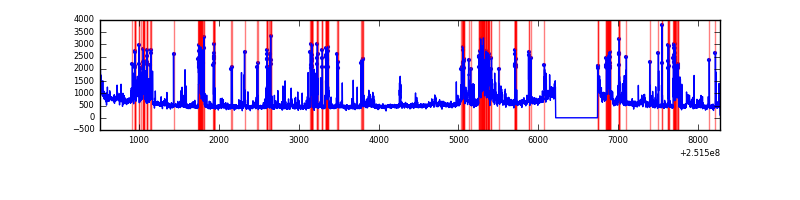 |
| C | 7764 | 7240 | 0 | 0 | 0.00% | 0.00% |  |
| D | 7764 | 7240 | 136 | 136 | 1.75% | 1.88% | 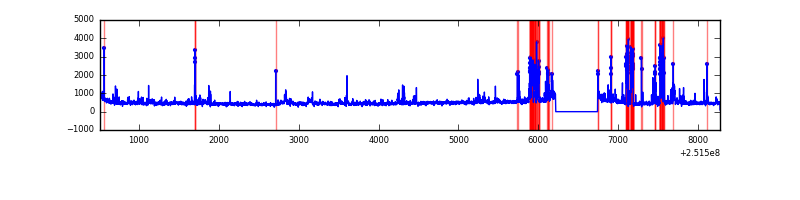 |
Top three noisy pixels from each quadrant. If the there are fewer than three noisy pixels in the level2.evt file, extra rows are filled as -1
| Pixel properties | Quadrant properties | ||||||
|---|---|---|---|---|---|---|---|
| Quadrant | DetID | PixID | Counts | Sigma | Mean | Median | Sigma |
| A | 5 | 16 | 63588 | 357.56 | 859 | 842 | 175.5 |
| A | 1 | 162 | 57042 | 320.26 | 859 | 842 | 175.5 |
| A | 13 | 251 | 36889 | 205.42 | 859 | 842 | 175.5 |
| B | 4 | 239 | 1052831 | 6445.18 | 844 | 823 | 163.2 |
| B | 0 | 85 | 362021 | 2212.9 | 844 | 823 | 163.2 |
| B | 4 | 206 | 296970 | 1814.36 | 844 | 823 | 163.2 |
| C | 8 | 128 | 6937 | 31.74 | 830 | 835 | 192.2 |
| C | 13 | 61 | 5998 | 26.86 | 830 | 835 | 192.2 |
| C | 8 | 112 | 3842 | 15.64 | 830 | 835 | 192.2 |
| D | 1 | 52 | 856059 | 4295.19 | 824 | 800 | 199.1 |
| D | 8 | 195 | 76267 | 379.0 | 824 | 800 | 199.1 |
| D | 10 | 50 | 32550 | 159.45 | 824 | 800 | 199.1 |
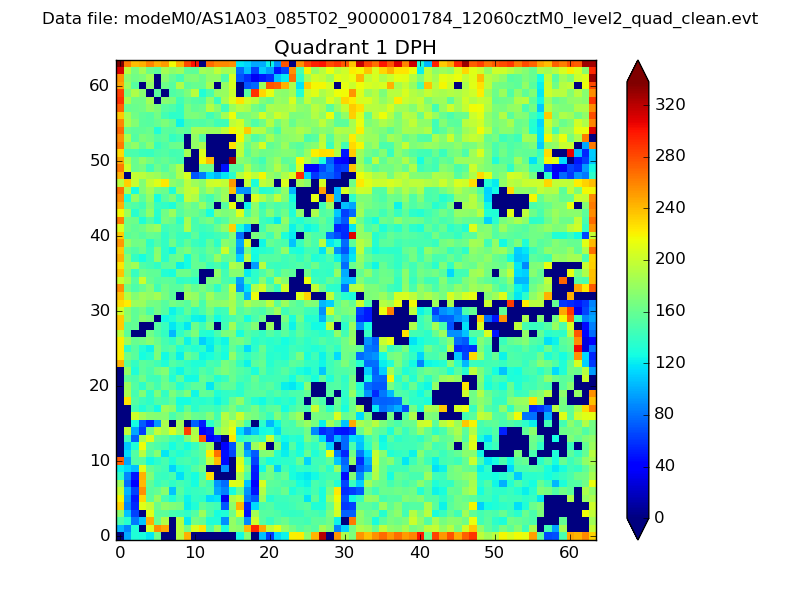
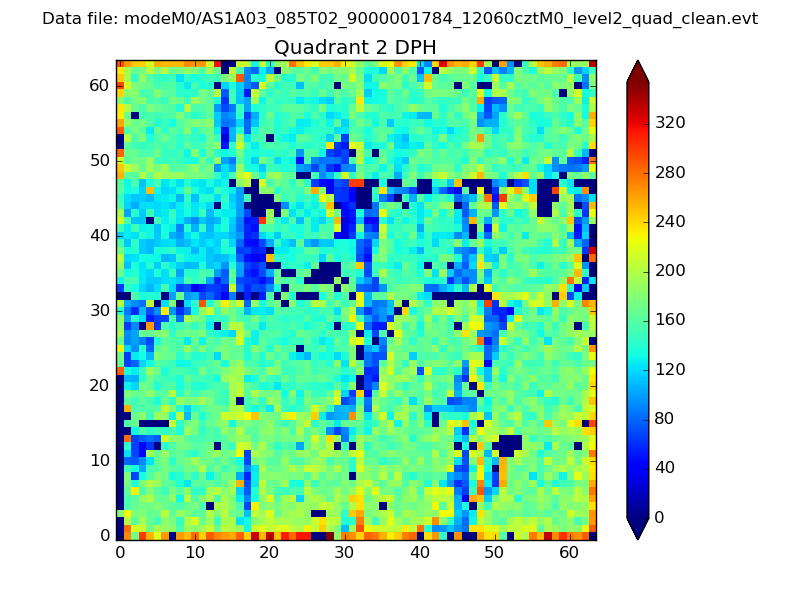
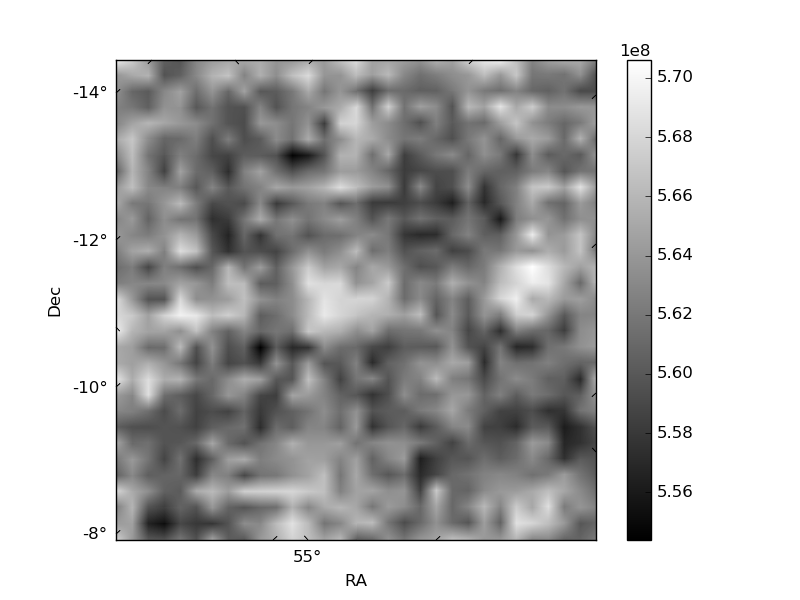
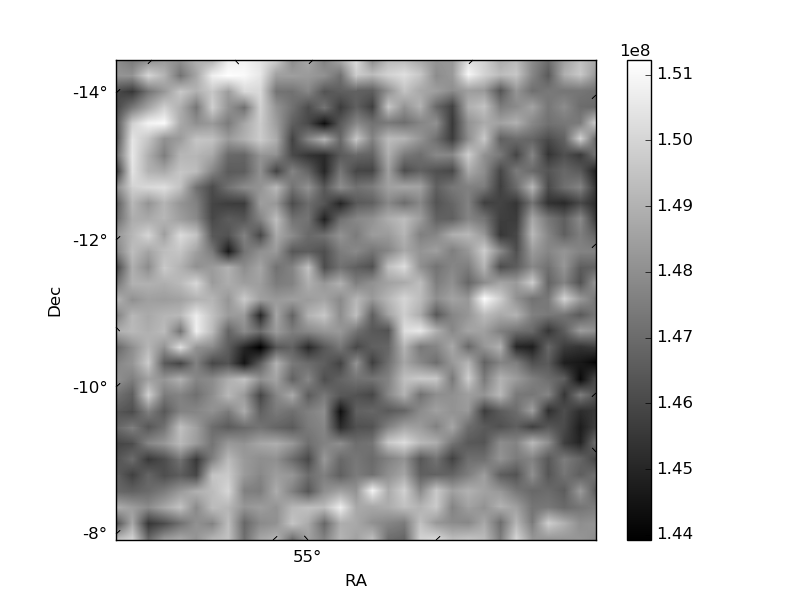
Histogram calculated using DETX and DETY for each event in the final _common_clean file
| Quadrant A | 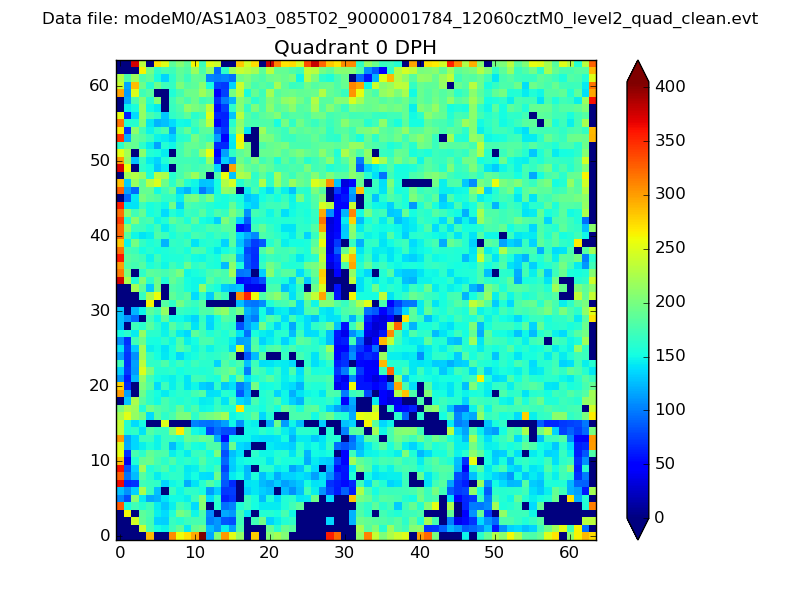 |
 |
Quadrant B |
|---|---|---|---|
| Quadrant D | 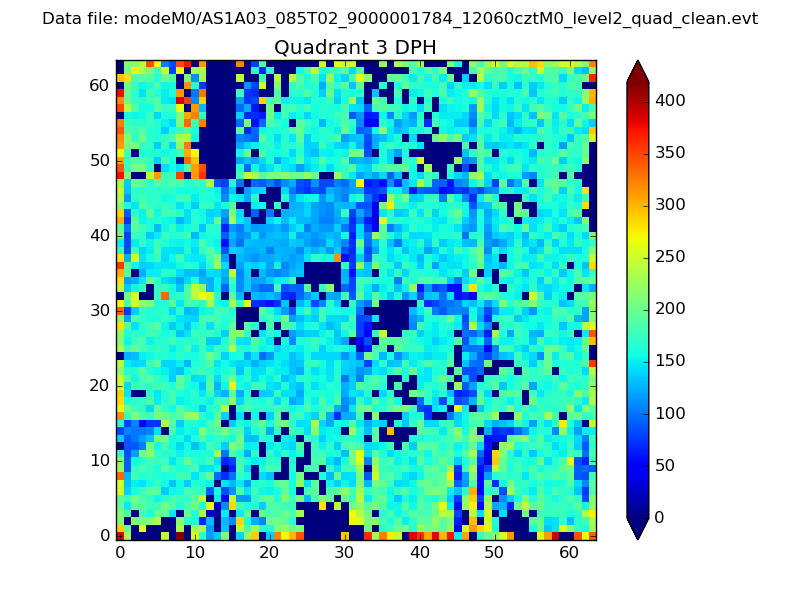 |
 |
Quadrant C |
| Plot type | Count rate plots | Images |
|---|---|---|
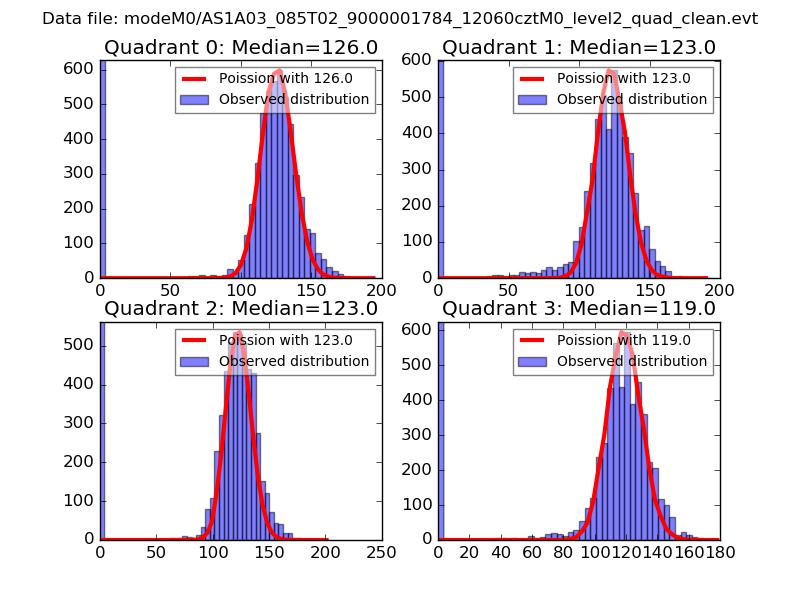
| Comparison with Poisson distribution Blue bars denote a histogram of data divided into 1 sec bins. Red curve is a Poisson curve with rate = median count rate of data. |
 |
 |
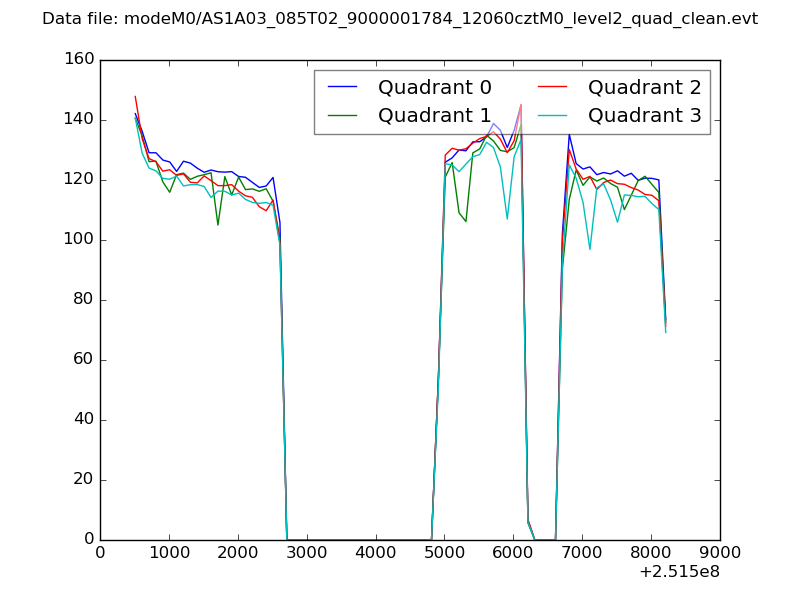
| Quadrant-wise count rates Data is divided into 100 sec bins |
 |
|
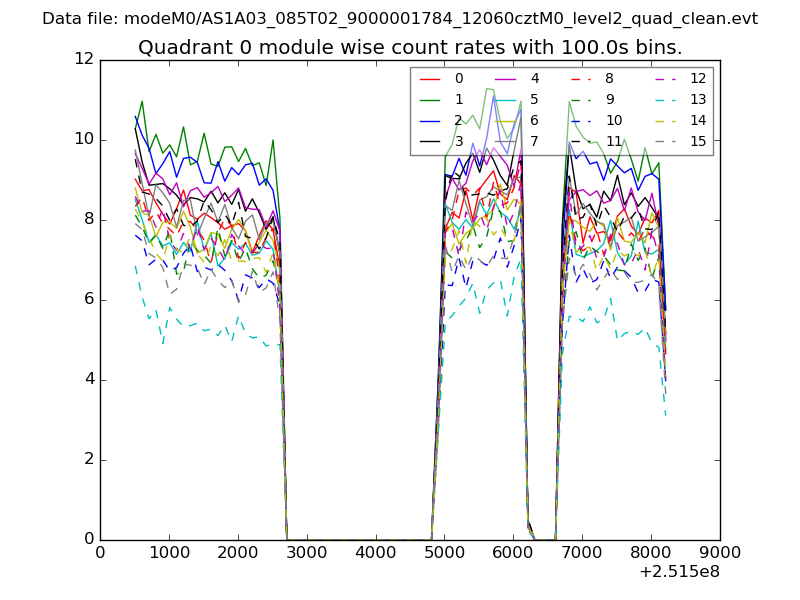
| Module-wise count rates for Quadrant A Data is divided into 100 sec bins |
 |
 |
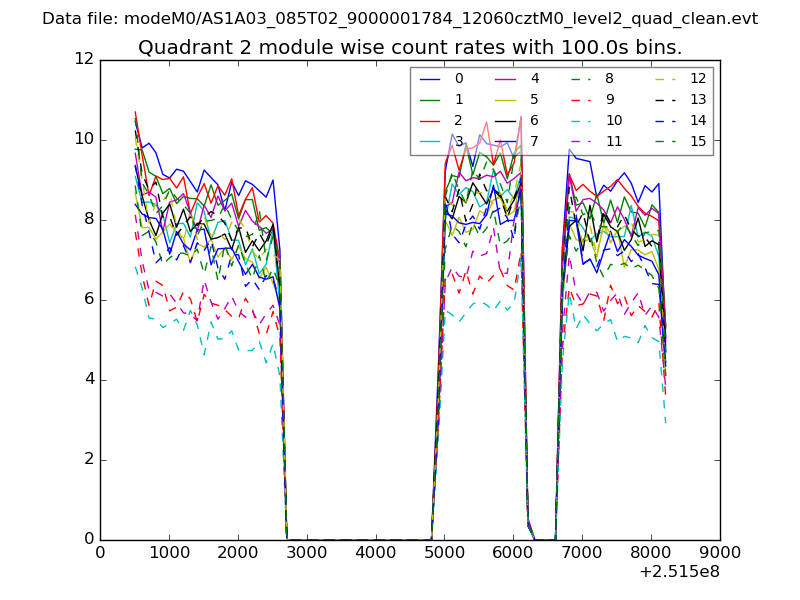
| Module-wise count rates for Quadrant B Data is divided into 100 sec bins |
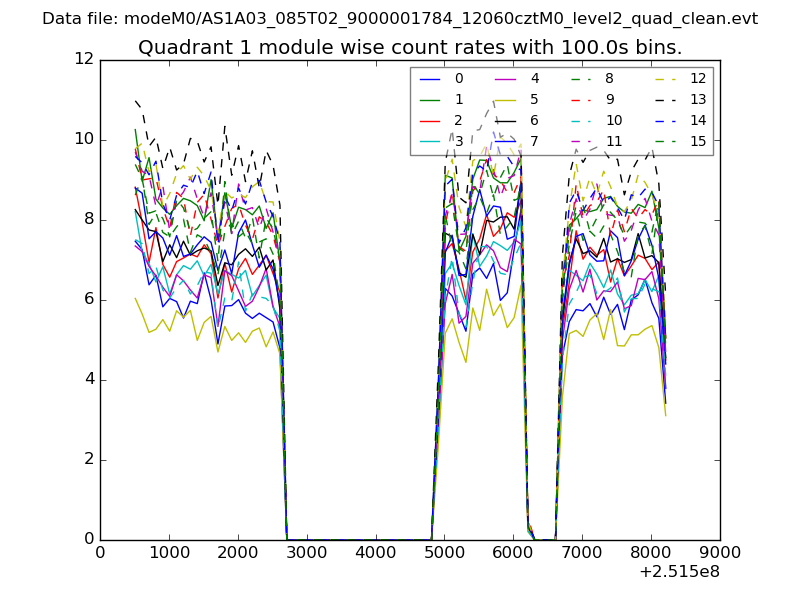 |
 |
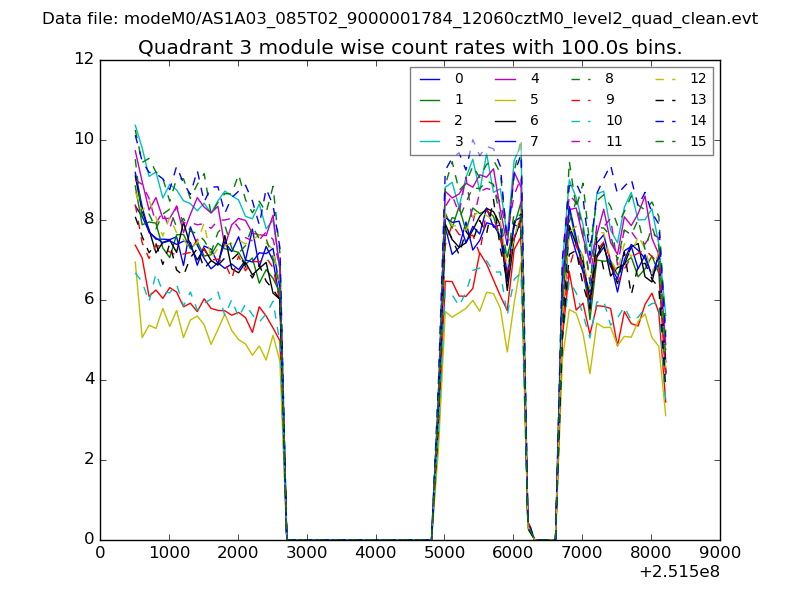
| Module-wise count rates for Quadrant C Data is divided into 100 sec bins |
 |
 |
| Module-wise count rates for Quadrant D Data is divided into 100 sec bins |
 |
 |
| Parameter | Plot |
|---|---|
| CZT HV Monitor | 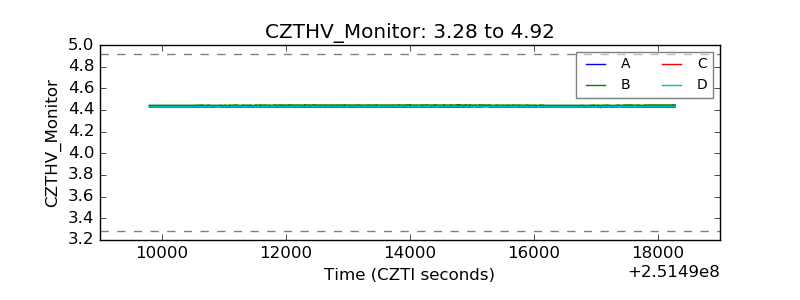 |
| D_VDD | 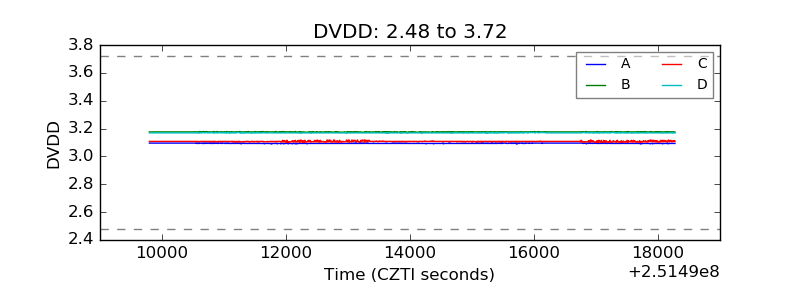 |
| Temperature 1 | 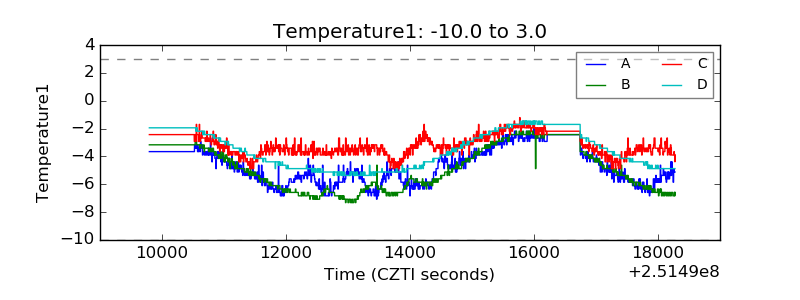 |
| Veto HV Monitor | 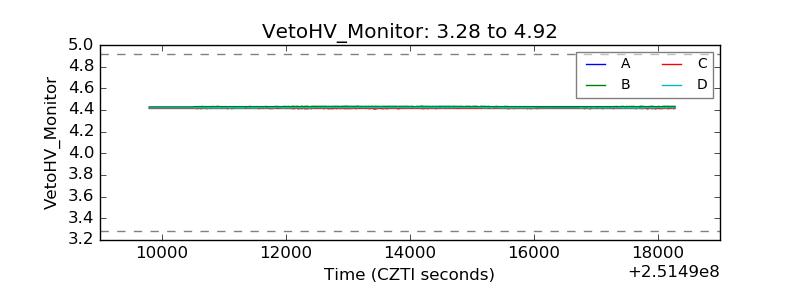 |
| Veto LLD | 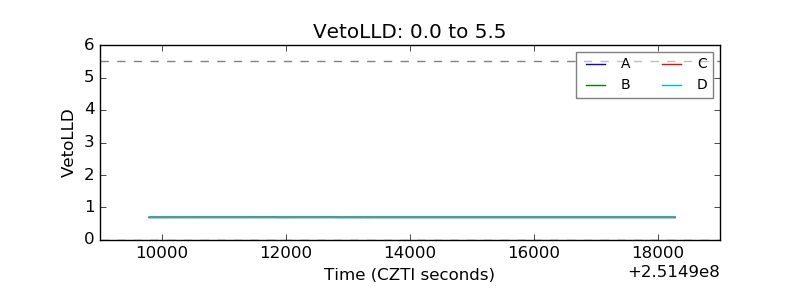 |
| Alpha Counter | 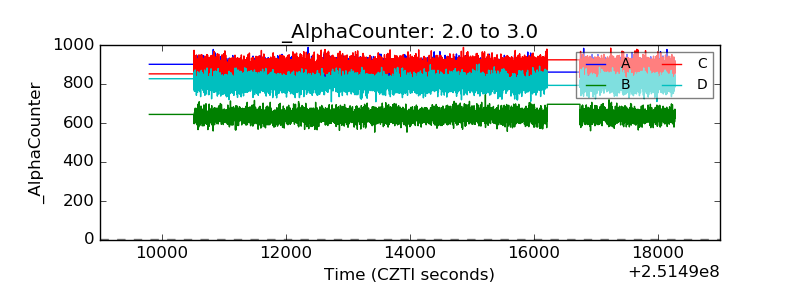 |
| _CPM_Rate | 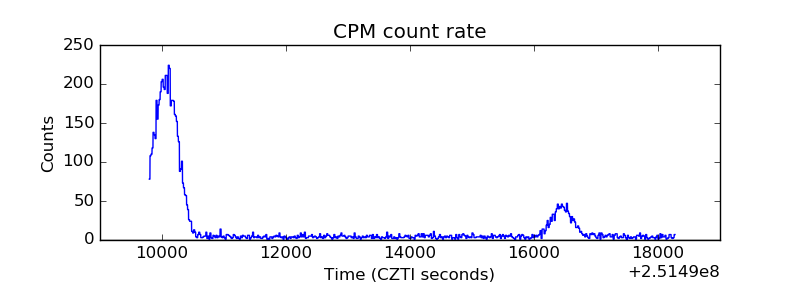 |
| CZT Counter | 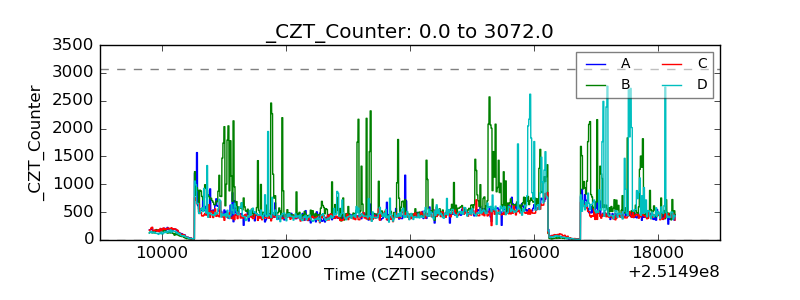 |
| +2.5 Volts monitor | 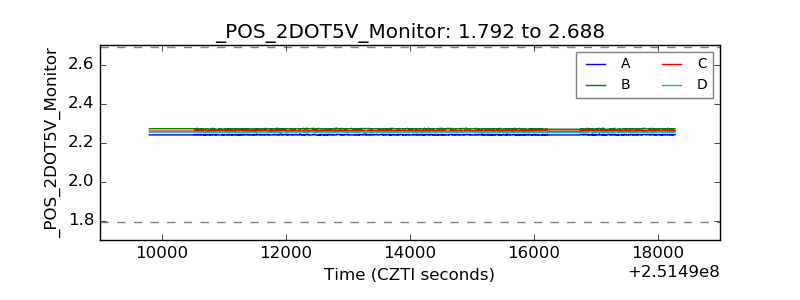 |
| +5 Volts monitor |  |
| _ROLL_ROT |  |
| _Roll_DEC | 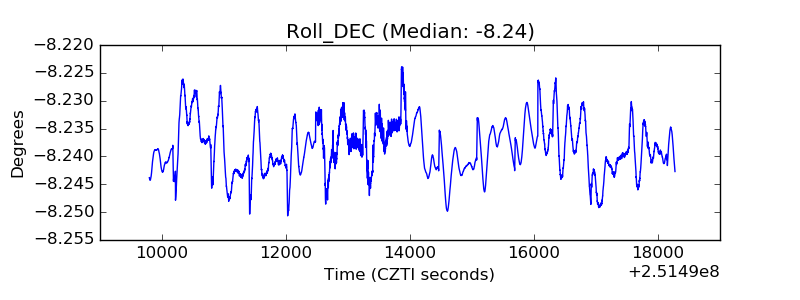 |
| _Roll_RA | 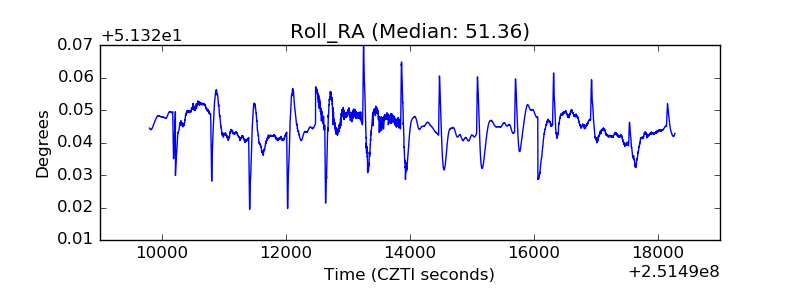 |
| Veto Counter | 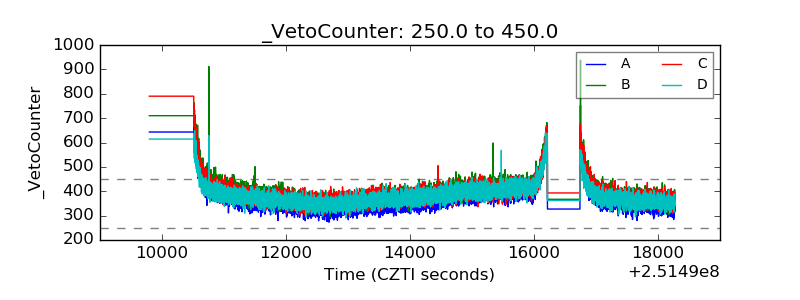 |