| Param | Original file | Final file |
|---|---|---|
| Filename | modeM0/AS1A03_085T02_9000001784_12062cztM0_level2.evt | modeM0/AS1A03_085T02_9000001784_12062cztM0_level2_quad_clean.evt |
| Size (bytes) | 693,930,240 | 106,312,320 |
| Size | 661.8 MB | 101.4 MB |
| Events in quadrant A | 3,858,406 | 709,584 |
| Events in quadrant B | 5,447,651 | 688,848 |
| Events in quadrant C | 3,604,455 | 692,631 |
| Events in quadrant D | 7,572,663 | 581,163 |
| Mode M9 | |||
|---|---|---|---|
| Quadrant | BADHDUFLAG | Total packets | Discarded packets |
| A | 0 | 7 | 0 |
| B | 0 | 7 | 0 |
| C | 0 | 7 | 0 |
| D | 0 | 7 | 0 |
| Mode SS | |||
|---|---|---|---|
| Quadrant | BADHDUFLAG | Total packets | Discarded packets |
| A | 0 | 162 | 0 |
| B | 0 | 162 | 0 |
| C | 0 | 162 | 0 |
| D | 0 | 162 | 0 |
| Mode M0 | |||
|---|---|---|---|
| Quadrant | BADHDUFLAG | Total packets | Discarded packets |
| A | 0 | 16675 | 2 |
| B | 0 | 21503 | 2 |
| C | 0 | 16150 | 2 |
| D | 0 | 27878 | 2 |
| Quadrant | Total seconds | Saturated seconds | Saturation percentage |
|---|---|---|---|
| A | 7860 | 70 | 0.890585% |
| B | 7860 | 468 | 5.954198% |
| C | 7860 | 41 | 0.521628% |
| D | 7860 | 1465 | 18.638677% |
Noise dominated data is calculated using 1-second bins in cleaned event files. If a bin has >2000 counts, and if more than 50% of those come from <1% of pixels, then it is considered to be noise-dominated and hence unusable.
| Quadrant | # 1 sec bins | Bins with >0 counts | Bins with >2000 counts | High rate bins dominated by noise | Noise dominated (total time) | Noise dominated (detector-on time) | Marked lightcurve |
|---|---|---|---|---|---|---|---|
| A | 8626 | 7863 | 3 | 3 | 0.03% | 0.04% | 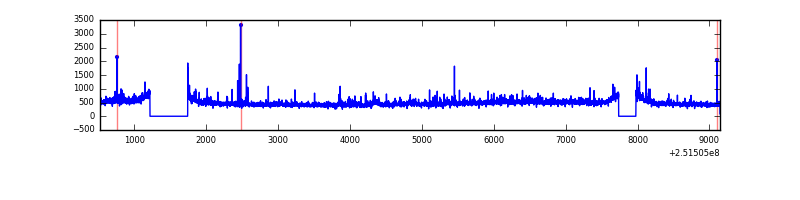 |
| B | 8626 | 7863 | 205 | 205 | 2.38% | 2.61% | 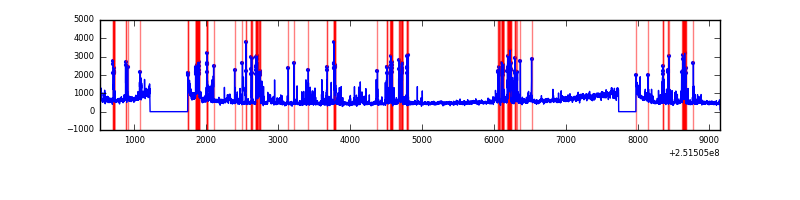 |
| C | 8626 | 7863 | 0 | 0 | 0.00% | 0.00% | 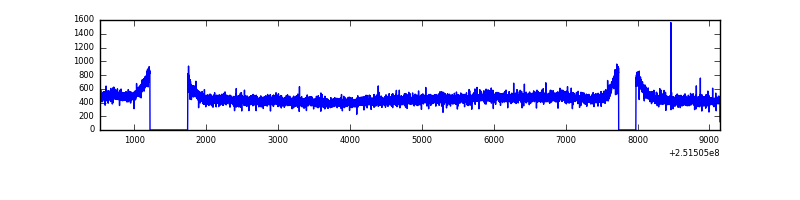 |
| D | 8626 | 7863 | 1280 | 1280 | 14.84% | 16.28% |  |
Top three noisy pixels from each quadrant. If the there are fewer than three noisy pixels in the level2.evt file, extra rows are filled as -1
| Pixel properties | Quadrant properties | ||||||
|---|---|---|---|---|---|---|---|
| Quadrant | DetID | PixID | Counts | Sigma | Mean | Median | Sigma |
| A | 1 | 162 | 58633 | 296.13 | 952 | 930 | 194.9 |
| A | 13 | 251 | 28923 | 143.66 | 952 | 930 | 194.9 |
| A | 1 | 178 | 22923 | 112.87 | 952 | 930 | 194.9 |
| B | 4 | 239 | 843409 | 4647.67 | 935 | 911 | 181.3 |
| B | 4 | 206 | 375887 | 2068.57 | 935 | 911 | 181.3 |
| B | 0 | 85 | 234080 | 1286.28 | 935 | 911 | 181.3 |
| C | 8 | 128 | 12641 | 54.89 | 917 | 920 | 213.5 |
| C | 13 | 61 | 6768 | 27.39 | 917 | 920 | 213.5 |
| C | 8 | 112 | 6702 | 27.08 | 917 | 920 | 213.5 |
| D | 1 | 52 | 4187923 | 21121.89 | 829 | 806 | 198.2 |
| D | 8 | 195 | 96330 | 481.87 | 829 | 806 | 198.2 |
| D | 13 | 122 | 95790 | 479.15 | 829 | 806 | 198.2 |
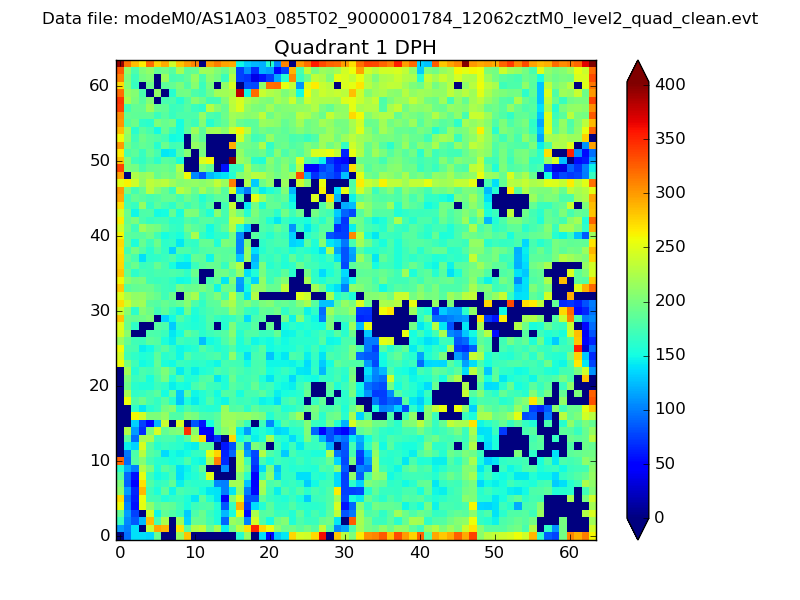
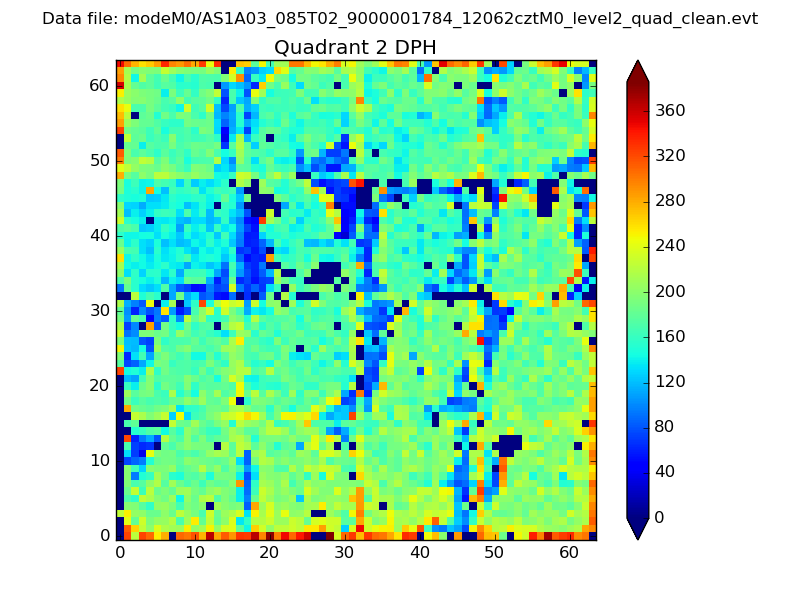
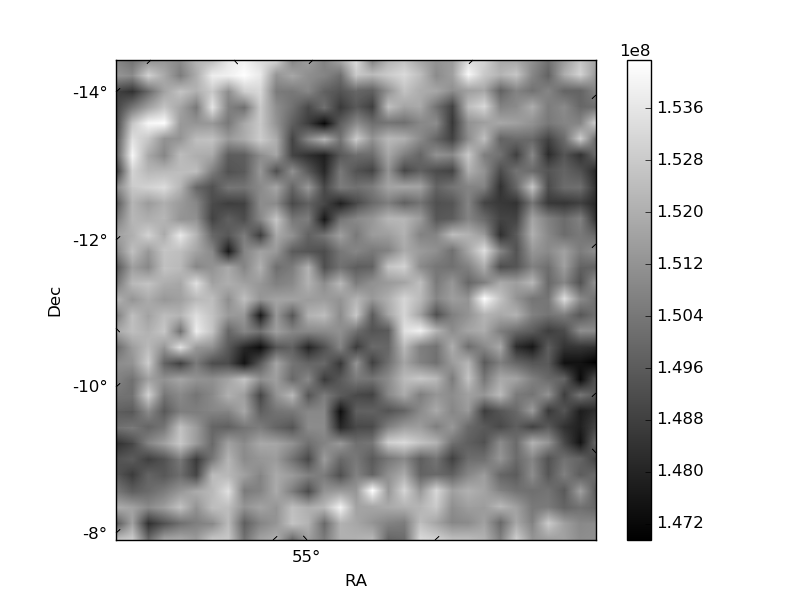
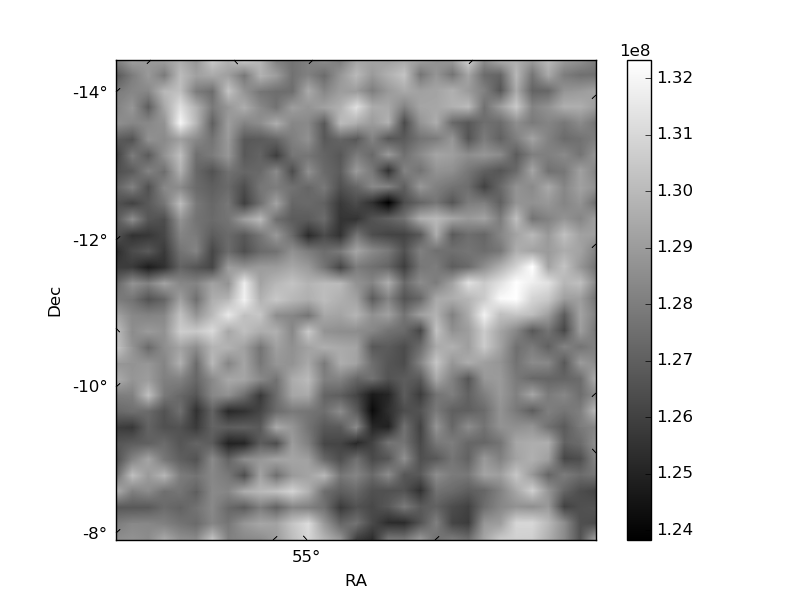
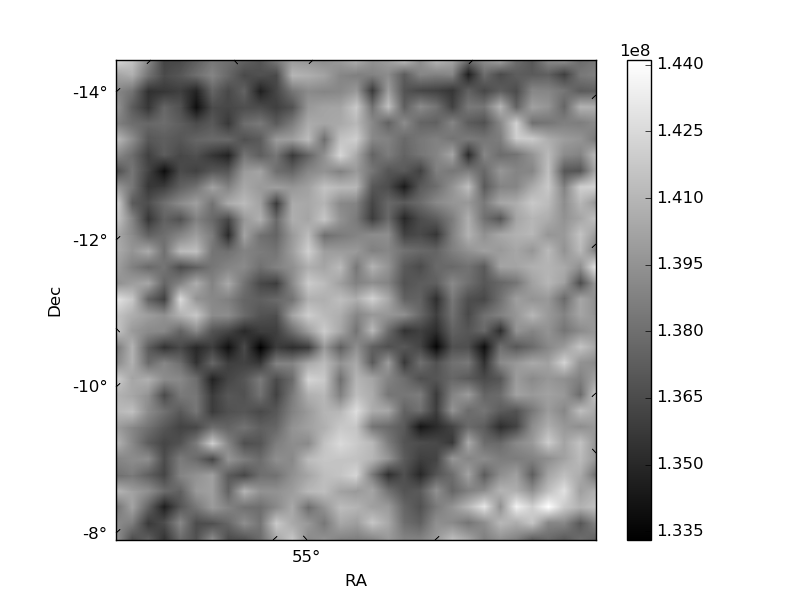
Histogram calculated using DETX and DETY for each event in the final _common_clean file
| Quadrant A |  |
 |
Quadrant B |
|---|---|---|---|
| Quadrant D | 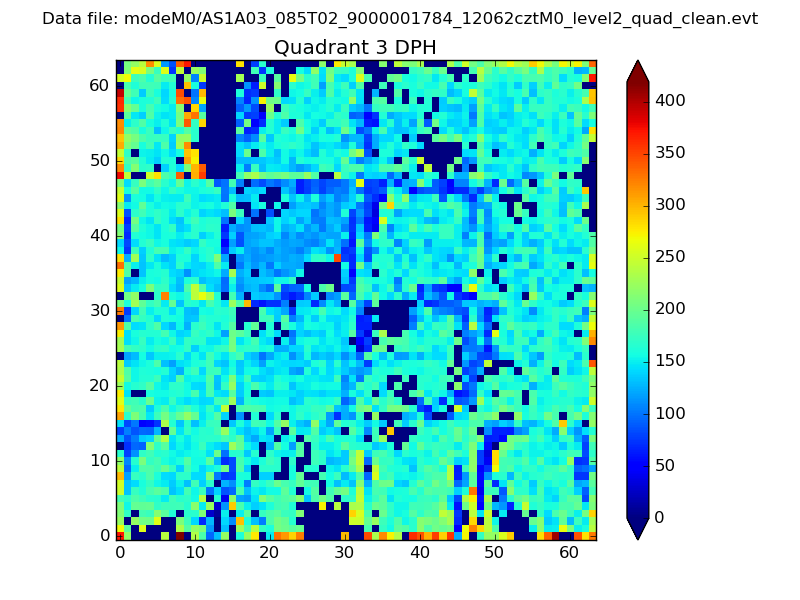 |
 |
Quadrant C |
| Plot type | Count rate plots | Images |
|---|---|---|
| Comparison with Poisson distribution Blue bars denote a histogram of data divided into 1 sec bins. Red curve is a Poisson curve with rate = median count rate of data. |
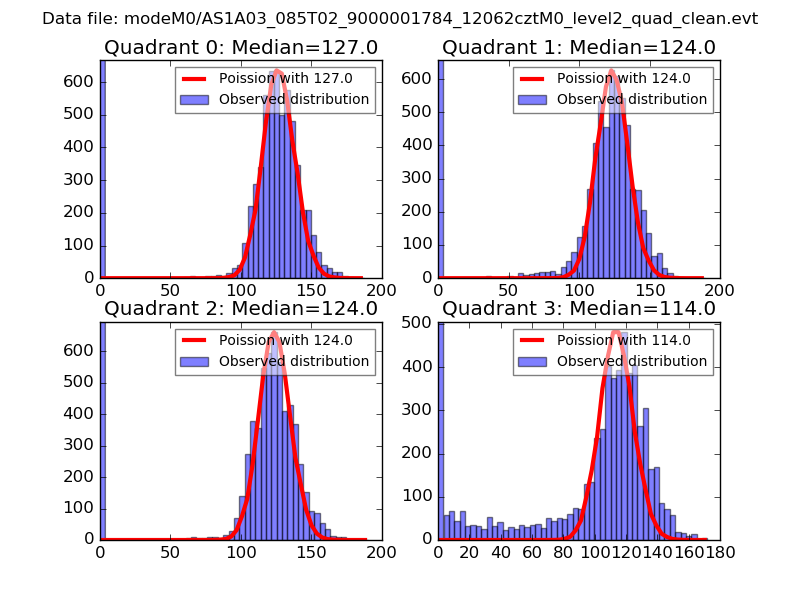 |
 |
| Quadrant-wise count rates Data is divided into 100 sec bins |
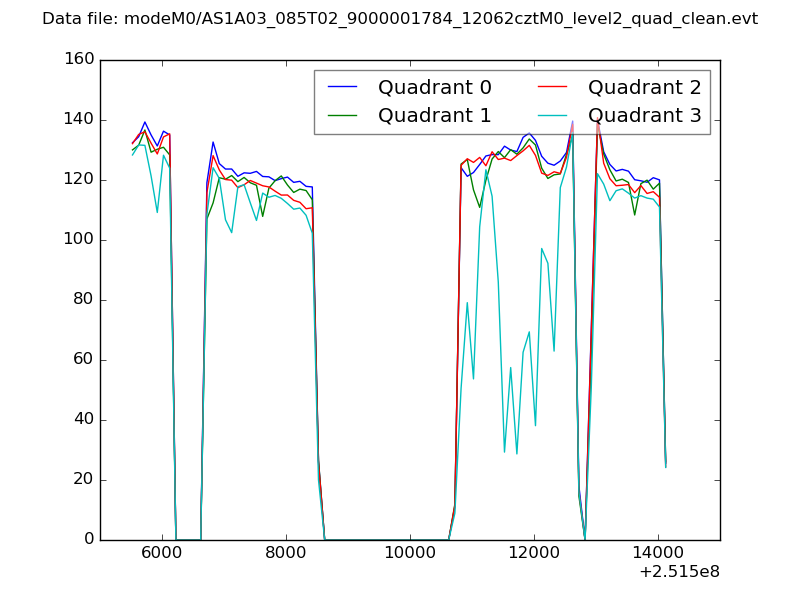 |
|
| Module-wise count rates for Quadrant A Data is divided into 100 sec bins |
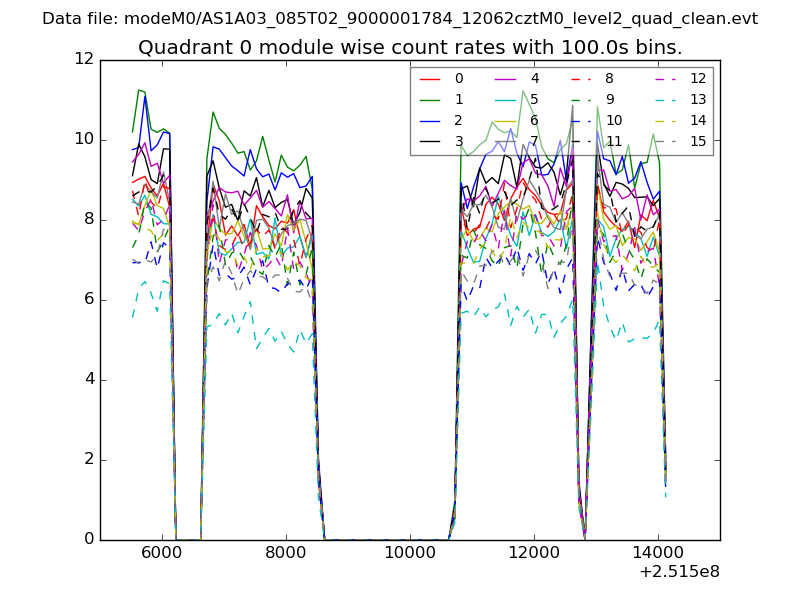 |
 |
| Module-wise count rates for Quadrant B Data is divided into 100 sec bins |
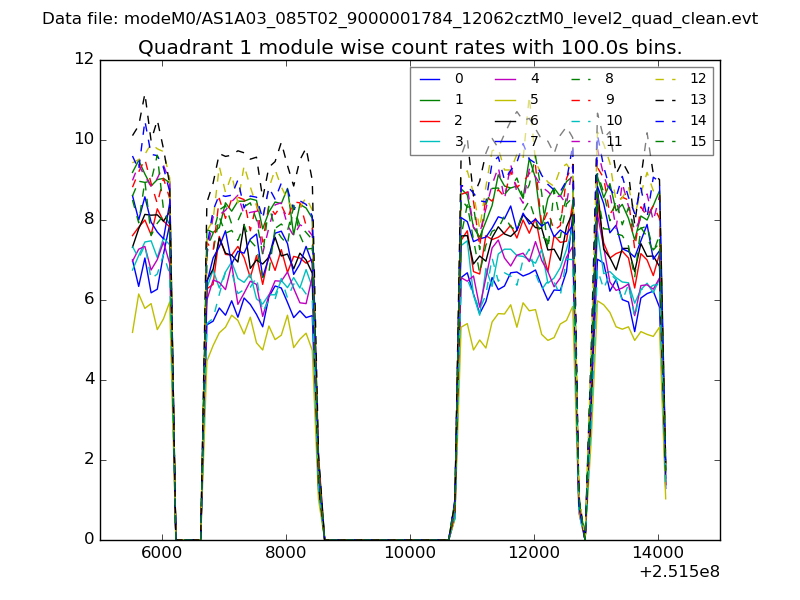 |
 |
| Module-wise count rates for Quadrant C Data is divided into 100 sec bins |
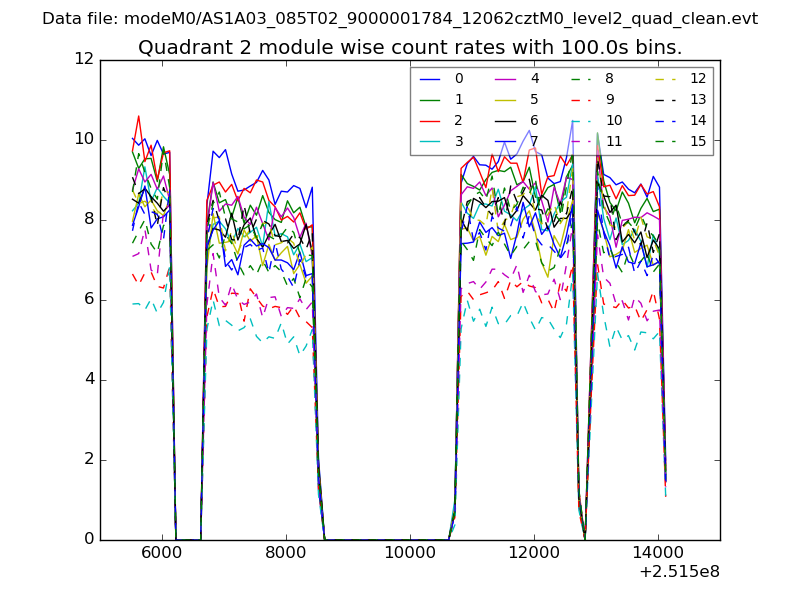 |
 |
| Module-wise count rates for Quadrant D Data is divided into 100 sec bins |
 |
 |
| Parameter | Plot |
|---|---|
| CZT HV Monitor | 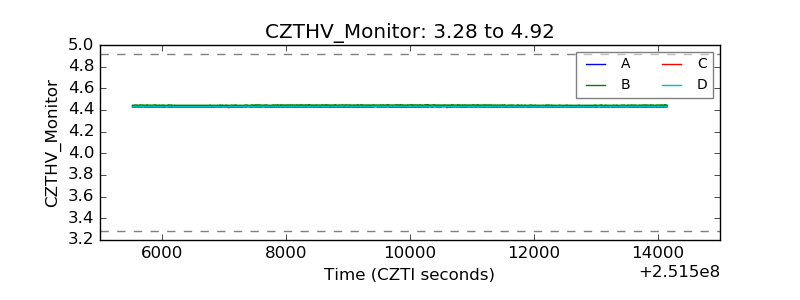 |
| D_VDD | 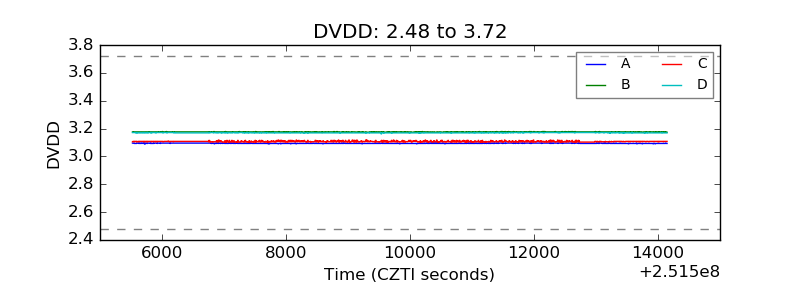 |
| Temperature 1 | 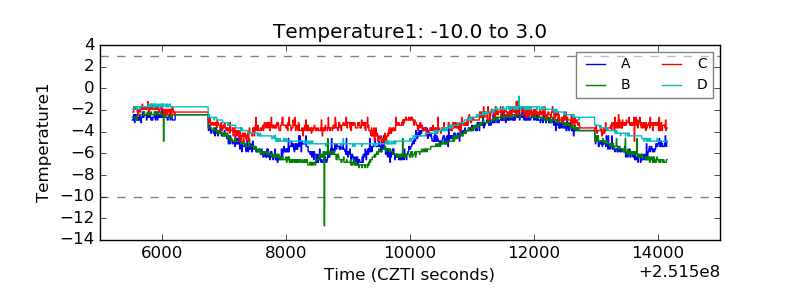 |
| Veto HV Monitor | 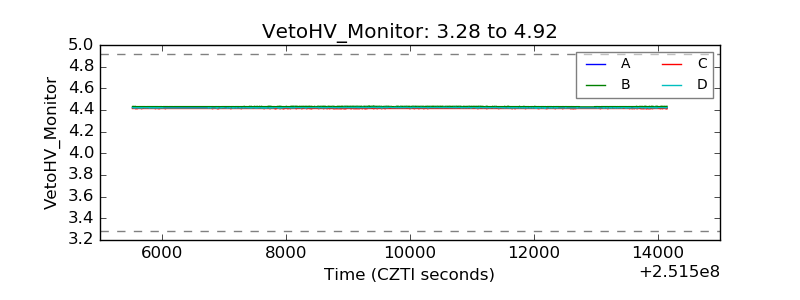 |
| Veto LLD | 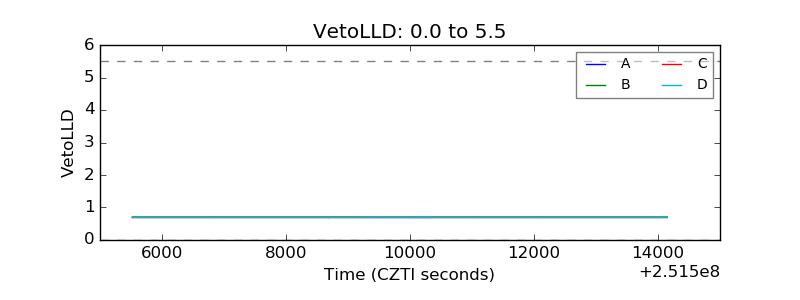 |
| Alpha Counter | 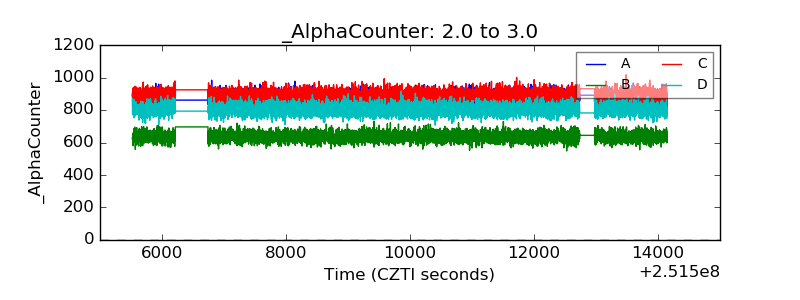 |
| _CPM_Rate | 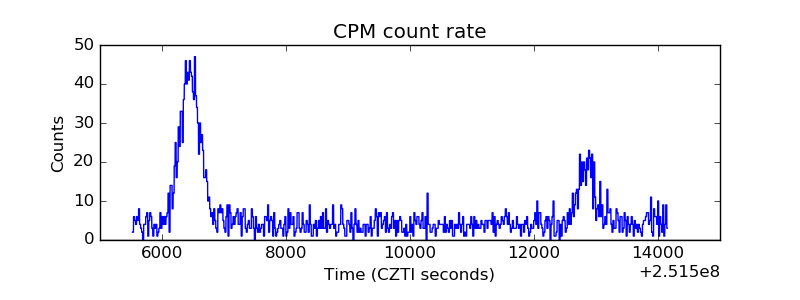 |
| CZT Counter | 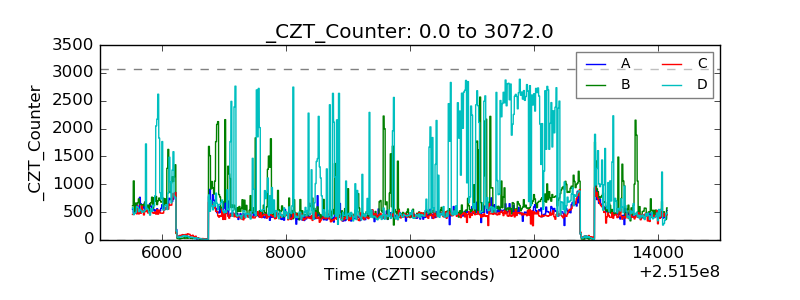 |
| +2.5 Volts monitor |  |
| +5 Volts monitor |  |
| _ROLL_ROT | 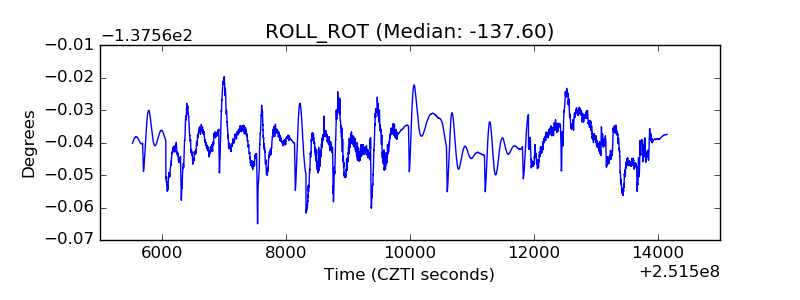 |
| _Roll_DEC | 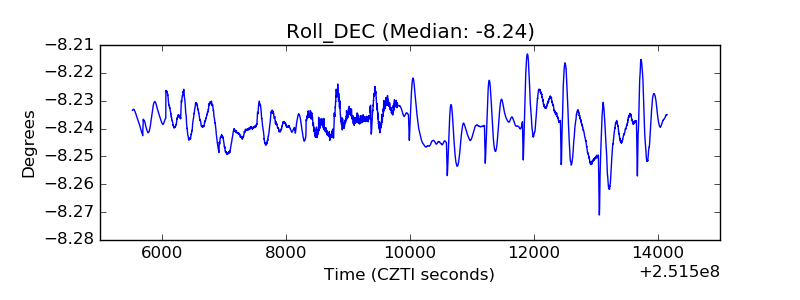 |
| _Roll_RA | 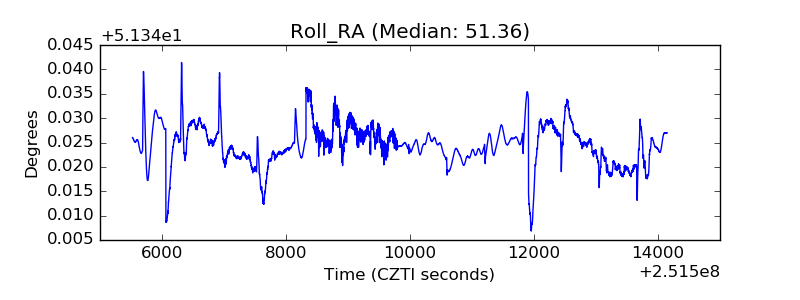 |
| Veto Counter | 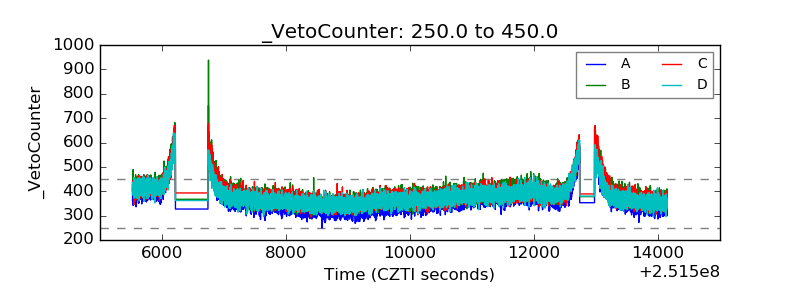 |