| Param | Original file | Final file |
|---|---|---|
| Filename | modeM0/AS1A04_130T01_9000001792cztM0_level2.fits | modeM0/AS1A04_130T01_9000001792cztM0_level2_quad_clean.evt |
| Size (bytes) | 390,879,360 | 370,877,760 |
| Size | 372.8 MB | 353.7 MB |
| Events in quadrant A | 2,350,362 | 2,198,331 |
| Events in quadrant B | 2,223,638 | 2,077,820 |
| Events in quadrant C | 2,337,738 | 2,124,198 |
| Events in quadrant D | 1,991,600 | 1,897,811 |
| Mode M0 | |||
|---|---|---|---|
| Quadrant | BADHDUFLAG | Total packets | Discarded packets |
| A | 0 | 90241 | 0 |
| B | 0 | 113536 | 0 |
| C | 0 | 88572 | 0 |
| D | 0 | 108505 | 0 |
| Mode M9 | |||
|---|---|---|---|
| Quadrant | BADHDUFLAG | Total packets | Discarded packets |
| A | 0 | 41 | 0 |
| B | 0 | 41 | 0 |
| C | 0 | 41 | 0 |
| D | 0 | 41 | 0 |
| Mode SS | |||
|---|---|---|---|
| Quadrant | BADHDUFLAG | Total packets | Discarded packets |
| A | 0 | 866 | 0 |
| B | 0 | 866 | 0 |
| C | 0 | 866 | 0 |
| D | 0 | 866 | 0 |
| Quadrant | Total seconds | Saturated seconds | Saturation percentage |
|---|---|---|---|
| A | 42735 | 452 | 1.057681% |
| B | 42735 | 2382 | 5.573886% |
| C | 42735 | 169 | 0.395460% |
| D | 42735 | 1529 | 3.577864% |
Noise dominated data is calculated using 1-second bins in cleaned event files. If a bin has >2000 counts, and if more than 50% of those come from <1% of pixels, then it is considered to be noise-dominated and hence unusable.
| Quadrant | # 1 sec bins | Bins with >0 counts | Bins with >2000 counts | High rate bins dominated by noise | Noise dominated (total time) | Noise dominated (detector-on time) | Marked lightcurve |
|---|---|---|---|---|---|---|---|
| A | 46690 | 42732 | 0 | 0 | 0.00% | 0.00% |  |
| B | 46690 | 42717 | 0 | 0 | 0.00% | 0.00% |  |
| C | 46690 | 42734 | 0 | 0 | 0.00% | 0.00% |  |
| D | 46690 | 42603 | 0 | 0 | 0.00% | 0.00% |  |
Top three noisy pixels from each quadrant. If the there are fewer than three noisy pixels in the level2.evt file, extra rows are filled as -1
| Pixel properties | Quadrant properties | ||||||
|---|---|---|---|---|---|---|---|
| Quadrant | DetID | PixID | Counts | Sigma | Mean | Median | Sigma |
| A | 0 | 29 | 2235 | 10.75 | 611 | 570 | 154.9 |
| A | 7 | 110 | 1917 | 8.7 | 611 | 570 | 154.9 |
| A | 9 | 19 | 1785 | 7.84 | 611 | 570 | 154.9 |
| B | 2 | 9 | 1919 | 11.07 | 586 | 554 | 123.3 |
| B | 3 | 17 | 1589 | 8.39 | 586 | 554 | 123.3 |
| B | 14 | 254 | 1472 | 7.44 | 586 | 554 | 123.3 |
| C | 1 | 80 | 1776 | 7.45 | 617 | 570 | 162.0 |
| C | 1 | 81 | 1750 | 7.29 | 617 | 570 | 162.0 |
| C | 12 | 241 | 1709 | 7.03 | 617 | 570 | 162.0 |
| D | 3 | 14 | 1504 | 6.35 | 568 | 514 | 156.0 |
| D | 6 | 231 | 1496 | 6.3 | 568 | 514 | 156.0 |
| D | 7 | 3 | 1452 | 6.01 | 568 | 514 | 156.0 |
Histogram calculated using DETX and DETY for each event in the final _common_clean file
| Quadrant A | 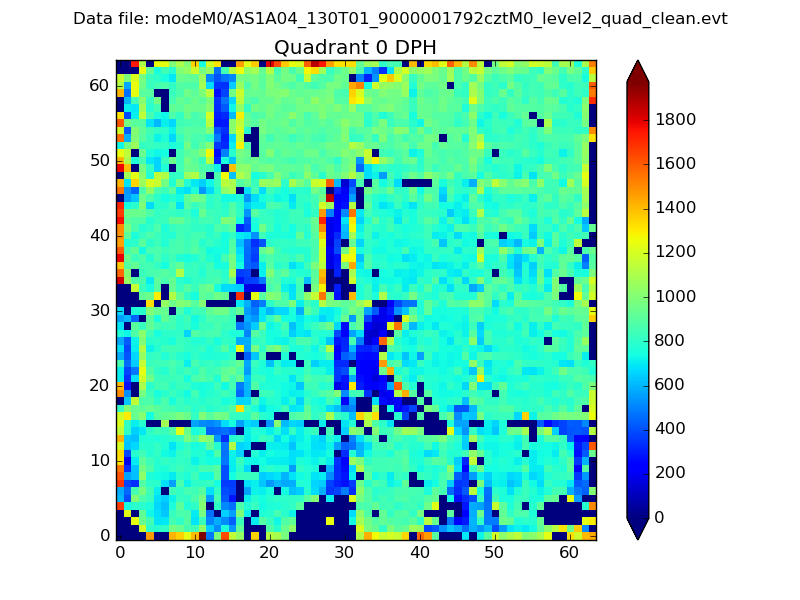 |
 |
Quadrant B |
|---|---|---|---|
| Quadrant D |  |
 |
Quadrant C |
| Plot type | Count rate plots | Images |
|---|---|---|
| Comparison with Poisson distribution Blue bars denote a histogram of data divided into 1 sec bins. Red curve is a Poisson curve with rate = median count rate of data. |
 |
 |
| Quadrant-wise count rates Data is divided into 100 sec bins |
 |
|
| Module-wise count rates for Quadrant A Data is divided into 100 sec bins |
 |
 |
| Module-wise count rates for Quadrant B Data is divided into 100 sec bins |
 |
 |
| Module-wise count rates for Quadrant C Data is divided into 100 sec bins |
 |
 |
| Module-wise count rates for Quadrant D Data is divided into 100 sec bins |
 |
 |
| Parameter | Plot |
|---|---|
| CZT HV Monitor |  |
| D_VDD |  |
| Temperature 1 |  |
| Veto HV Monitor |  |
| Veto LLD |  |
| Alpha Counter |  |
| _CPM_Rate |  |
| CZT Counter |  |
| +2.5 Volts monitor |  |
| +5 Volts monitor |  |
| _ROLL_ROT |  |
| _Roll_DEC |  |
| _Roll_RA |  |
| Veto Counter |  |