| Param | Original file | Final file |
|---|---|---|
| Filename | modeM0/AS1A04_130T01_9000001792_12073cztM0_level2.evt | modeM0/AS1A04_130T01_9000001792_12073cztM0_level2_quad_clean.evt |
| Size (bytes) | 327,847,680 | 50,840,640 |
| Size | 312.7 MB | 48.5 MB |
| Events in quadrant A | 2,292,947 | 305,683 |
| Events in quadrant B | 2,714,757 | 304,269 |
| Events in quadrant C | 2,208,090 | 308,226 |
| Events in quadrant D | 2,398,967 | 297,206 |
| Mode M0 | |||
|---|---|---|---|
| Quadrant | BADHDUFLAG | Total packets | Discarded packets |
| A | 0 | 9869 | 2 |
| B | 0 | 11015 | 1 |
| C | 0 | 9644 | 1 |
| D | 0 | 10083 | 1 |
| Mode M9 | |||
|---|---|---|---|
| Quadrant | BADHDUFLAG | Total packets | Discarded packets |
| A | 0 | 11 | 0 |
| B | 0 | 11 | 0 |
| C | 0 | 11 | 0 |
| D | 0 | 11 | 0 |
| Mode SS | |||
|---|---|---|---|
| Quadrant | BADHDUFLAG | Total packets | Discarded packets |
| A | 0 | 94 | 0 |
| B | 0 | 94 | 0 |
| C | 0 | 94 | 0 |
| D | 0 | 94 | 0 |
| Quadrant | Total seconds | Saturated seconds | Saturation percentage |
|---|---|---|---|
| A | 4606 | 64 | 1.389492% |
| B | 4606 | 124 | 2.692141% |
| C | 4606 | 25 | 0.542770% |
| D | 4606 | 52 | 1.128962% |
Noise dominated data is calculated using 1-second bins in cleaned event files. If a bin has >2000 counts, and if more than 50% of those come from <1% of pixels, then it is considered to be noise-dominated and hence unusable.
| Quadrant | # 1 sec bins | Bins with >0 counts | Bins with >2000 counts | High rate bins dominated by noise | Noise dominated (total time) | Noise dominated (detector-on time) | Marked lightcurve |
|---|---|---|---|---|---|---|---|
| A | 5697 | 4607 | 9 | 9 | 0.16% | 0.20% | 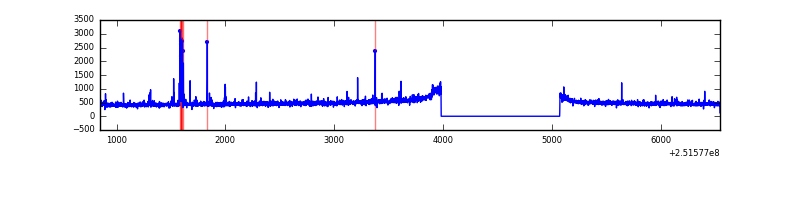 |
| B | 5697 | 4608 | 44 | 44 | 0.77% | 0.95% | 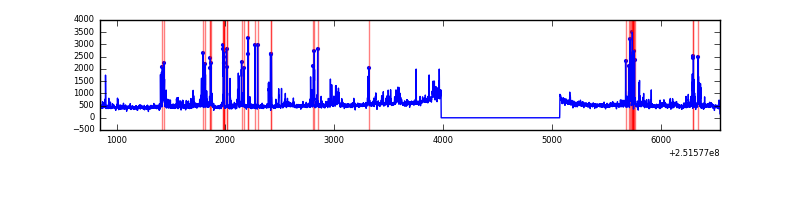 |
| C | 5697 | 4608 | 0 | 0 | 0.00% | 0.00% | 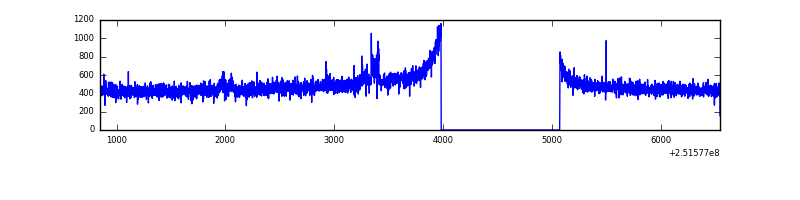 |
| D | 5697 | 4607 | 14 | 14 | 0.25% | 0.30% | 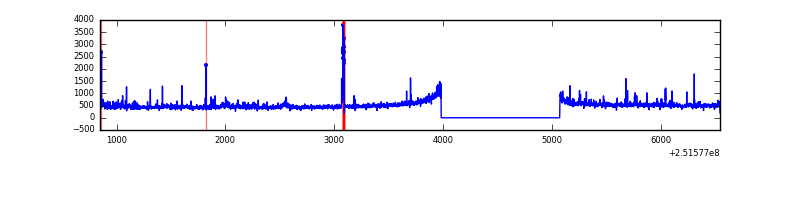 |
Top three noisy pixels from each quadrant. If the there are fewer than three noisy pixels in the level2.evt file, extra rows are filled as -1
| Pixel properties | Quadrant properties | ||||||
|---|---|---|---|---|---|---|---|
| Quadrant | DetID | PixID | Counts | Sigma | Mean | Median | Sigma |
| A | 1 | 162 | 52078 | 445.76 | 563 | 550 | 115.6 |
| A | 1 | 178 | 18135 | 152.13 | 563 | 550 | 115.6 |
| A | 1 | 161 | 16513 | 138.09 | 563 | 550 | 115.6 |
| B | 4 | 239 | 381419 | 3491.32 | 563 | 549 | 109.1 |
| B | 15 | 204 | 57668 | 523.59 | 563 | 549 | 109.1 |
| B | 11 | 51 | 30657 | 275.99 | 563 | 549 | 109.1 |
| C | 8 | 208 | 29978 | 224.43 | 555 | 557 | 131.1 |
| C | 0 | 207 | 11870 | 86.3 | 555 | 557 | 131.1 |
| C | 13 | 61 | 4097 | 27.0 | 555 | 557 | 131.1 |
| D | 8 | 195 | 114251 | 849.69 | 550 | 535 | 133.8 |
| D | 1 | 52 | 88334 | 656.04 | 550 | 535 | 133.8 |
| D | 13 | 249 | 52027 | 384.75 | 550 | 535 | 133.8 |
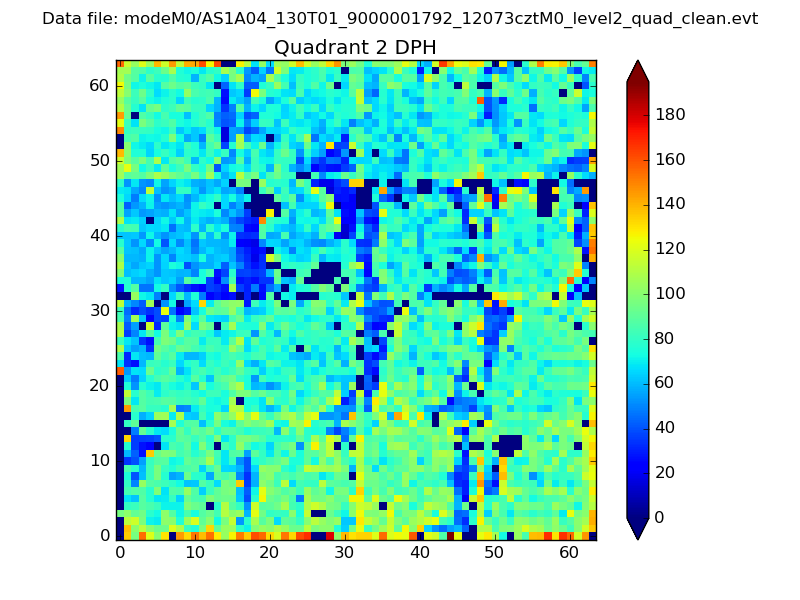
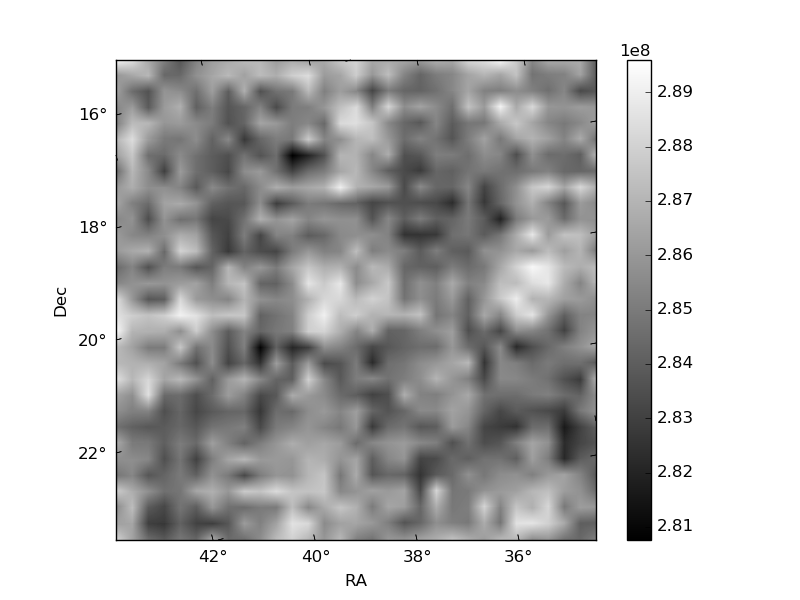
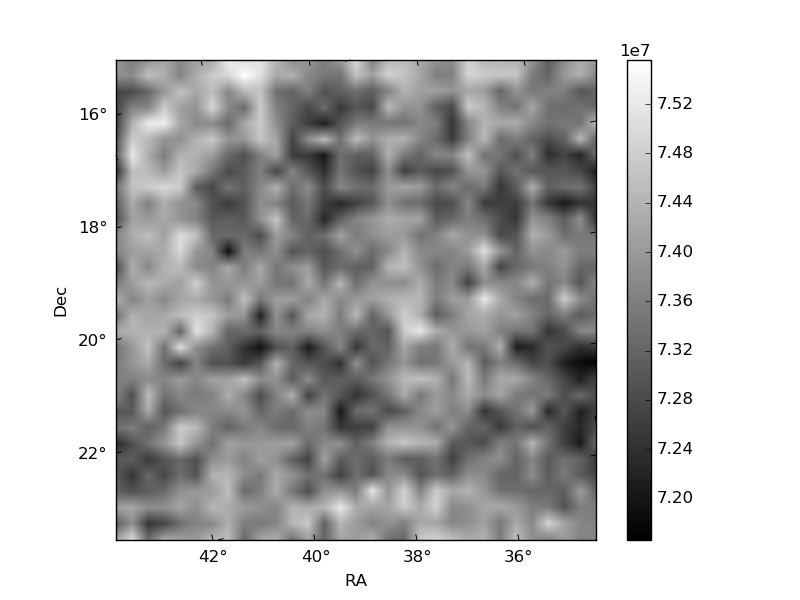
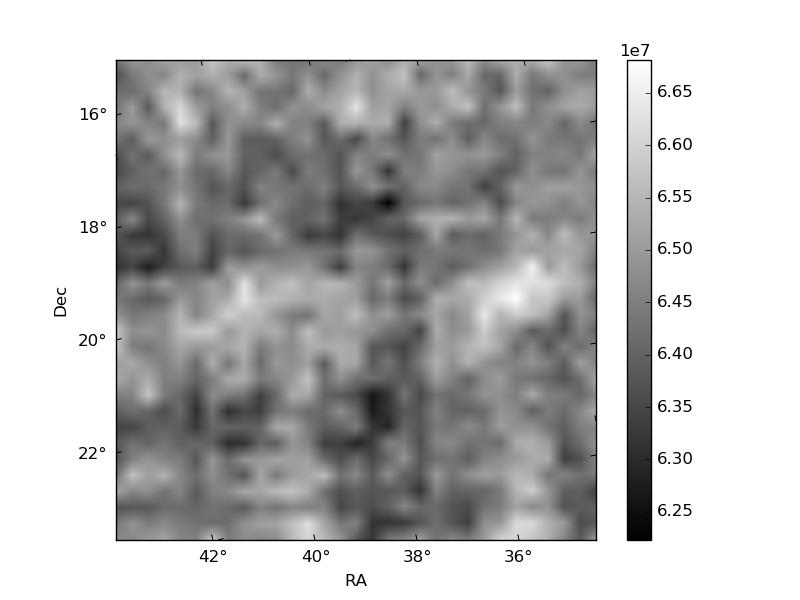
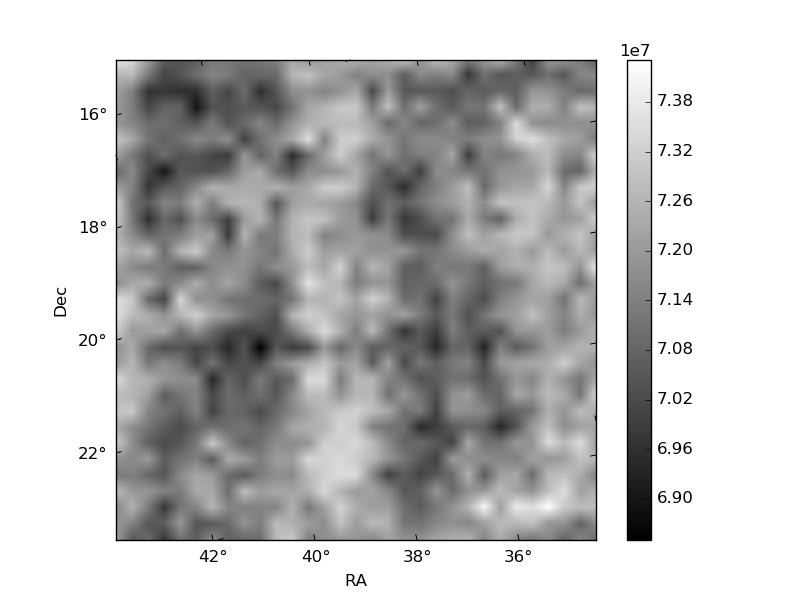
Histogram calculated using DETX and DETY for each event in the final _common_clean file
| Quadrant A | 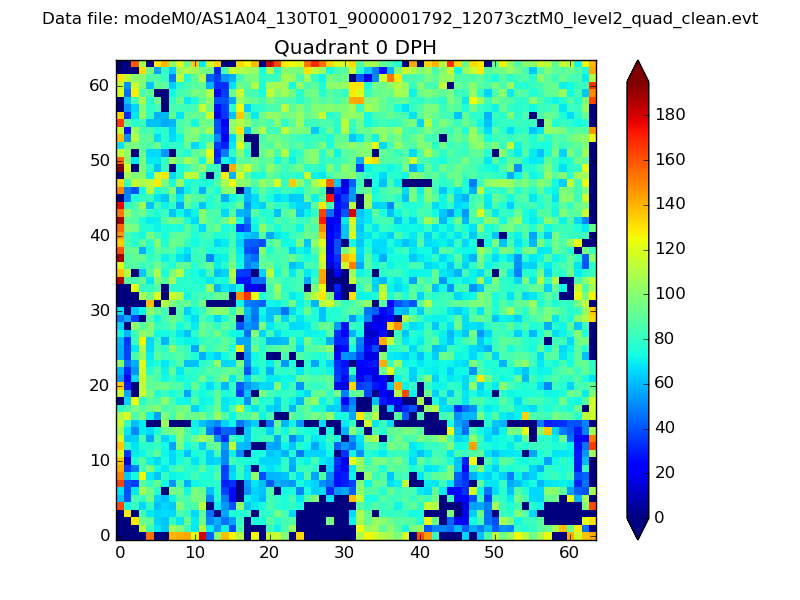 |
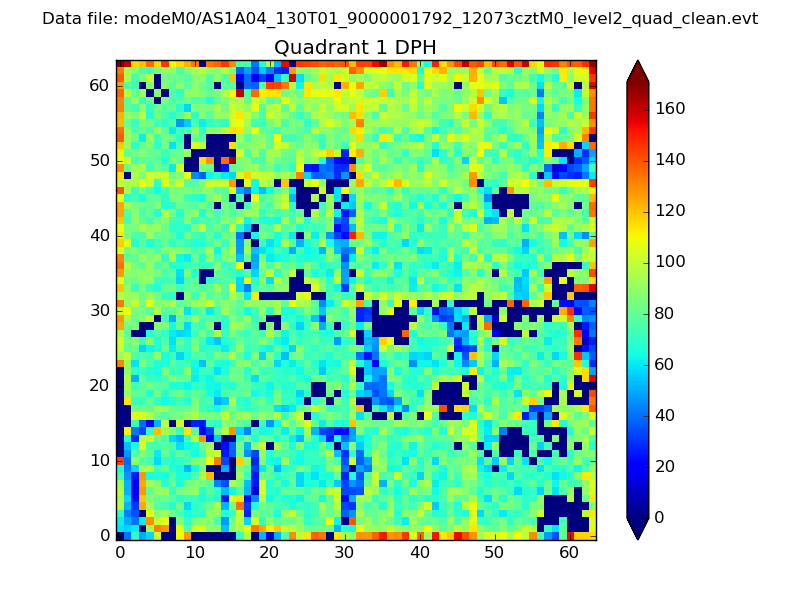 |
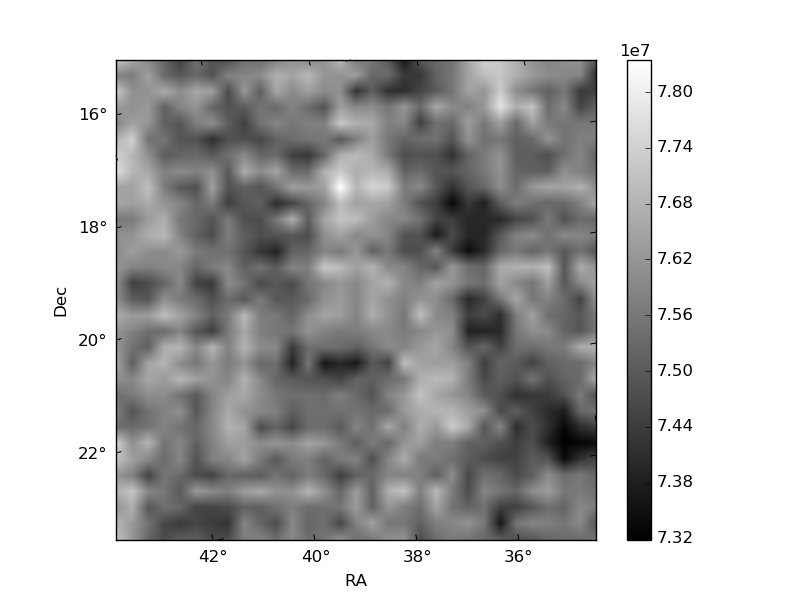
Quadrant B |
|---|---|---|---|
| Quadrant D | 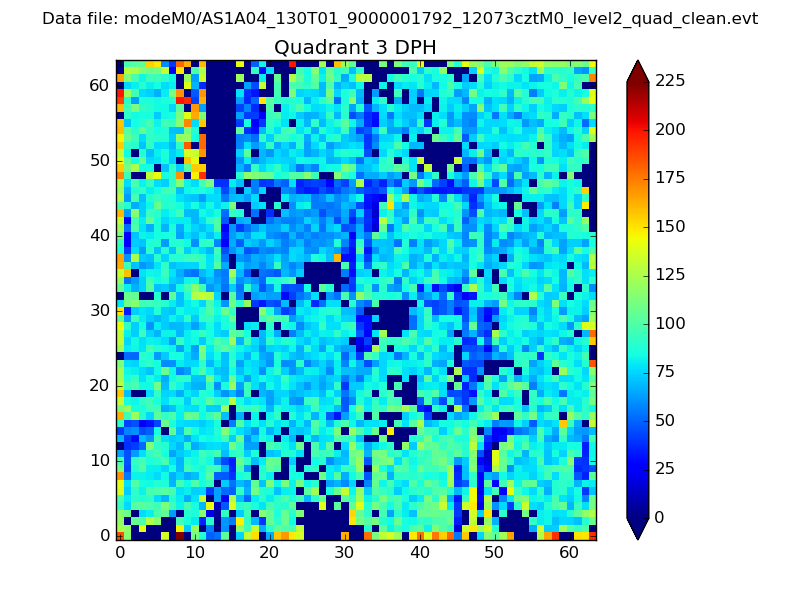 |
 |
Quadrant C |
| Plot type | Count rate plots | Images |
|---|---|---|
| Comparison with Poisson distribution Blue bars denote a histogram of data divided into 1 sec bins. Red curve is a Poisson curve with rate = median count rate of data. |
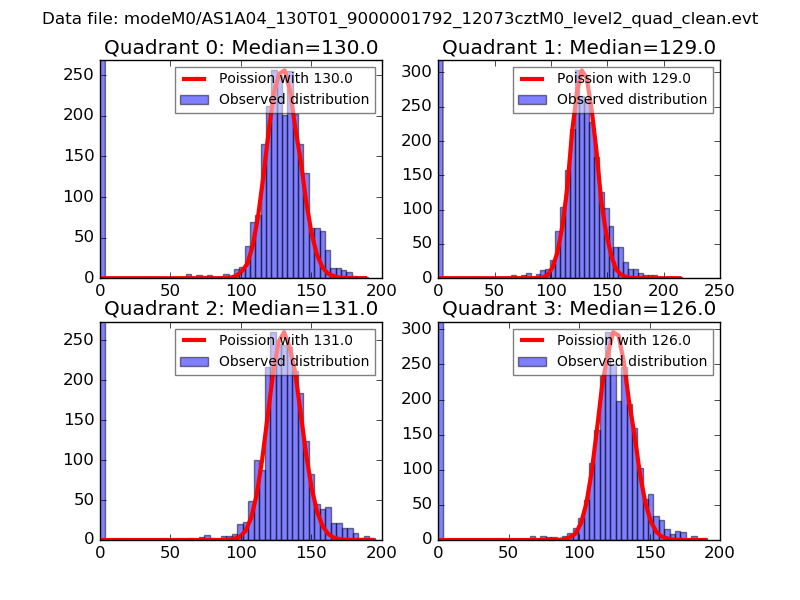 |
 |
| Quadrant-wise count rates Data is divided into 100 sec bins |
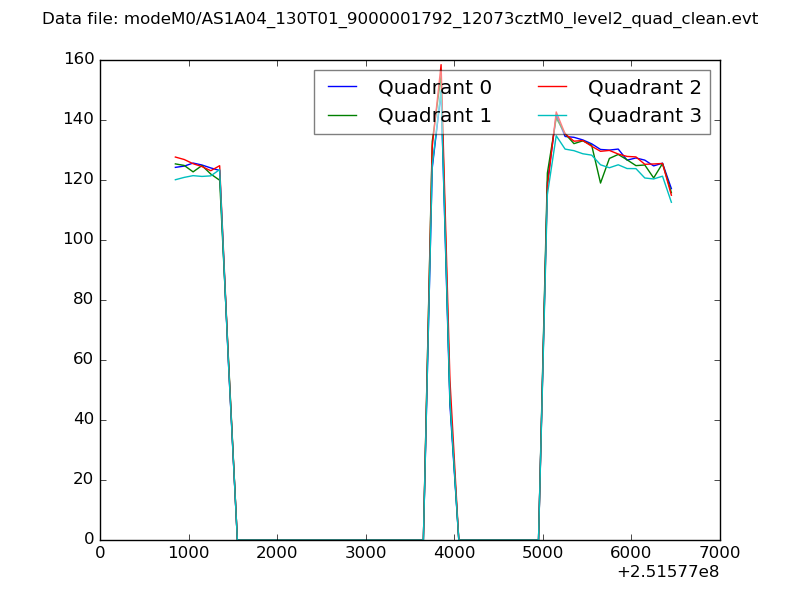 |
|
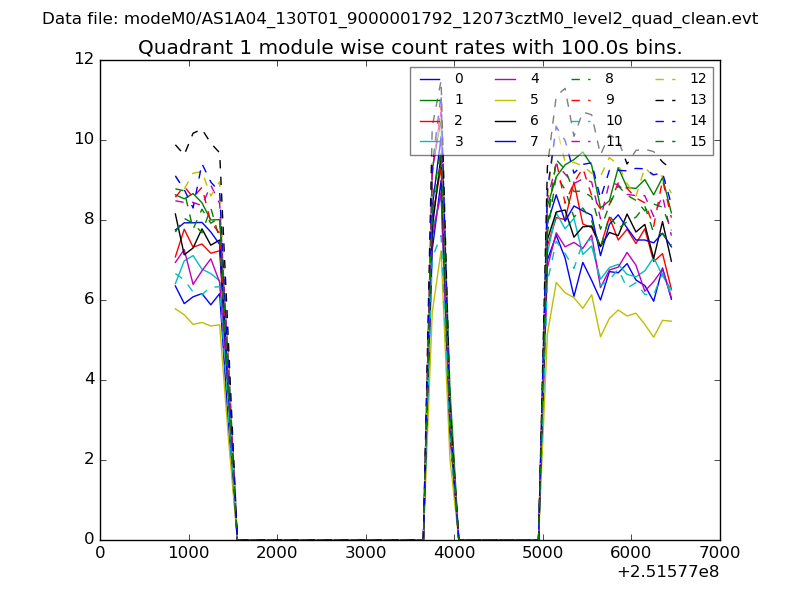
| Module-wise count rates for Quadrant A Data is divided into 100 sec bins |
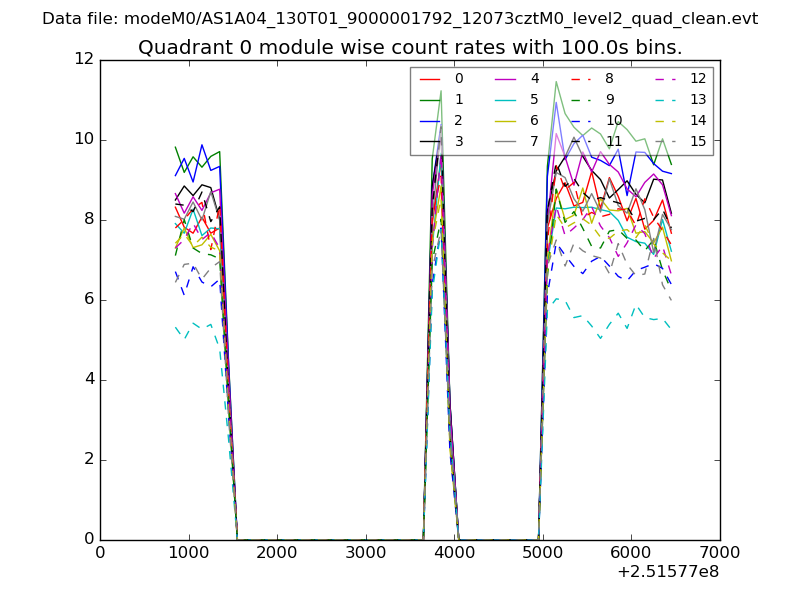 |
 |
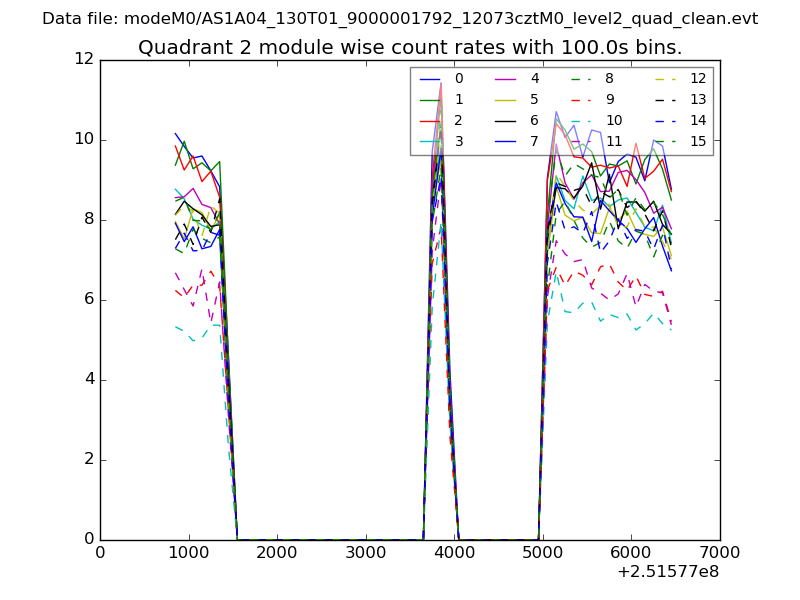
| Module-wise count rates for Quadrant B Data is divided into 100 sec bins |
 |
 |
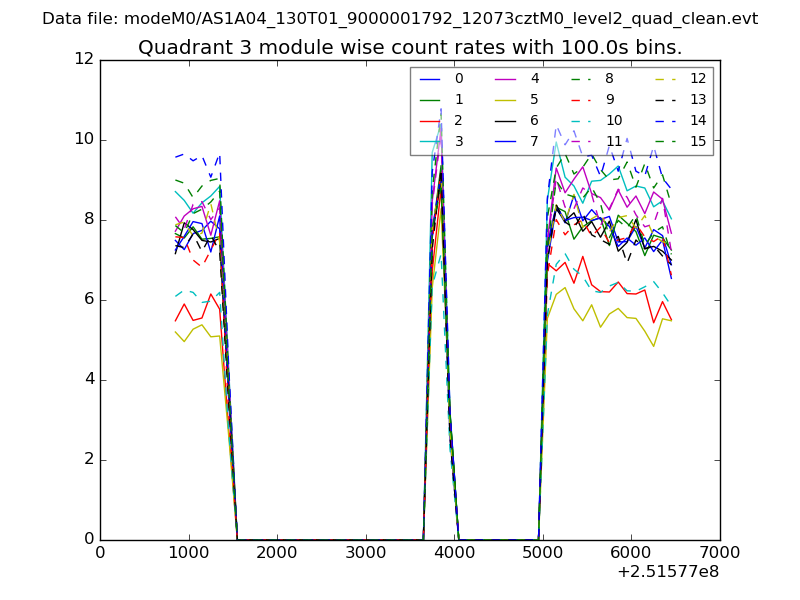
| Module-wise count rates for Quadrant C Data is divided into 100 sec bins |
 |
 |
| Module-wise count rates for Quadrant D Data is divided into 100 sec bins |
 |
 |
| Parameter | Plot |
|---|---|
| CZT HV Monitor | 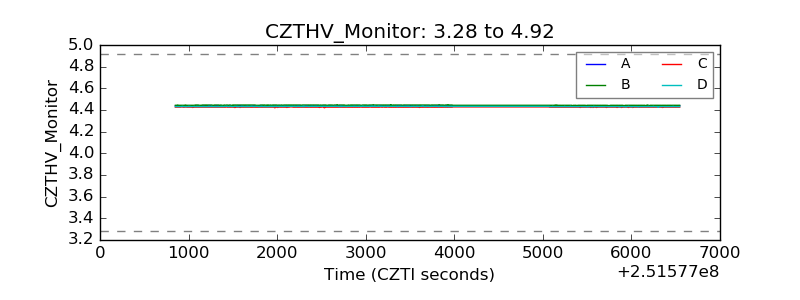 |
| D_VDD | 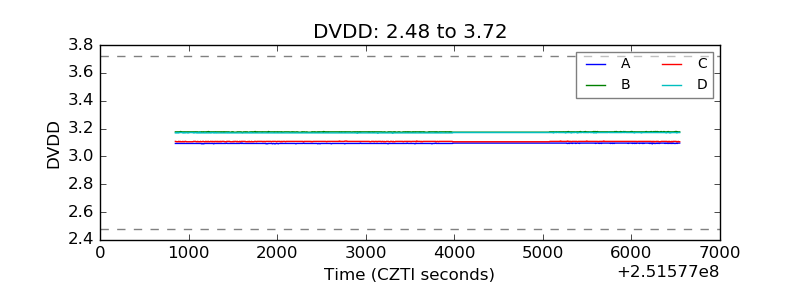 |
| Temperature 1 | 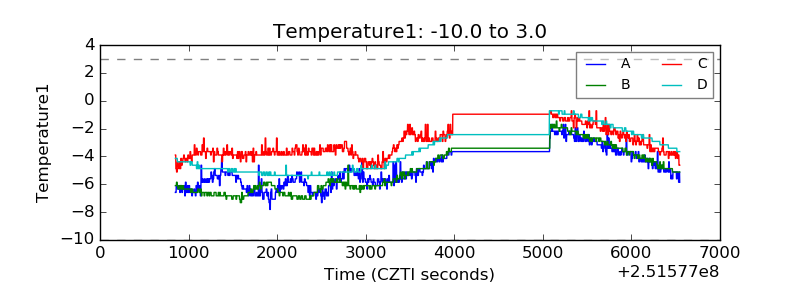 |
| Veto HV Monitor | 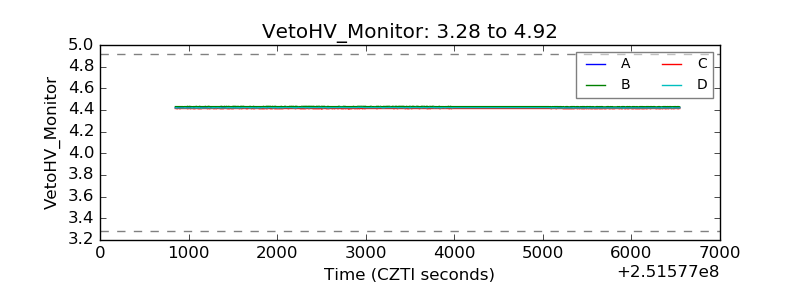 |
| Veto LLD | 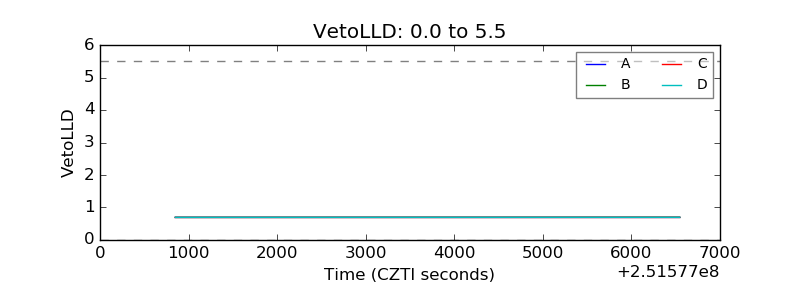 |
| Alpha Counter | 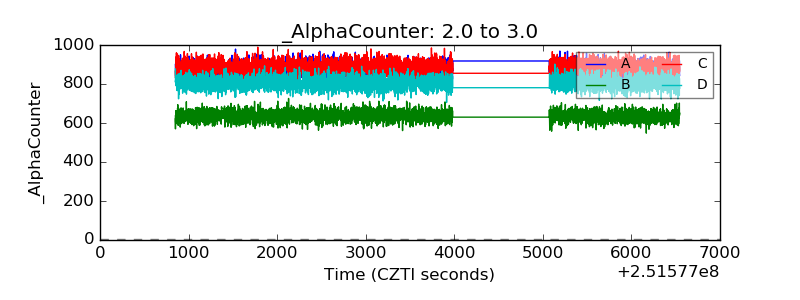 |
| _CPM_Rate | 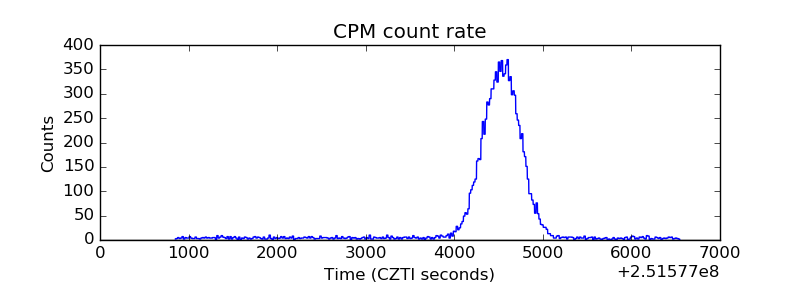 |
| CZT Counter | 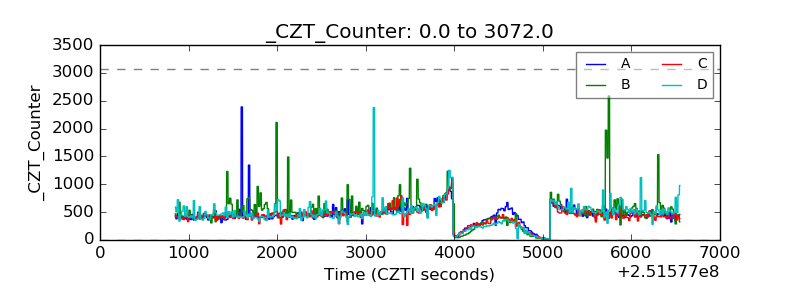 |
| +2.5 Volts monitor | 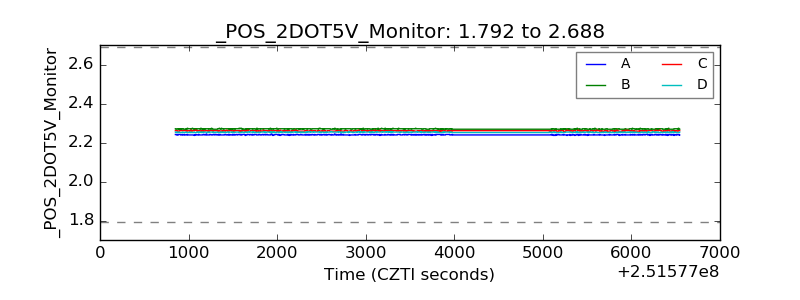 |
| +5 Volts monitor |  |
| _ROLL_ROT | 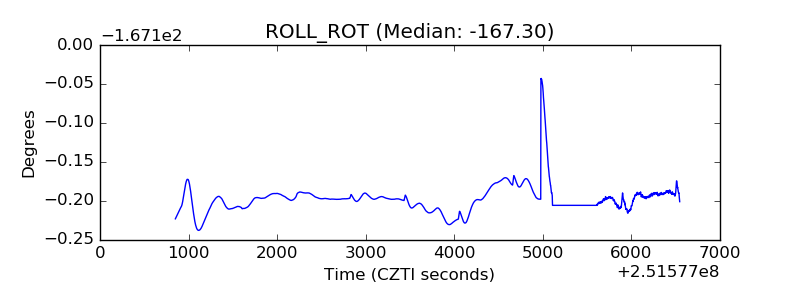 |
| _Roll_DEC | 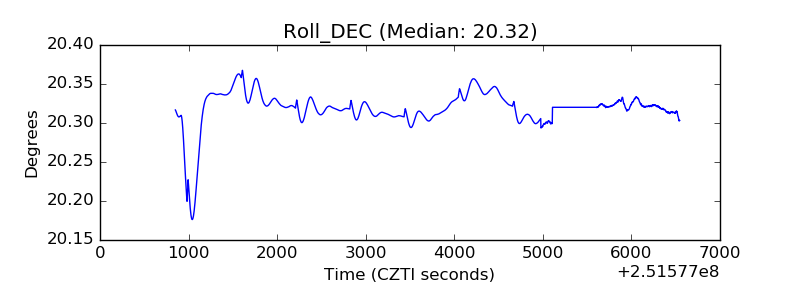 |
| _Roll_RA | 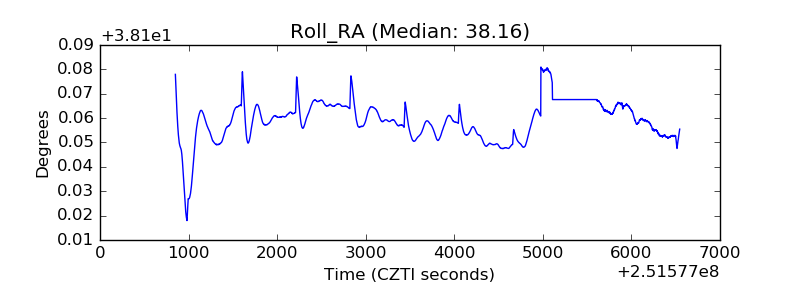 |
| Veto Counter | 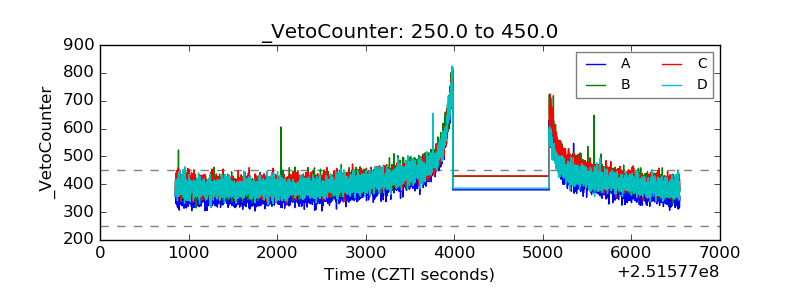 |