| Param | Original file | Final file |
|---|---|---|
| Filename | modeM0/AS1A04_130T01_9000001792_12075cztM0_level2.evt | modeM0/AS1A04_130T01_9000001792_12075cztM0_level2_quad_clean.evt |
| Size (bytes) | 636,926,400 | 113,454,720 |
| Size | 607.4 MB | 108.2 MB |
| Events in quadrant A | 3,997,722 | 729,246 |
| Events in quadrant B | 5,640,198 | 708,478 |
| Events in quadrant C | 4,131,569 | 734,904 |
| Events in quadrant D | 4,974,524 | 703,785 |
| Mode M0 | |||
|---|---|---|---|
| Quadrant | BADHDUFLAG | Total packets | Discarded packets |
| A | 0 | 17239 | 3 |
| B | 0 | 22193 | 2 |
| C | 0 | 17555 | 2 |
| D | 0 | 20109 | 2 |
| Mode M9 | |||
|---|---|---|---|
| Quadrant | BADHDUFLAG | Total packets | Discarded packets |
| A | 0 | 11 | 0 |
| B | 0 | 11 | 0 |
| C | 0 | 11 | 0 |
| D | 0 | 11 | 0 |
| Mode SS | |||
|---|---|---|---|
| Quadrant | BADHDUFLAG | Total packets | Discarded packets |
| A | 0 | 162 | 0 |
| B | 0 | 162 | 0 |
| C | 0 | 162 | 0 |
| D | 0 | 162 | 0 |
| Quadrant | Total seconds | Saturated seconds | Saturation percentage |
|---|---|---|---|
| A | 8061 | 118 | 1.463838% |
| B | 8061 | 553 | 6.860191% |
| C | 8061 | 45 | 0.558243% |
| D | 8061 | 143 | 1.773973% |
Noise dominated data is calculated using 1-second bins in cleaned event files. If a bin has >2000 counts, and if more than 50% of those come from <1% of pixels, then it is considered to be noise-dominated and hence unusable.
| Quadrant | # 1 sec bins | Bins with >0 counts | Bins with >2000 counts | High rate bins dominated by noise | Noise dominated (total time) | Noise dominated (detector-on time) | Marked lightcurve |
|---|---|---|---|---|---|---|---|
| A | 9077 | 8065 | 6 | 6 | 0.07% | 0.07% | 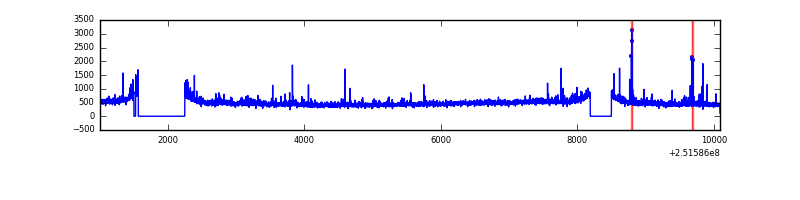 |
| B | 9077 | 8065 | 292 | 292 | 3.22% | 3.62% | 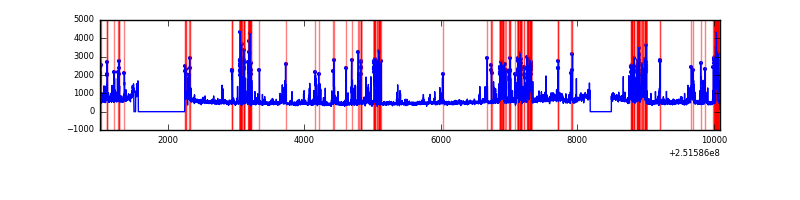 |
| C | 9077 | 8065 | 0 | 0 | 0.00% | 0.00% | 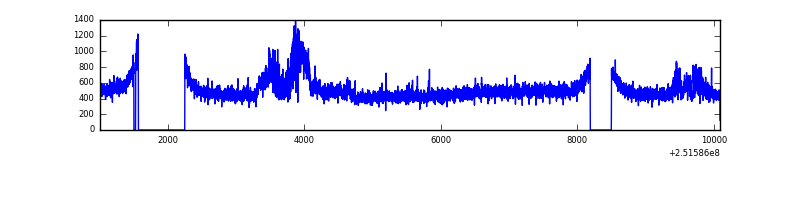 |
| D | 9077 | 8065 | 65 | 65 | 0.72% | 0.81% | 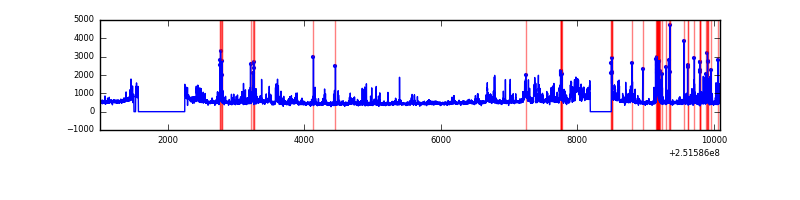 |
Top three noisy pixels from each quadrant. If the there are fewer than three noisy pixels in the level2.evt file, extra rows are filled as -1
| Pixel properties | Quadrant properties | ||||||
|---|---|---|---|---|---|---|---|
| Quadrant | DetID | PixID | Counts | Sigma | Mean | Median | Sigma |
| A | 1 | 162 | 49661 | 245.3 | 978 | 956 | 198.6 |
| A | 13 | 251 | 47417 | 234.0 | 978 | 956 | 198.6 |
| A | 3 | 1 | 27060 | 131.47 | 978 | 956 | 198.6 |
| B | 4 | 239 | 1260549 | 6828.93 | 960 | 936 | 184.5 |
| B | 0 | 231 | 215380 | 1162.6 | 960 | 936 | 184.5 |
| B | 15 | 204 | 169464 | 913.67 | 960 | 936 | 184.5 |
| C | 8 | 208 | 395543 | 1759.14 | 957 | 964 | 224.3 |
| C | 13 | 61 | 7019 | 26.99 | 957 | 964 | 224.3 |
| C | 0 | 207 | 4274 | 14.76 | 957 | 964 | 224.3 |
| D | 1 | 52 | 865096 | 3711.99 | 954 | 925 | 232.8 |
| D | 8 | 195 | 266931 | 1142.61 | 954 | 925 | 232.8 |
| D | 13 | 104 | 74874 | 317.64 | 954 | 925 | 232.8 |
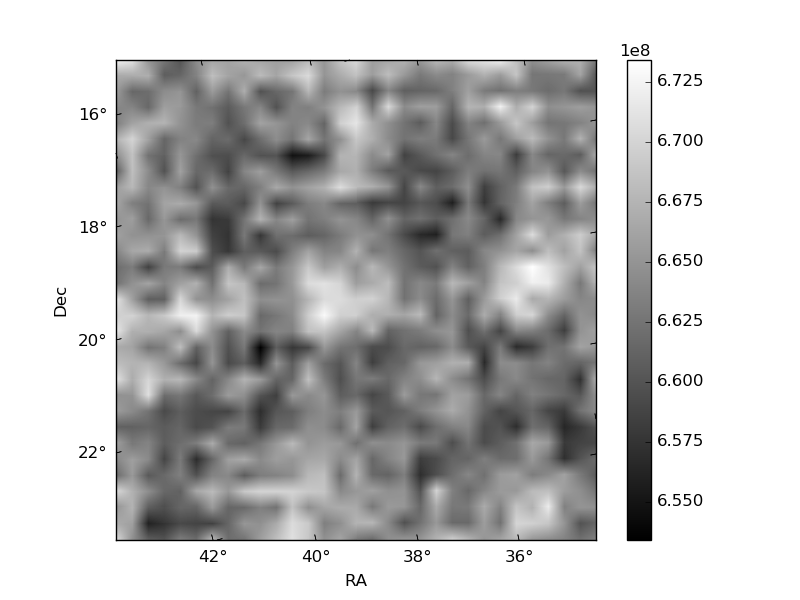
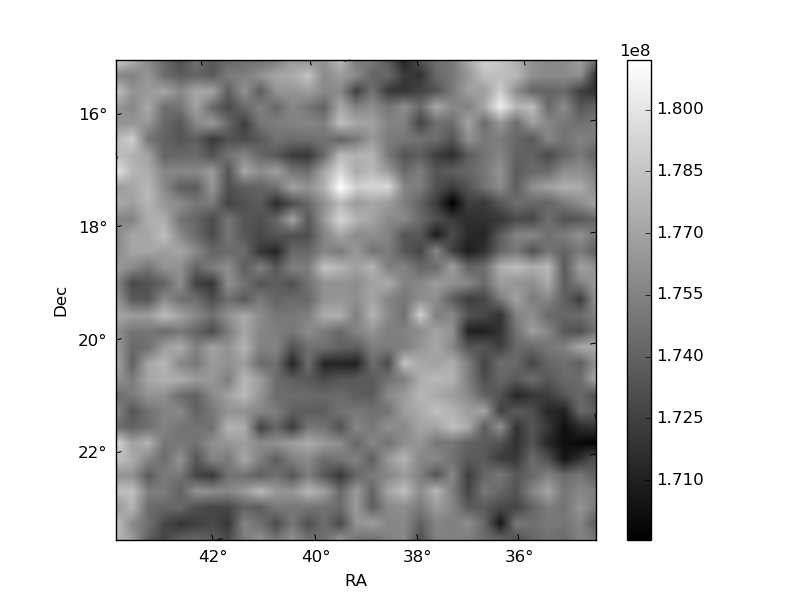
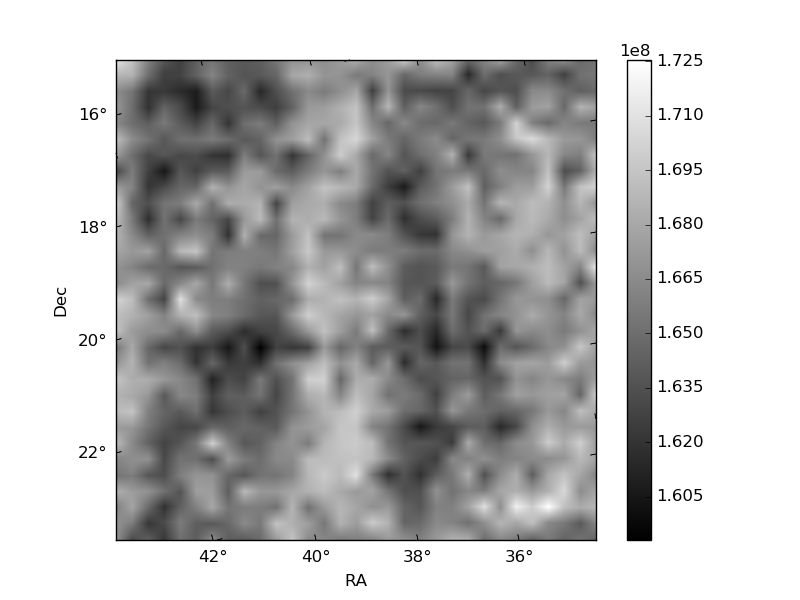
Histogram calculated using DETX and DETY for each event in the final _common_clean file
| Quadrant A | 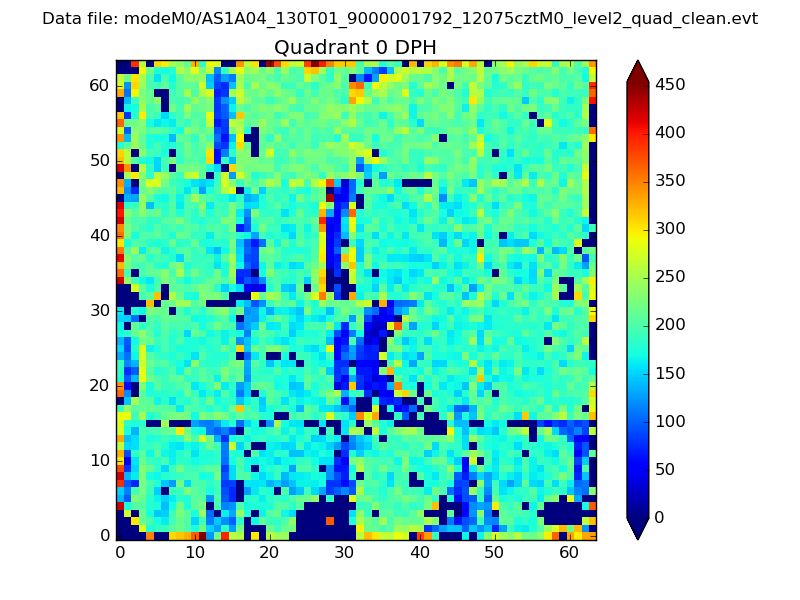 |
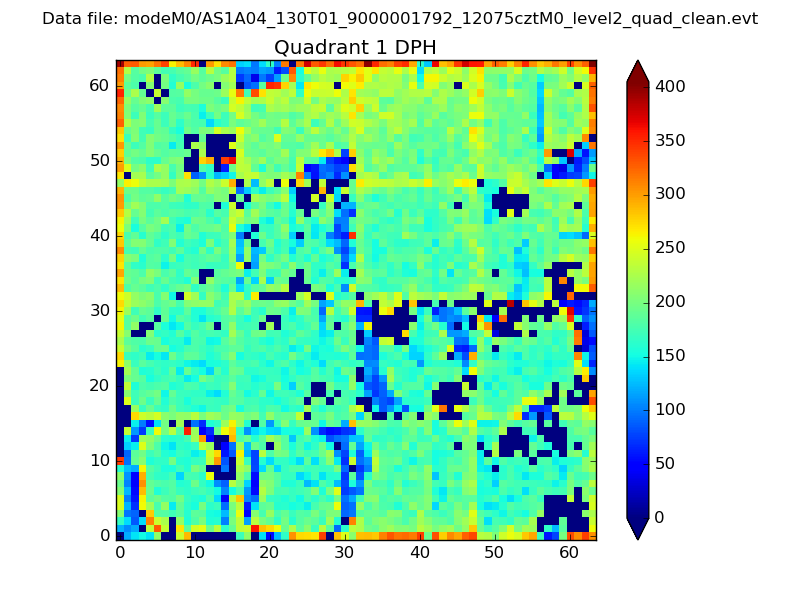 |
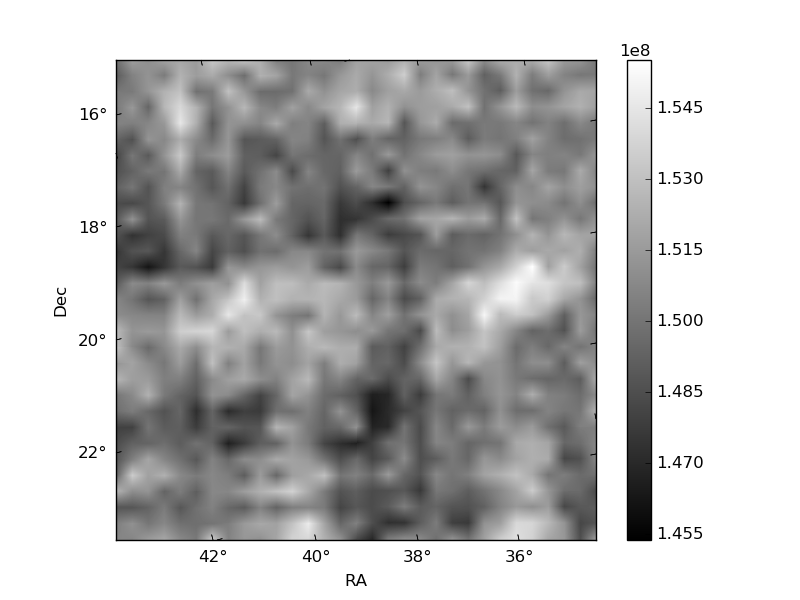
Quadrant B |
|---|---|---|---|
| Quadrant D | 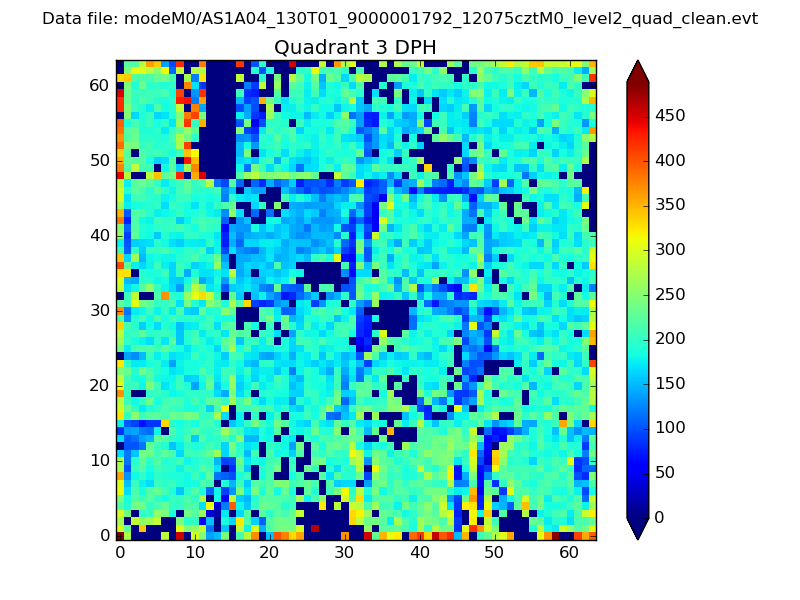 |
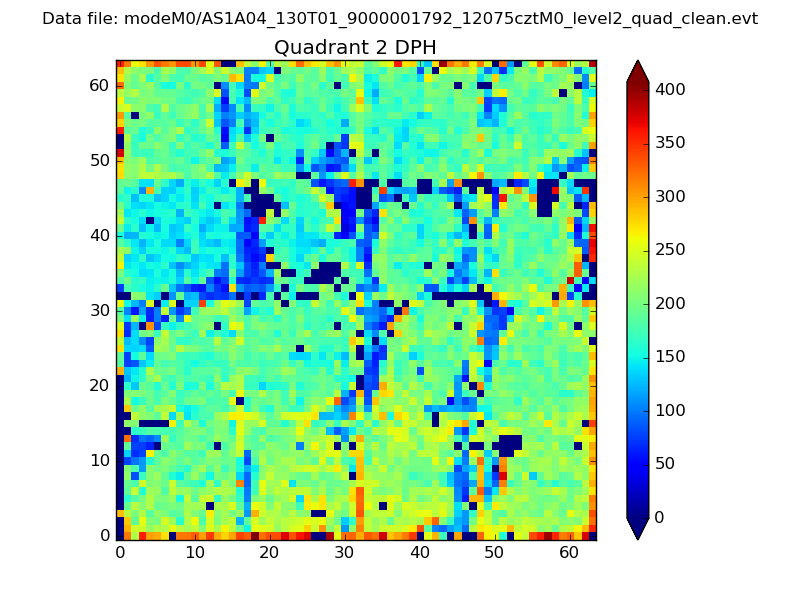 |
Quadrant C |
| Plot type | Count rate plots | Images |
|---|---|---|
| Comparison with Poisson distribution Blue bars denote a histogram of data divided into 1 sec bins. Red curve is a Poisson curve with rate = median count rate of data. |
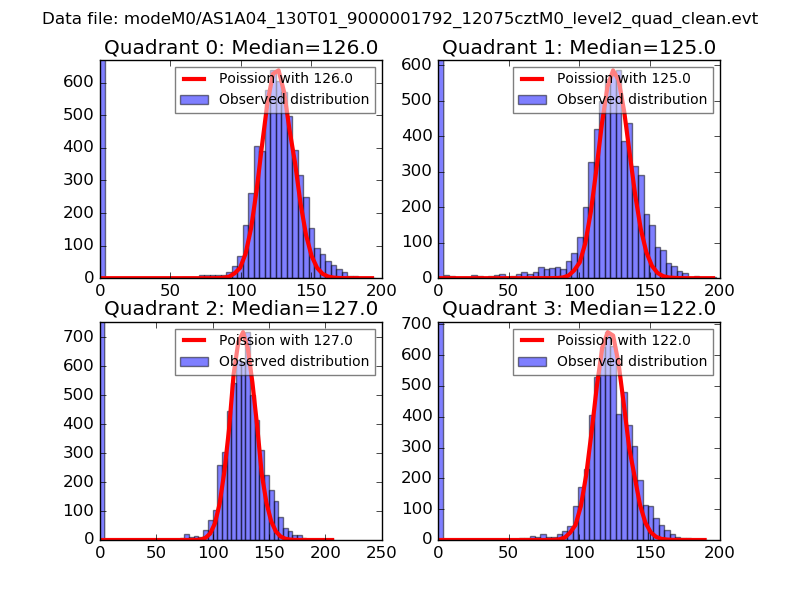 |
 |
| Quadrant-wise count rates Data is divided into 100 sec bins |
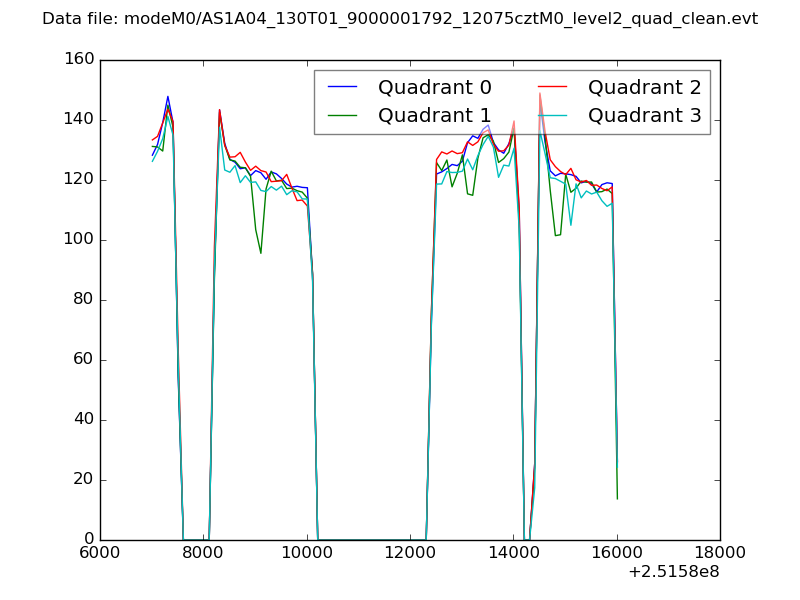 |
|
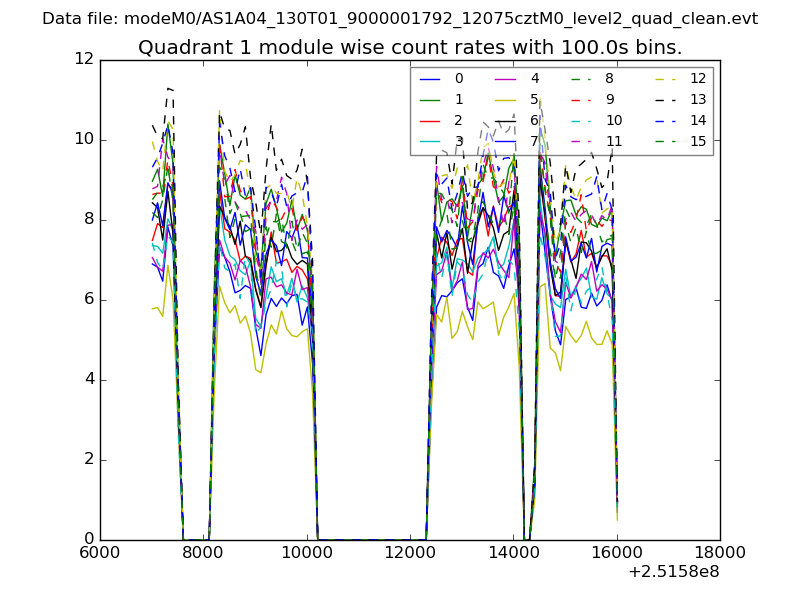
| Module-wise count rates for Quadrant A Data is divided into 100 sec bins |
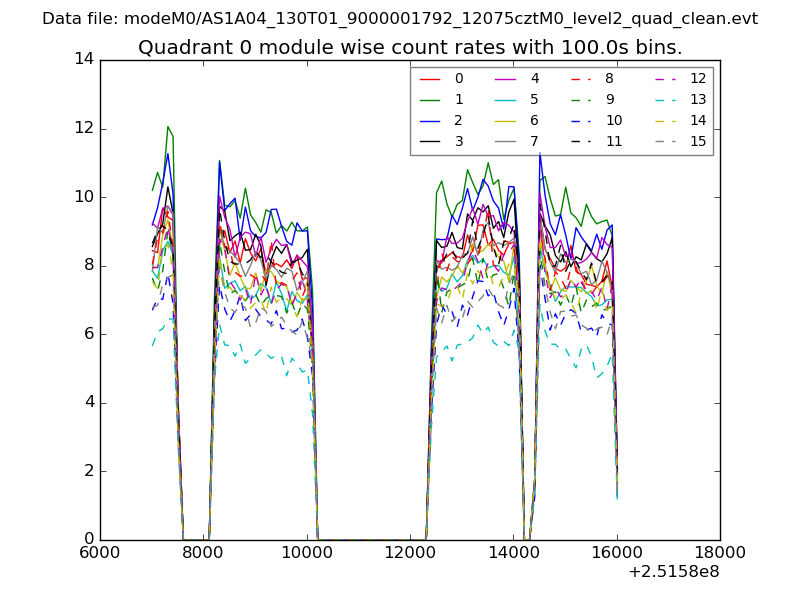 |
 |
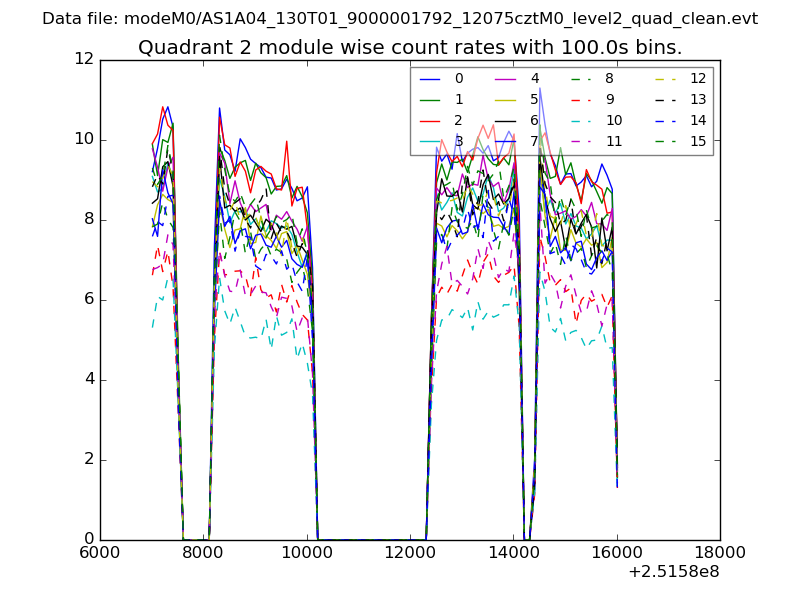
| Module-wise count rates for Quadrant B Data is divided into 100 sec bins |
 |
 |
| Module-wise count rates for Quadrant C Data is divided into 100 sec bins |
 |
 |
| Module-wise count rates for Quadrant D Data is divided into 100 sec bins |
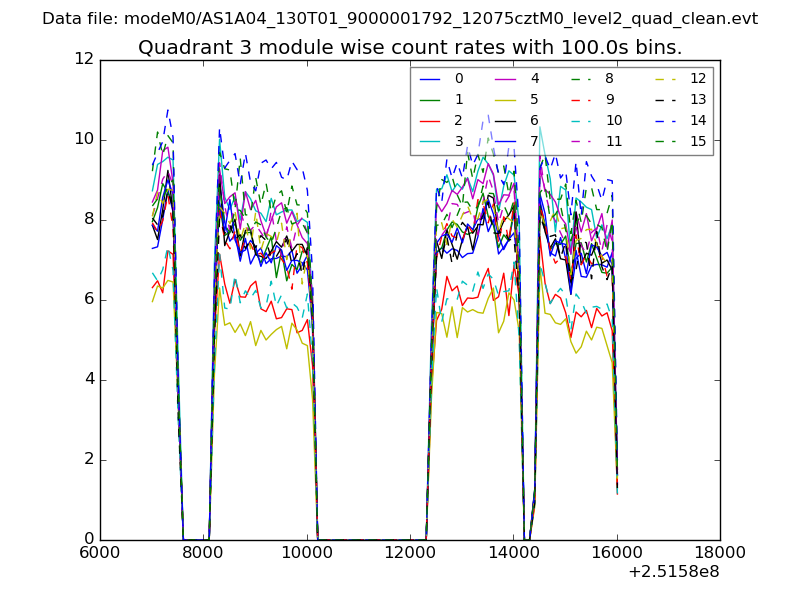 |
 |
| Parameter | Plot |
|---|---|
| CZT HV Monitor | 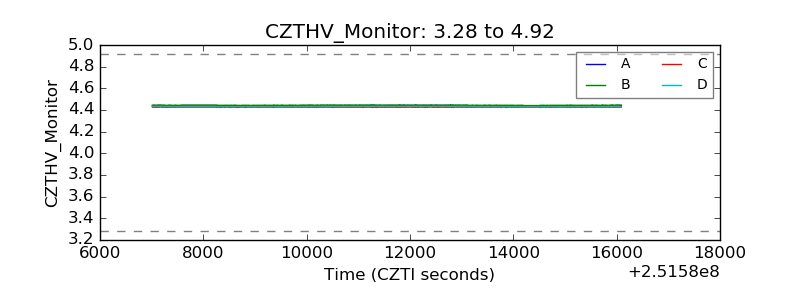 |
| D_VDD | 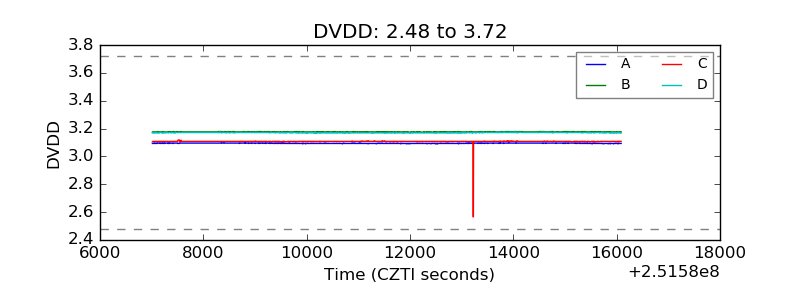 |
| Temperature 1 | 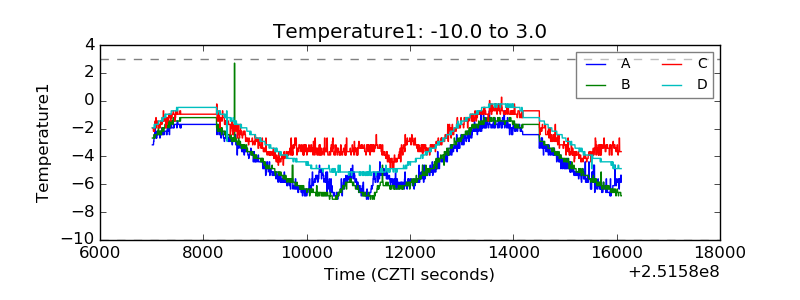 |
| Veto HV Monitor | 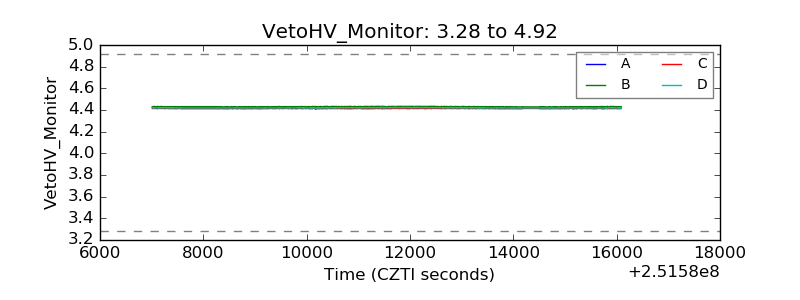 |
| Veto LLD | 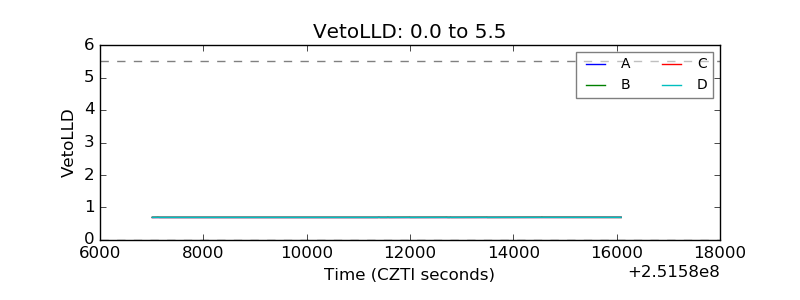 |
| Alpha Counter | 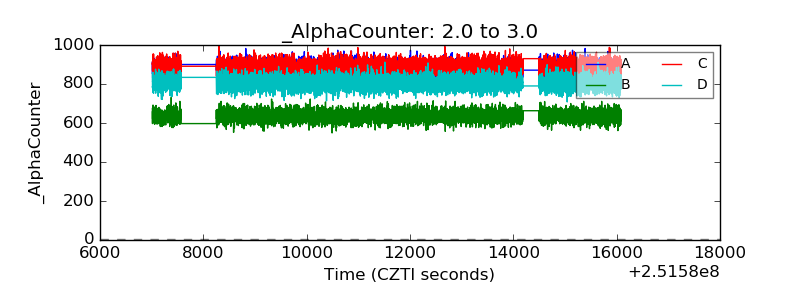 |
| _CPM_Rate | 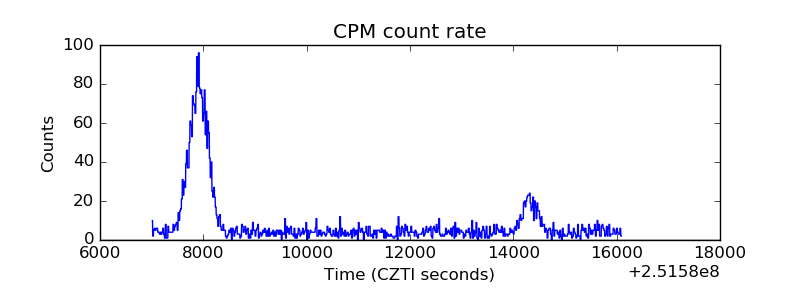 |
| CZT Counter | 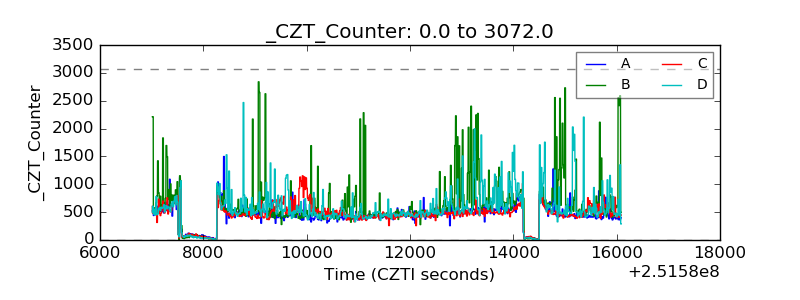 |
| +2.5 Volts monitor |  |
| +5 Volts monitor |  |
| _ROLL_ROT | 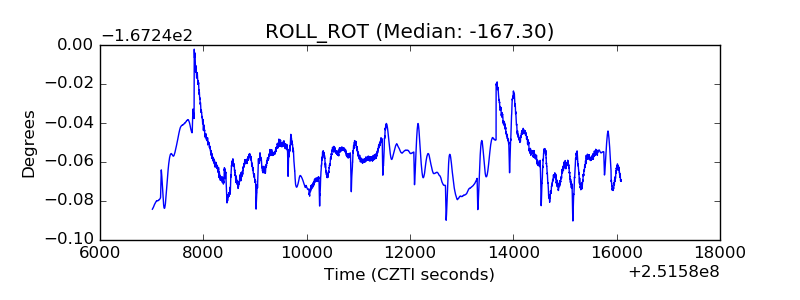 |
| _Roll_DEC | 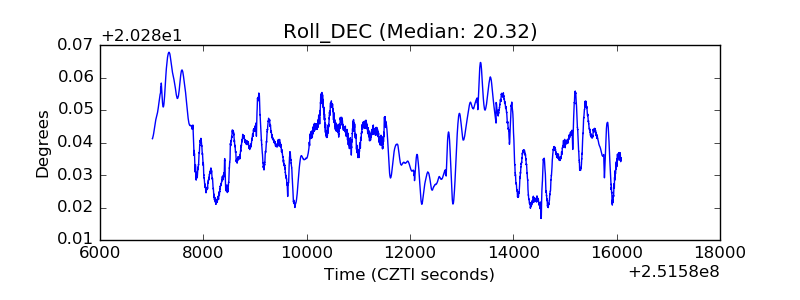 |
| _Roll_RA | 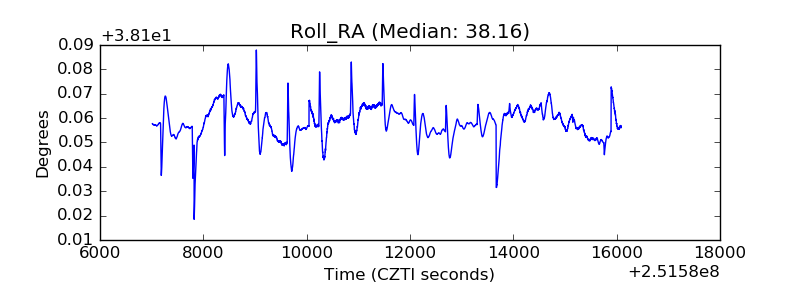 |
| Veto Counter |  |