| Param | Original file | Final file |
|---|---|---|
| Filename | modeM0/AS1A04_130T01_9000001792_12076cztM0_level2.evt | modeM0/AS1A04_130T01_9000001792_12076cztM0_level2_quad_clean.evt |
| Size (bytes) | 677,030,400 | 112,000,320 |
| Size | 645.7 MB | 106.8 MB |
| Events in quadrant A | 4,271,434 | 713,705 |
| Events in quadrant B | 6,093,415 | 693,352 |
| Events in quadrant C | 4,053,084 | 717,998 |
| Events in quadrant D | 5,518,451 | 684,434 |
| Mode M0 | |||
|---|---|---|---|
| Quadrant | BADHDUFLAG | Total packets | Discarded packets |
| A | 0 | 18414 | 3 |
| B | 0 | 23796 | 2 |
| C | 0 | 17710 | 2 |
| D | 0 | 21796 | 2 |
| Mode M9 | |||
|---|---|---|---|
| Quadrant | BADHDUFLAG | Total packets | Discarded packets |
| A | 0 | 6 | 0 |
| B | 0 | 6 | 0 |
| C | 0 | 6 | 0 |
| D | 0 | 6 | 0 |
| Mode SS | |||
|---|---|---|---|
| Quadrant | BADHDUFLAG | Total packets | Discarded packets |
| A | 0 | 170 | 0 |
| B | 0 | 170 | 0 |
| C | 0 | 170 | 0 |
| D | 0 | 170 | 0 |
| Quadrant | Total seconds | Saturated seconds | Saturation percentage |
|---|---|---|---|
| A | 8386 | 125 | 1.490580% |
| B | 8386 | 675 | 8.049130% |
| C | 8386 | 40 | 0.476985% |
| D | 8386 | 279 | 3.326974% |
Noise dominated data is calculated using 1-second bins in cleaned event files. If a bin has >2000 counts, and if more than 50% of those come from <1% of pixels, then it is considered to be noise-dominated and hence unusable.
| Quadrant | # 1 sec bins | Bins with >0 counts | Bins with >2000 counts | High rate bins dominated by noise | Noise dominated (total time) | Noise dominated (detector-on time) | Marked lightcurve |
|---|---|---|---|---|---|---|---|
| A | 8872 | 8388 | 10 | 10 | 0.11% | 0.12% |  |
| B | 8872 | 8389 | 345 | 345 | 3.89% | 4.11% |  |
| C | 8872 | 8389 | 1 | 1 | 0.01% | 0.01% | 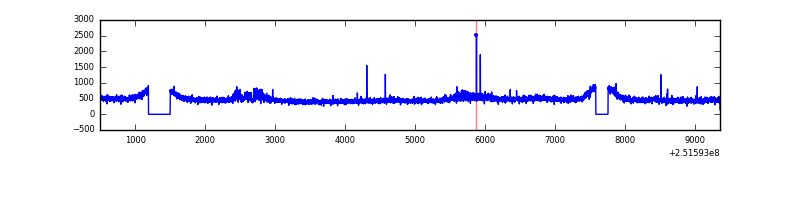 |
| D | 8872 | 8389 | 154 | 154 | 1.74% | 1.84% |  |
Top three noisy pixels from each quadrant. If the there are fewer than three noisy pixels in the level2.evt file, extra rows are filled as -1
| Pixel properties | Quadrant properties | ||||||
|---|---|---|---|---|---|---|---|
| Quadrant | DetID | PixID | Counts | Sigma | Mean | Median | Sigma |
| A | 3 | 1 | 113911 | 541.68 | 1017 | 992 | 208.5 |
| A | 13 | 251 | 60617 | 286.03 | 1017 | 992 | 208.5 |
| A | 1 | 162 | 58368 | 275.24 | 1017 | 992 | 208.5 |
| B | 4 | 239 | 1446304 | 7534.6 | 996 | 971 | 191.8 |
| B | 0 | 231 | 208207 | 1080.33 | 996 | 971 | 191.8 |
| B | 15 | 204 | 205102 | 1064.15 | 996 | 971 | 191.8 |
| C | 8 | 208 | 166633 | 716.44 | 993 | 998 | 231.2 |
| C | 14 | 234 | 9972 | 38.82 | 993 | 998 | 231.2 |
| C | 13 | 61 | 7176 | 26.72 | 993 | 998 | 231.2 |
| D | 1 | 52 | 1142534 | 4766.25 | 983 | 952 | 239.5 |
| D | 8 | 195 | 291345 | 1212.43 | 983 | 952 | 239.5 |
| D | 13 | 249 | 122384 | 506.99 | 983 | 952 | 239.5 |
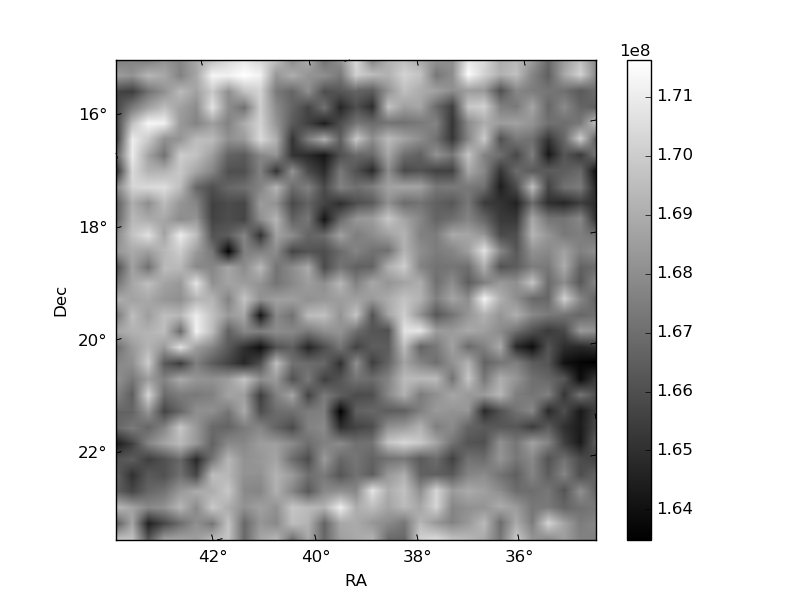
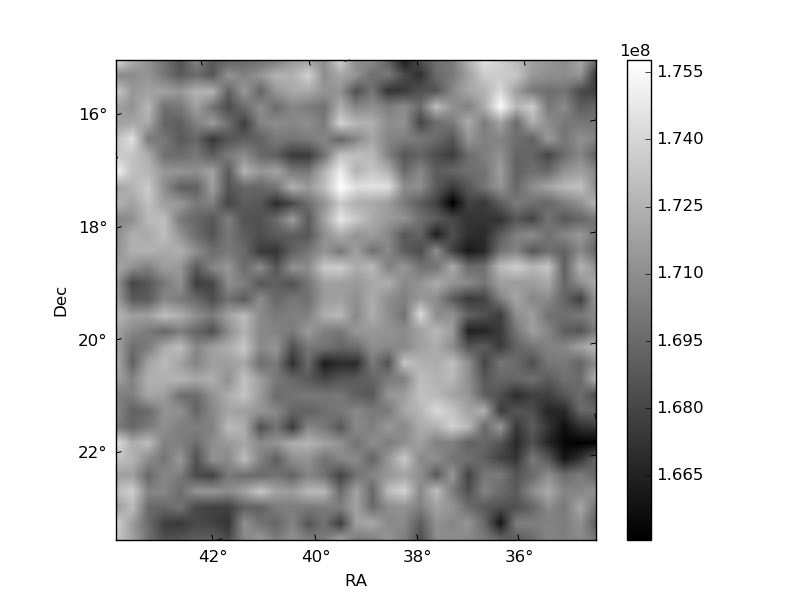
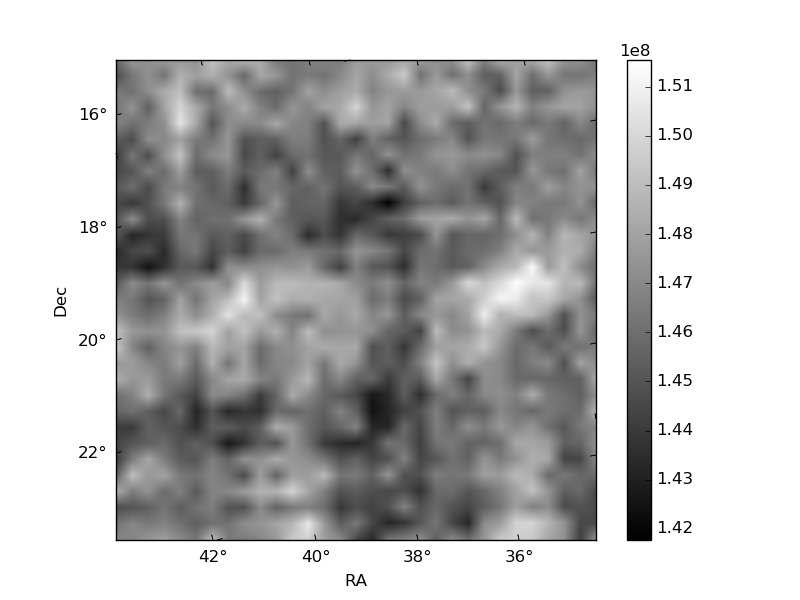
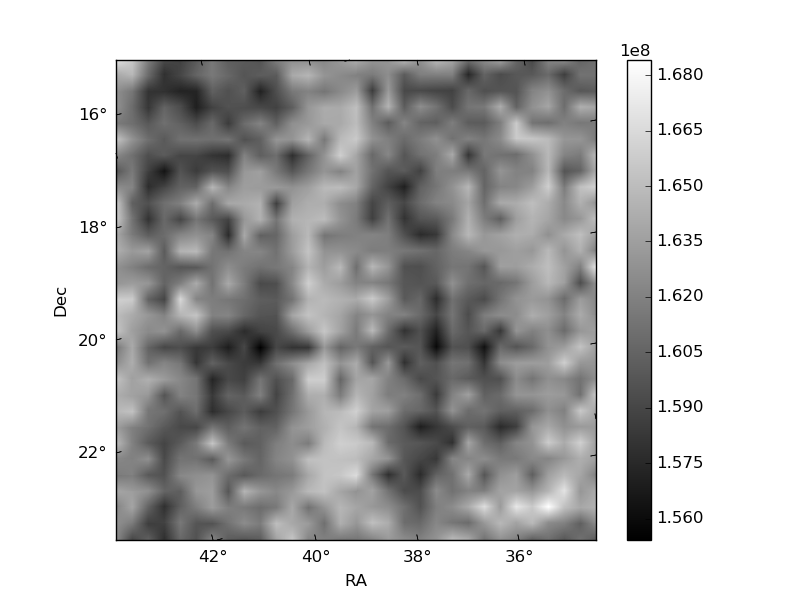
Histogram calculated using DETX and DETY for each event in the final _common_clean file
| Quadrant A |  |
 |
Quadrant B |
|---|---|---|---|
| Quadrant D | 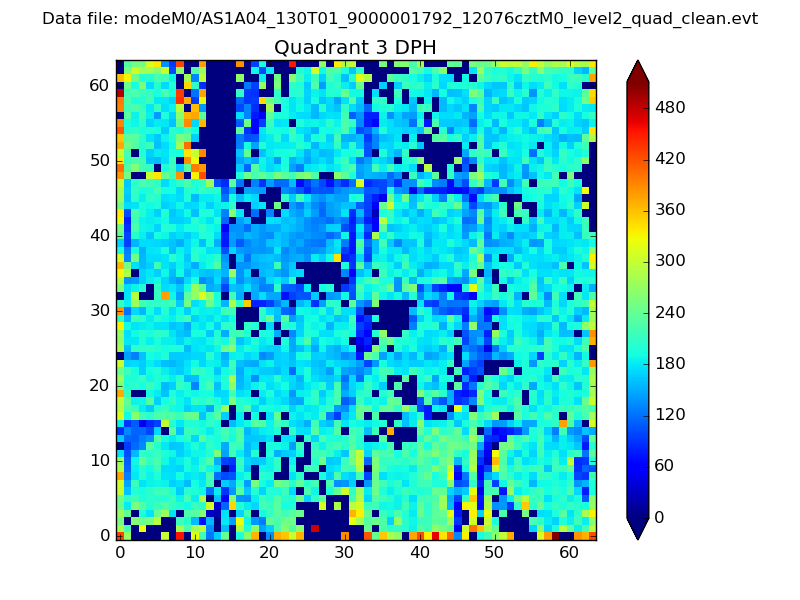 |
 |
Quadrant C |
| Plot type | Count rate plots | Images |
|---|---|---|
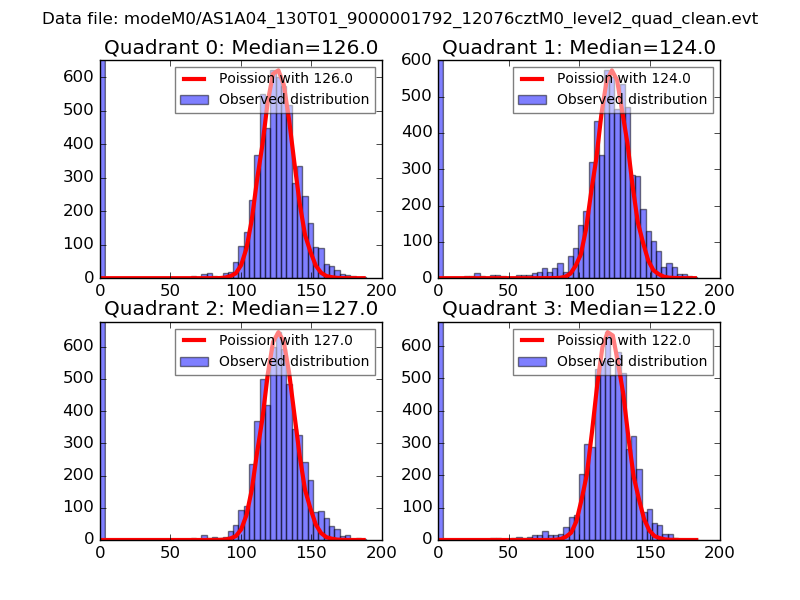
| Comparison with Poisson distribution Blue bars denote a histogram of data divided into 1 sec bins. Red curve is a Poisson curve with rate = median count rate of data. |
 |
 |
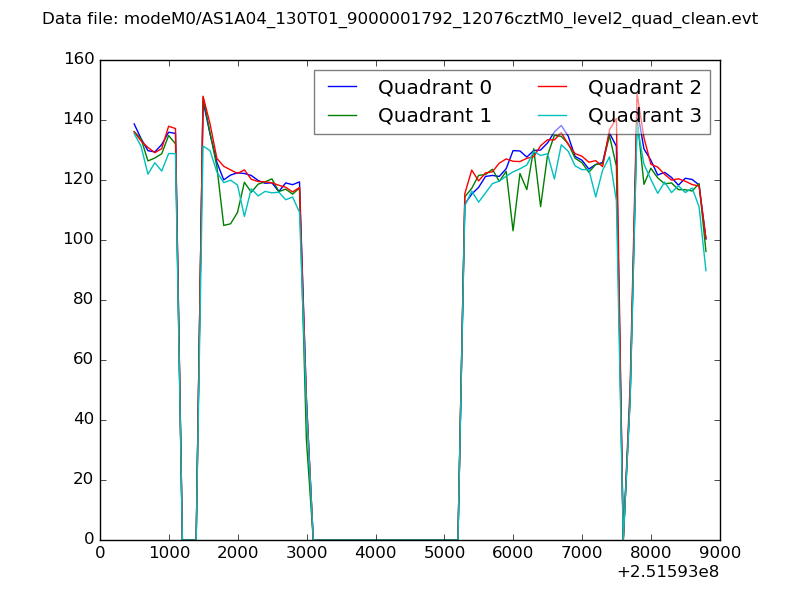
| Quadrant-wise count rates Data is divided into 100 sec bins |
 |
|
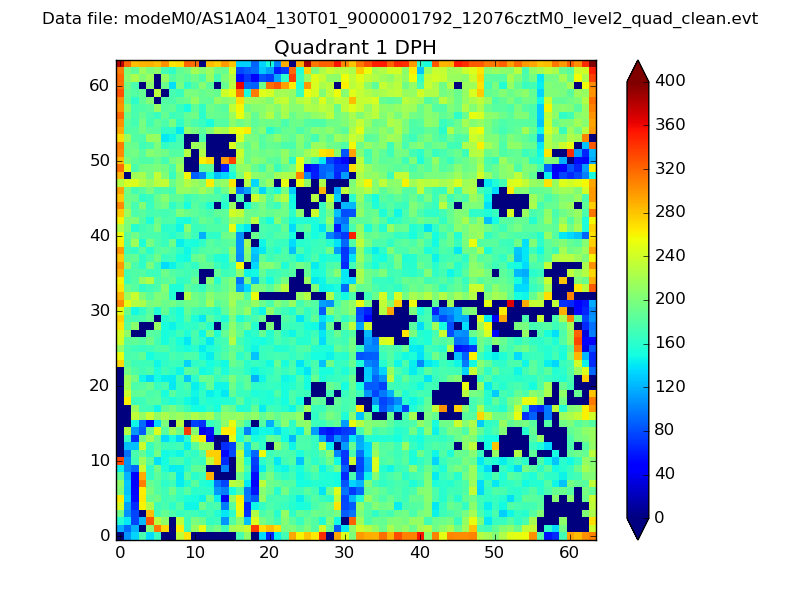
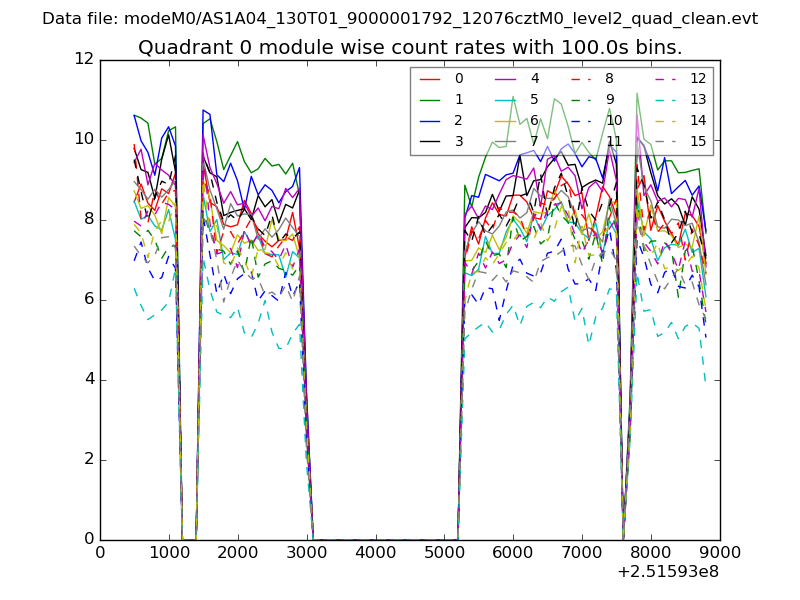
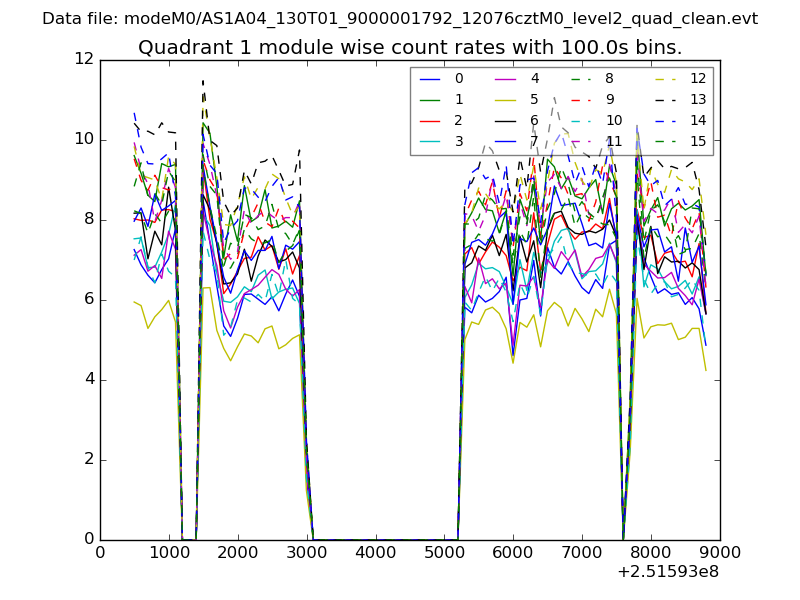
| Module-wise count rates for Quadrant A Data is divided into 100 sec bins |
 |
 |
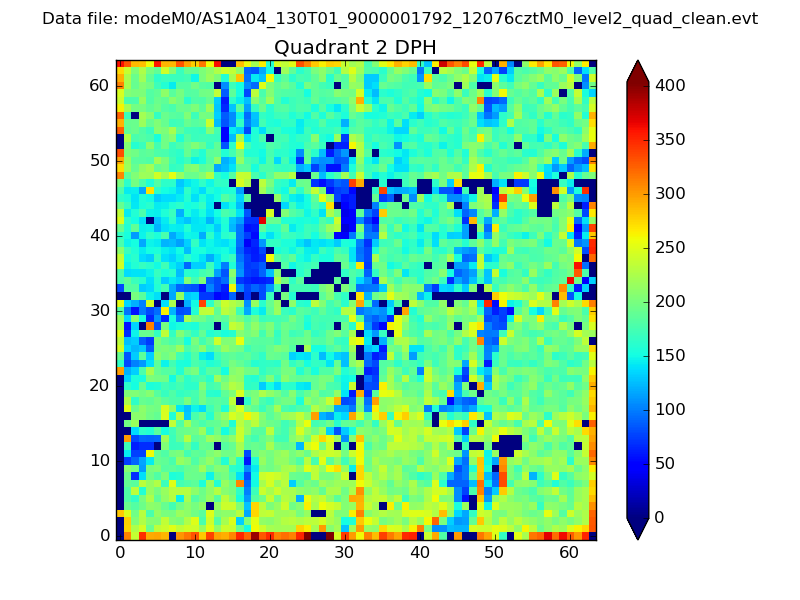
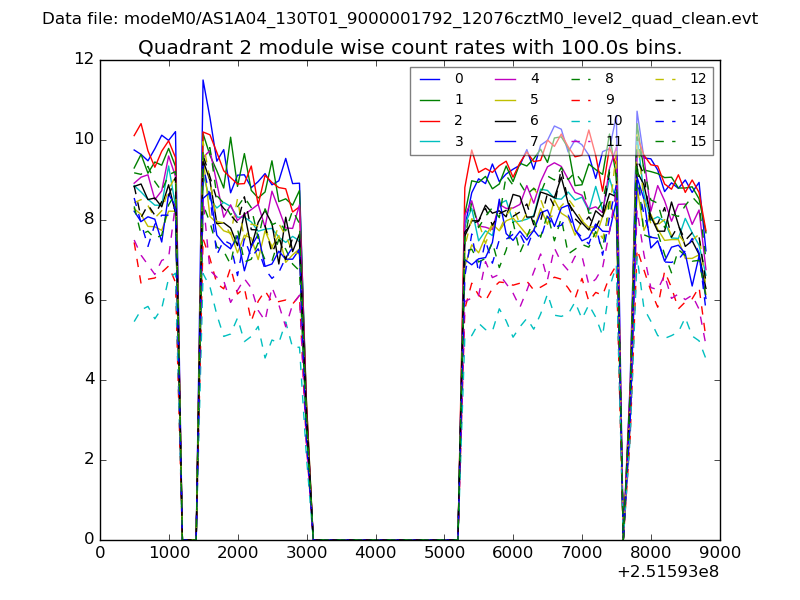
| Module-wise count rates for Quadrant B Data is divided into 100 sec bins |
 |
 |
| Module-wise count rates for Quadrant C Data is divided into 100 sec bins |
 |
 |
| Module-wise count rates for Quadrant D Data is divided into 100 sec bins |
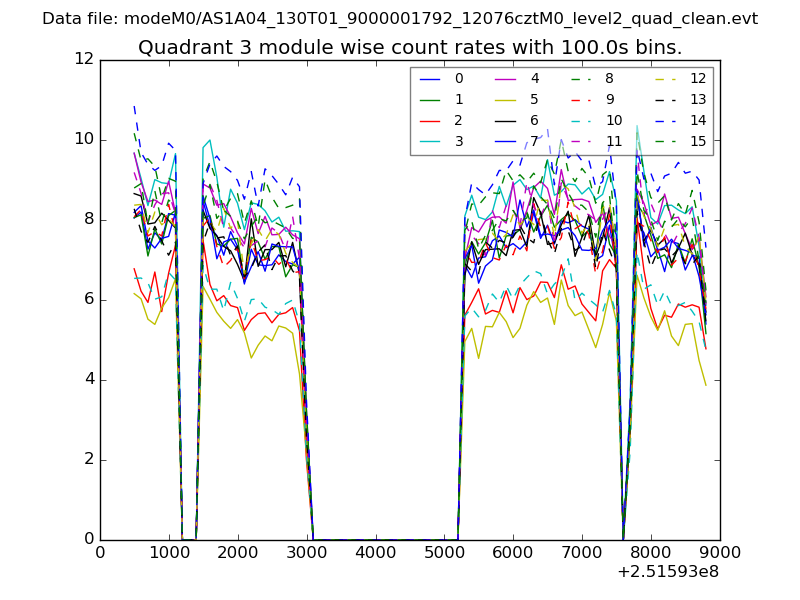 |
 |
| Parameter | Plot |
|---|---|
| CZT HV Monitor | 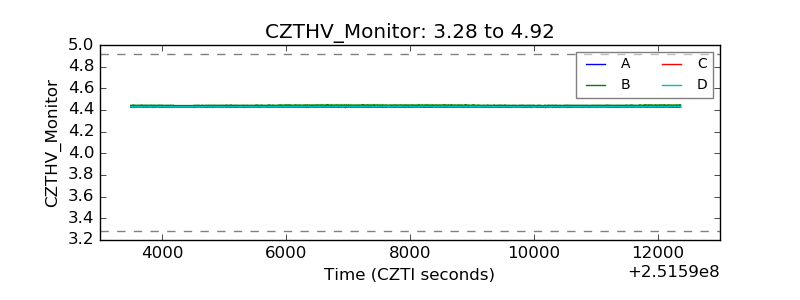 |
| D_VDD | 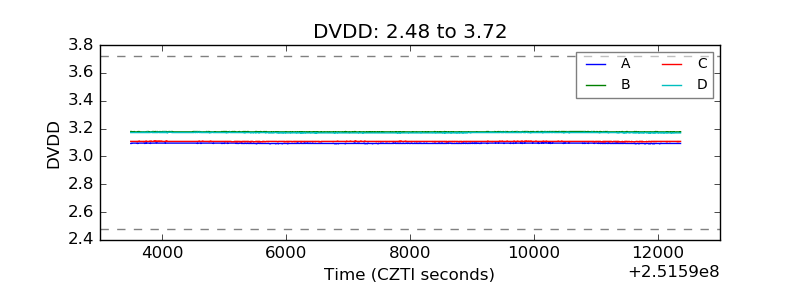 |
| Temperature 1 | 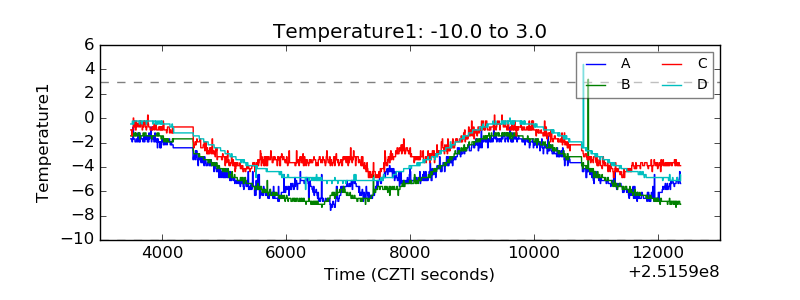 |
| Veto HV Monitor | 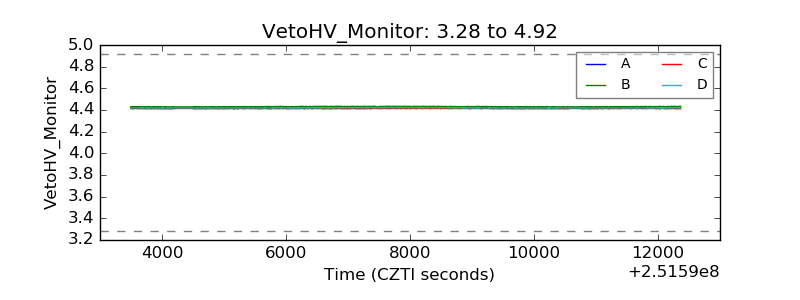 |
| Veto LLD | 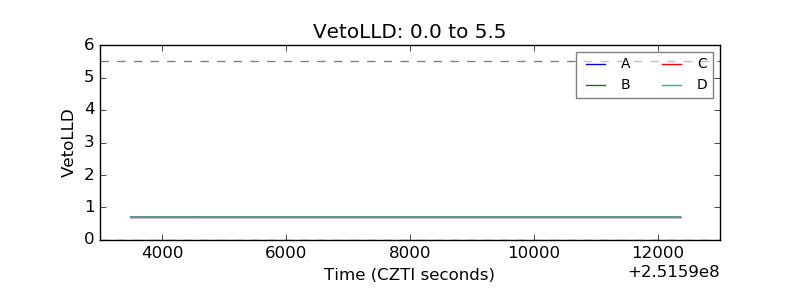 |
| Alpha Counter | 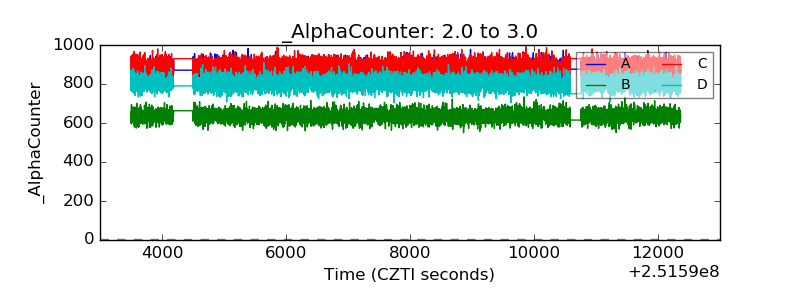 |
| _CPM_Rate | 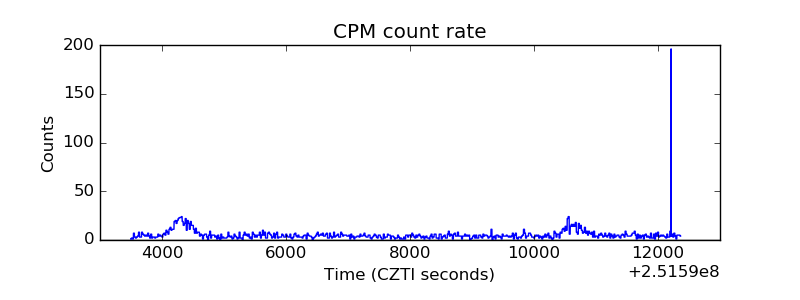 |
| CZT Counter | 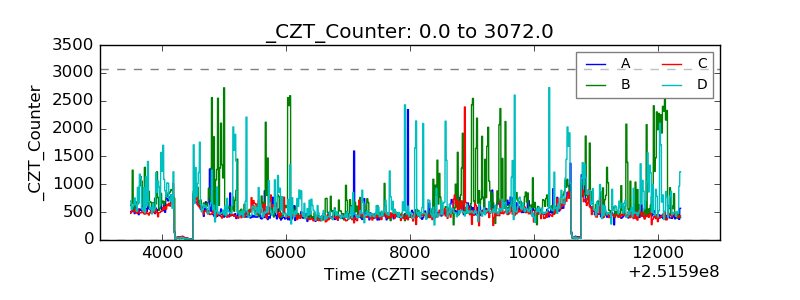 |
| +2.5 Volts monitor |  |
| +5 Volts monitor |  |
| _ROLL_ROT | 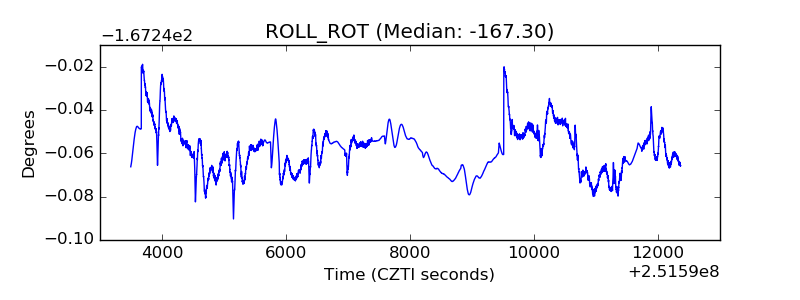 |
| _Roll_DEC | 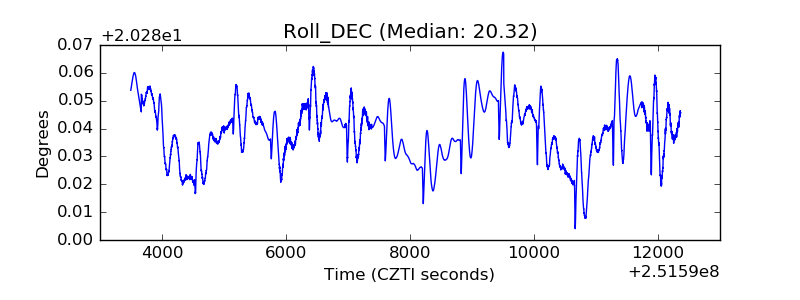 |
| _Roll_RA | 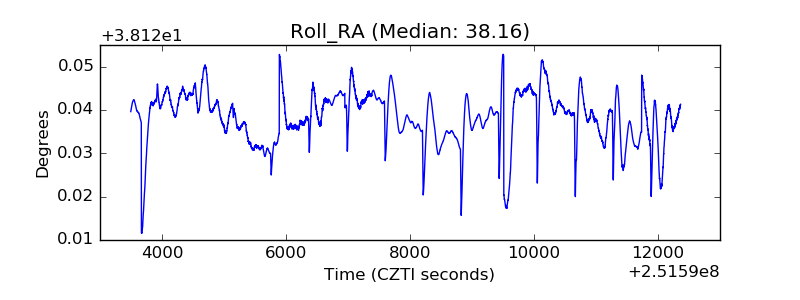 |
| Veto Counter | 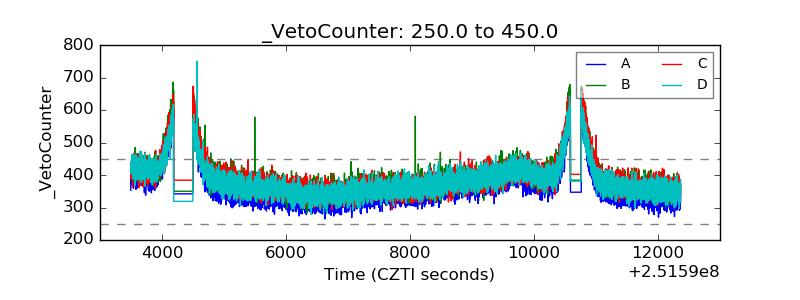 |