| Param | Original file | Final file |
|---|---|---|
| Filename | modeM0/AS1A04_130T01_9000001792_12079cztM0_level2.evt | modeM0/AS1A04_130T01_9000001792_12079cztM0_level2_quad_clean.evt |
| Size (bytes) | 979,021,440 | 133,407,360 |
| Size | 933.7 MB | 127.2 MB |
| Events in quadrant A | 6,054,225 | 806,214 |
| Events in quadrant B | 8,788,961 | 777,651 |
| Events in quadrant C | 5,675,354 | 814,825 |
| Events in quadrant D | 8,283,167 | 773,988 |
| Mode M0 | |||
|---|---|---|---|
| Quadrant | BADHDUFLAG | Total packets | Discarded packets |
| A | 0 | 26204 | 3 |
| B | 0 | 34258 | 2 |
| C | 0 | 25475 | 2 |
| D | 0 | 32548 | 2 |
| Mode M9 | |||
|---|---|---|---|
| Quadrant | BADHDUFLAG | Total packets | Discarded packets |
| A | 0 | 13 | 0 |
| B | 0 | 13 | 0 |
| C | 0 | 13 | 0 |
| D | 0 | 13 | 0 |
| Mode SS | |||
|---|---|---|---|
| Quadrant | BADHDUFLAG | Total packets | Discarded packets |
| A | 0 | 254 | 0 |
| B | 0 | 254 | 0 |
| C | 0 | 254 | 0 |
| D | 0 | 254 | 0 |
| Quadrant | Total seconds | Saturated seconds | Saturation percentage |
|---|---|---|---|
| A | 12545 | 119 | 0.948585% |
| B | 12545 | 797 | 6.353129% |
| C | 12545 | 58 | 0.462336% |
| D | 12545 | 402 | 3.204464% |
Noise dominated data is calculated using 1-second bins in cleaned event files. If a bin has >2000 counts, and if more than 50% of those come from <1% of pixels, then it is considered to be noise-dominated and hence unusable.
| Quadrant | # 1 sec bins | Bins with >0 counts | Bins with >2000 counts | High rate bins dominated by noise | Noise dominated (total time) | Noise dominated (detector-on time) | Marked lightcurve |
|---|---|---|---|---|---|---|---|
| A | 13831 | 12547 | 12 | 12 | 0.09% | 0.10% | 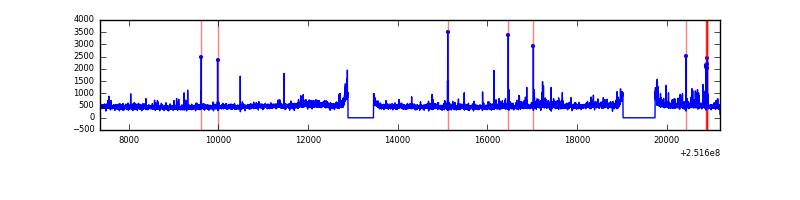 |
| B | 13831 | 12547 | 424 | 424 | 3.07% | 3.38% | 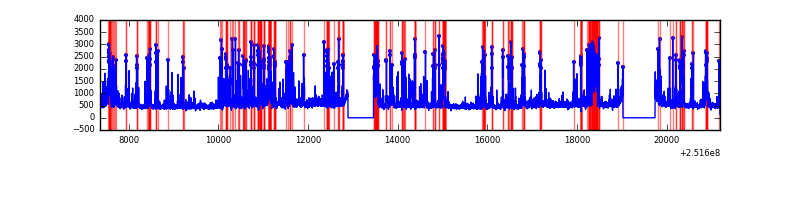 |
| C | 13831 | 12548 | 2 | 2 | 0.01% | 0.02% | 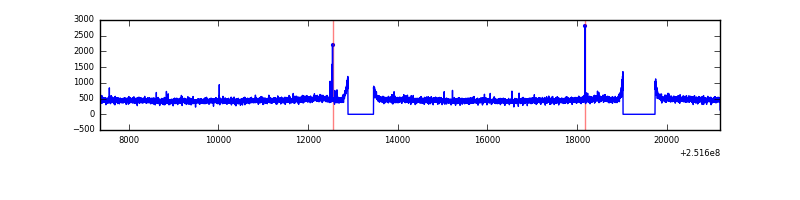 |
| D | 13831 | 12548 | 326 | 326 | 2.36% | 2.60% | 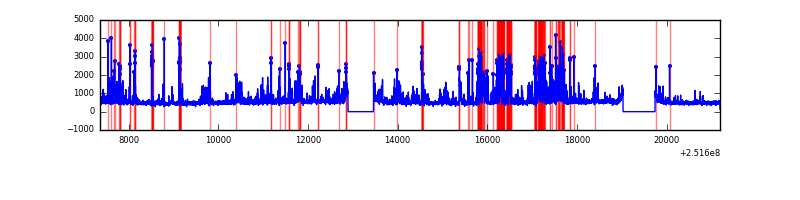 |
Top three noisy pixels from each quadrant. If the there are fewer than three noisy pixels in the level2.evt file, extra rows are filled as -1
| Pixel properties | Quadrant properties | ||||||
|---|---|---|---|---|---|---|---|
| Quadrant | DetID | PixID | Counts | Sigma | Mean | Median | Sigma |
| A | 1 | 162 | 99149 | 324.43 | 1481 | 1450 | 301.1 |
| A | 14 | 63 | 57641 | 186.6 | 1481 | 1450 | 301.1 |
| A | 1 | 178 | 39465 | 126.24 | 1481 | 1450 | 301.1 |
| B | 4 | 239 | 2480377 | 8847.4 | 1455 | 1416 | 280.2 |
| B | 0 | 231 | 201830 | 715.28 | 1455 | 1416 | 280.2 |
| B | 15 | 204 | 186550 | 660.74 | 1455 | 1416 | 280.2 |
| C | 8 | 208 | 14688 | 39.02 | 1448 | 1458 | 339.1 |
| C | 14 | 234 | 12898 | 33.74 | 1448 | 1458 | 339.1 |
| C | 13 | 61 | 10661 | 27.14 | 1448 | 1458 | 339.1 |
| D | 1 | 52 | 1666342 | 4781.68 | 1428 | 1387 | 348.2 |
| D | 8 | 195 | 543070 | 1555.69 | 1428 | 1387 | 348.2 |
| D | 10 | 50 | 106911 | 303.06 | 1428 | 1387 | 348.2 |
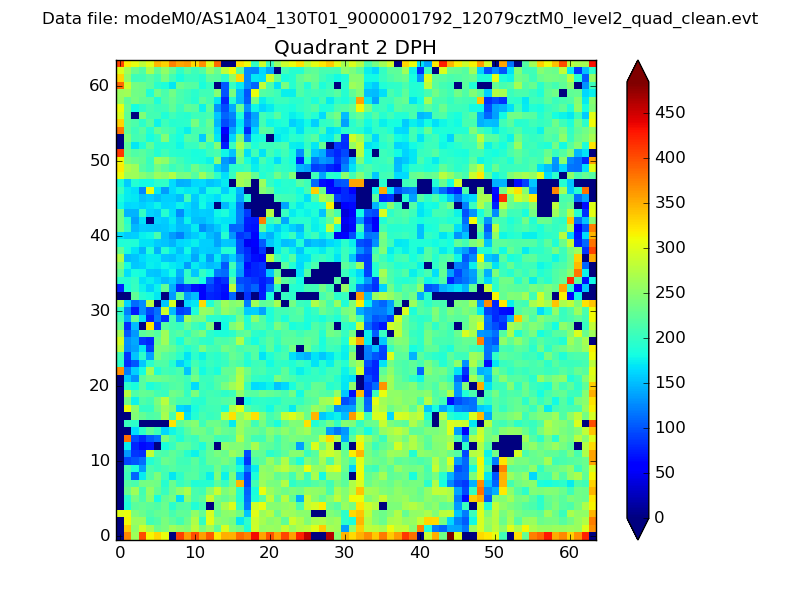
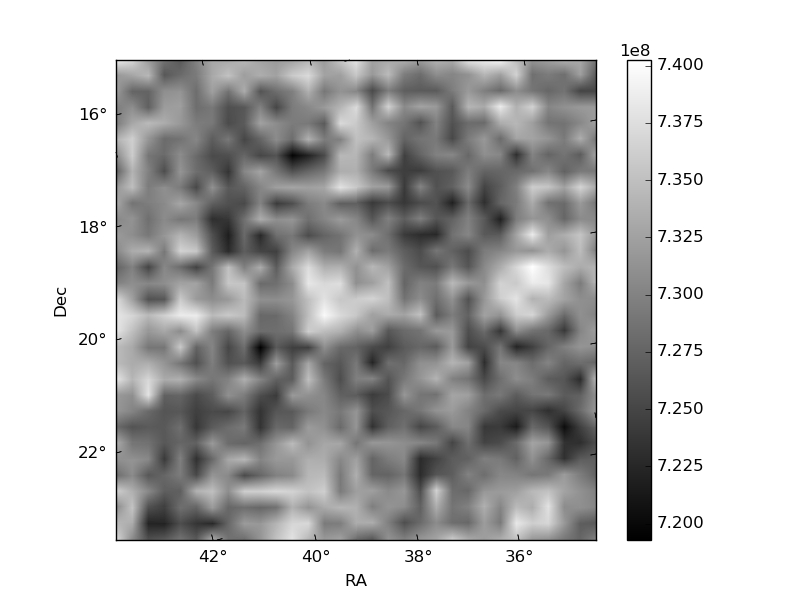
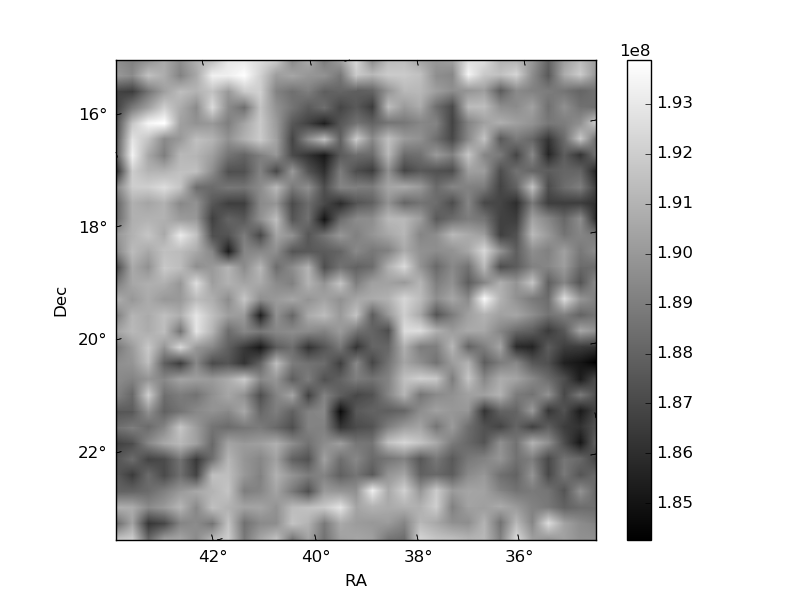
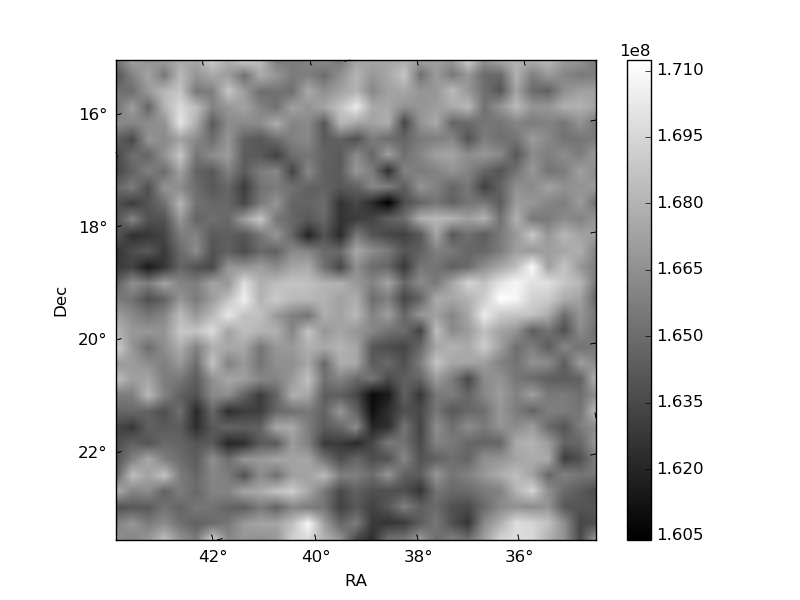
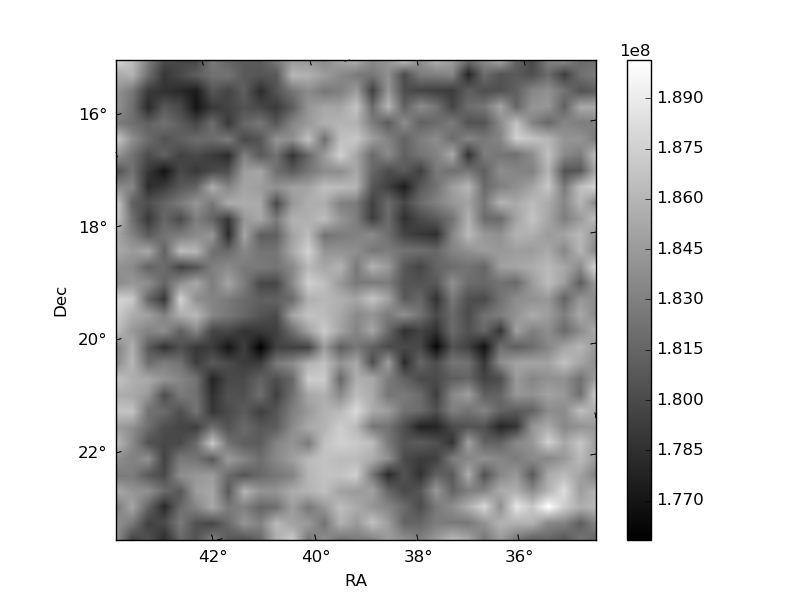
Histogram calculated using DETX and DETY for each event in the final _common_clean file
| Quadrant A | 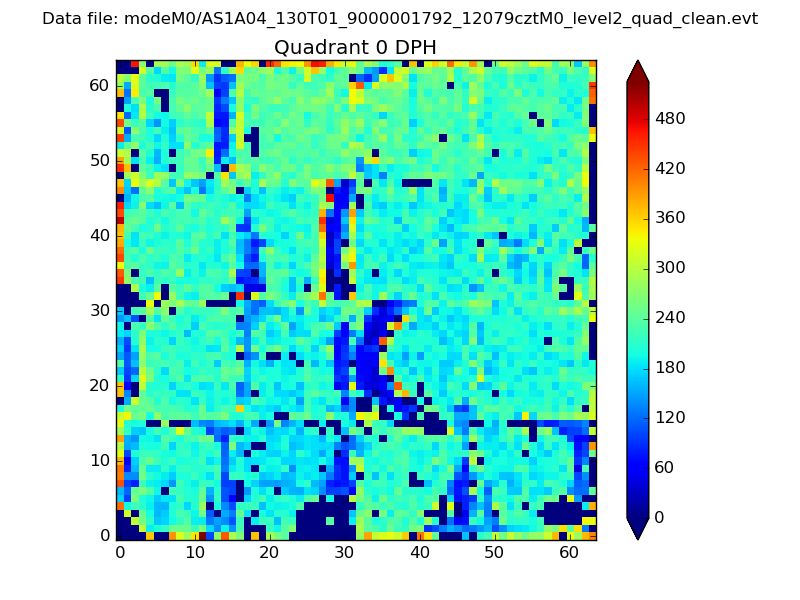 |
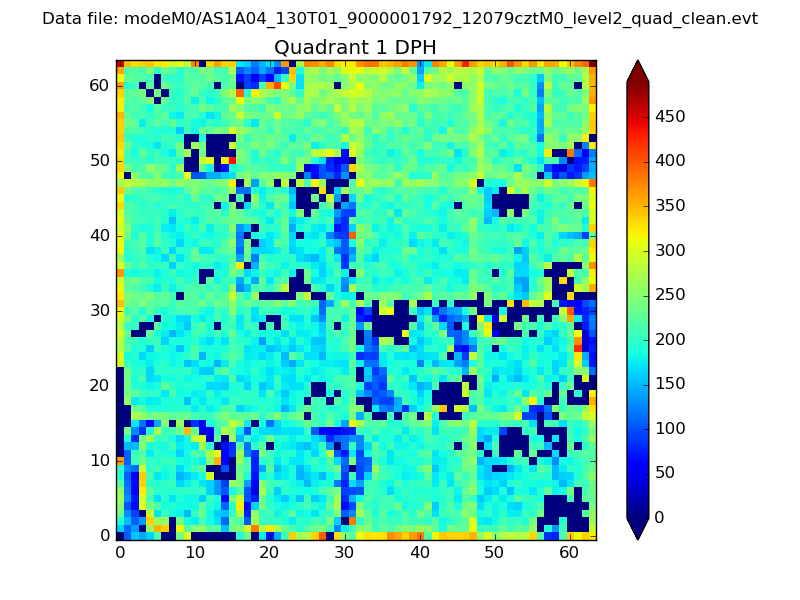 |
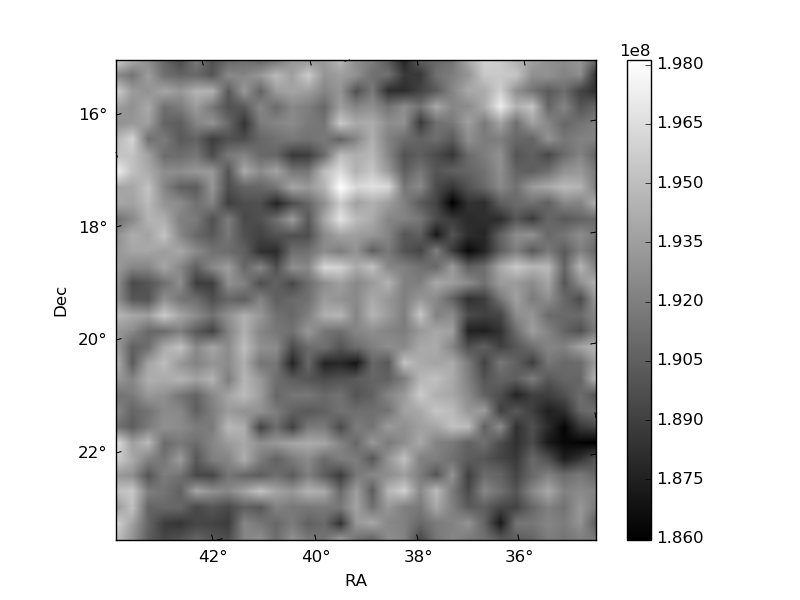
Quadrant B |
|---|---|---|---|
| Quadrant D | 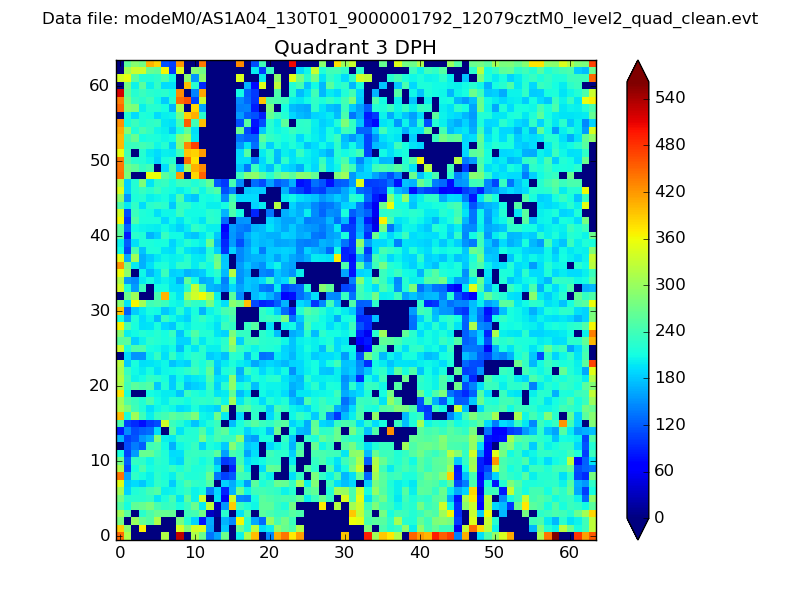 |
 |
Quadrant C |
| Plot type | Count rate plots | Images |
|---|---|---|
| Comparison with Poisson distribution Blue bars denote a histogram of data divided into 1 sec bins. Red curve is a Poisson curve with rate = median count rate of data. |
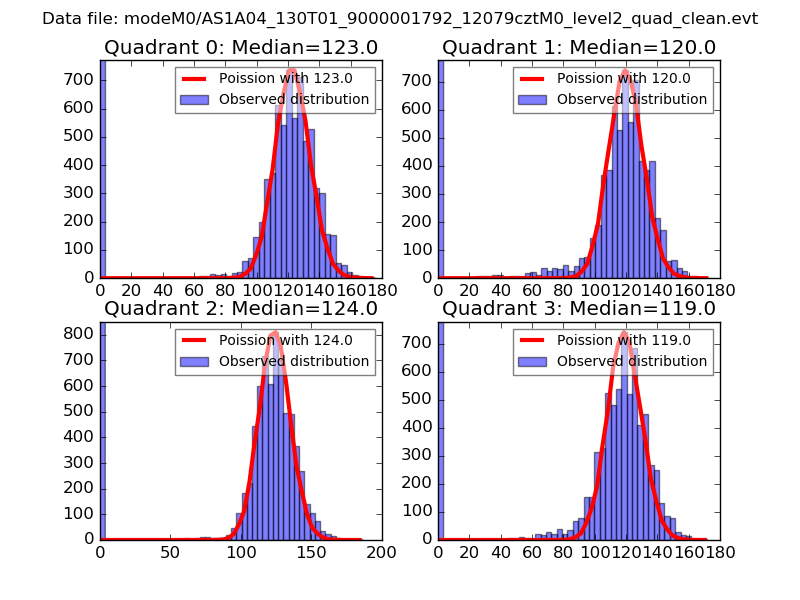 |
 |
| Quadrant-wise count rates Data is divided into 100 sec bins |
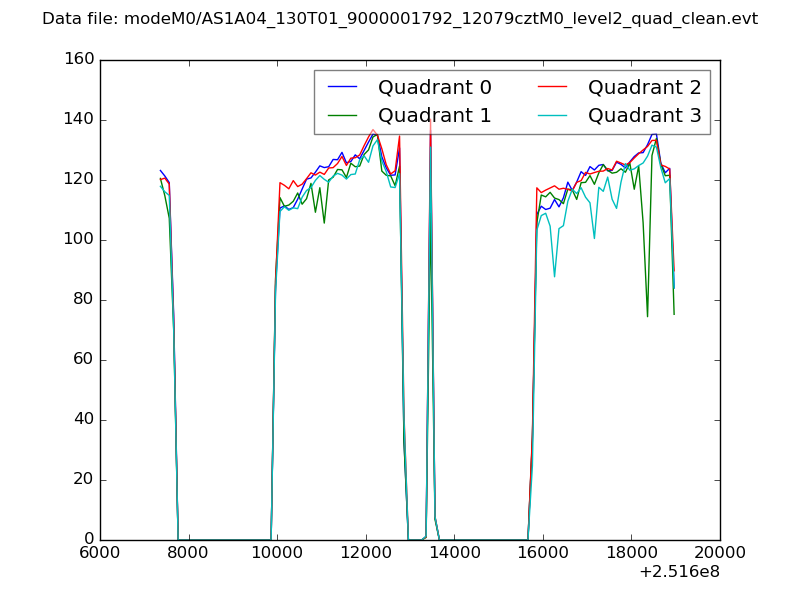 |
|
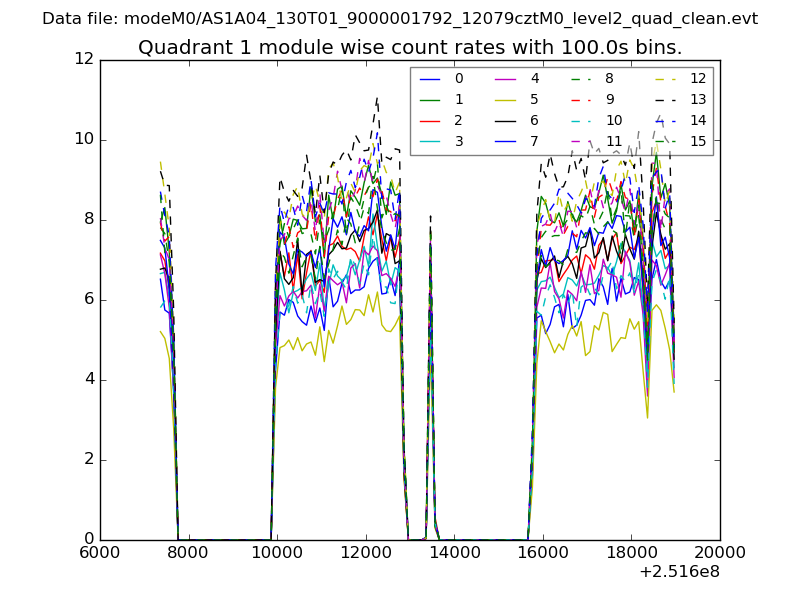
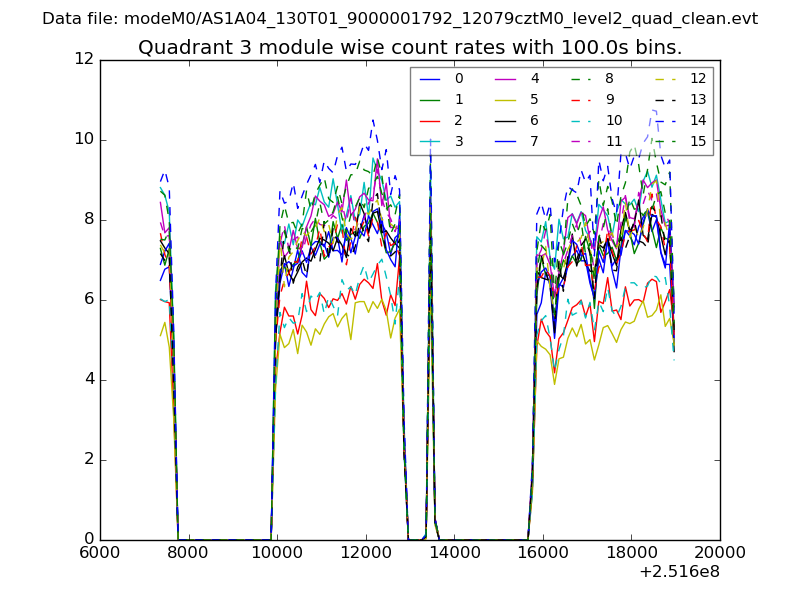
| Module-wise count rates for Quadrant A Data is divided into 100 sec bins |
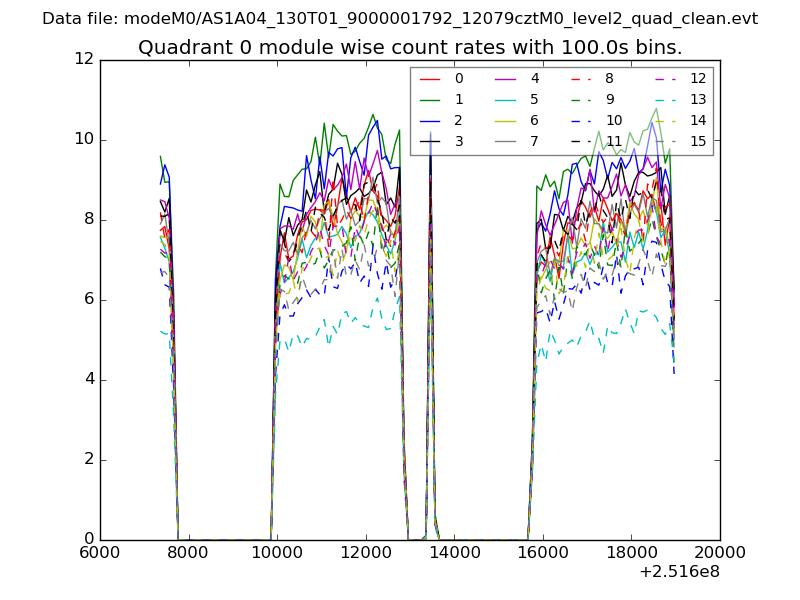 |
 |
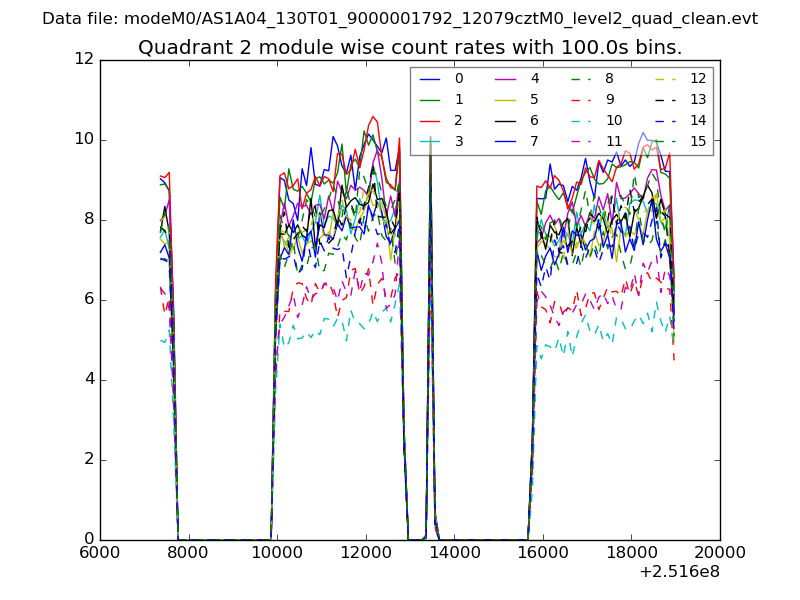
| Module-wise count rates for Quadrant B Data is divided into 100 sec bins |
 |
 |
| Module-wise count rates for Quadrant C Data is divided into 100 sec bins |
 |
 |
| Module-wise count rates for Quadrant D Data is divided into 100 sec bins |
 |
 |
| Parameter | Plot |
|---|---|
| CZT HV Monitor | 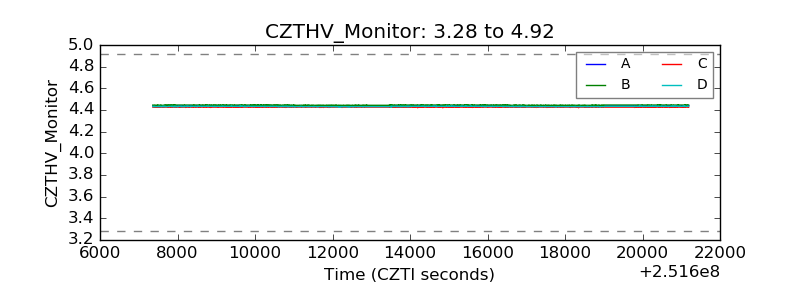 |
| D_VDD | 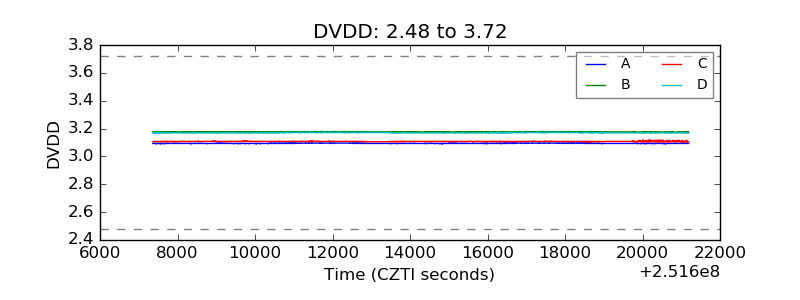 |
| Temperature 1 | 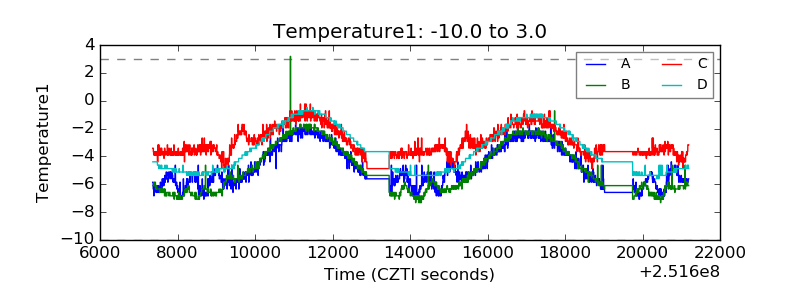 |
| Veto HV Monitor | 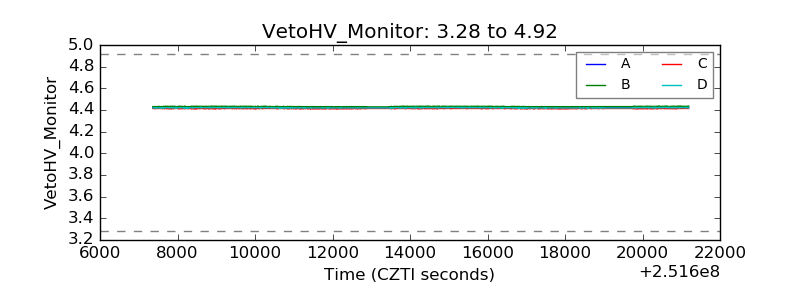 |
| Veto LLD | 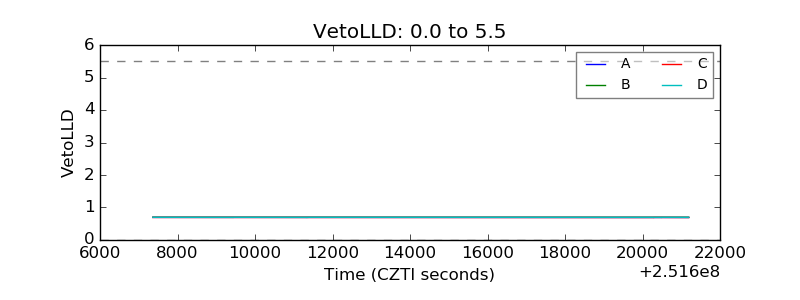 |
| Alpha Counter | 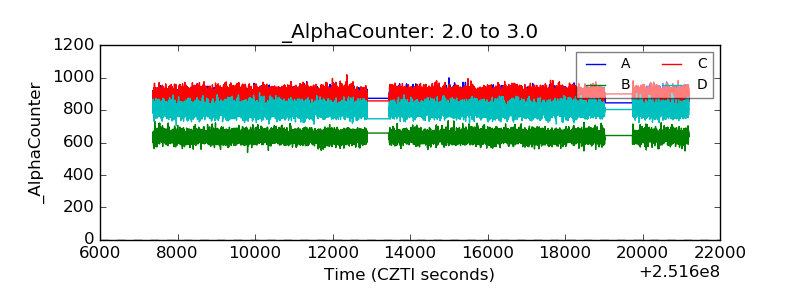 |
| _CPM_Rate | 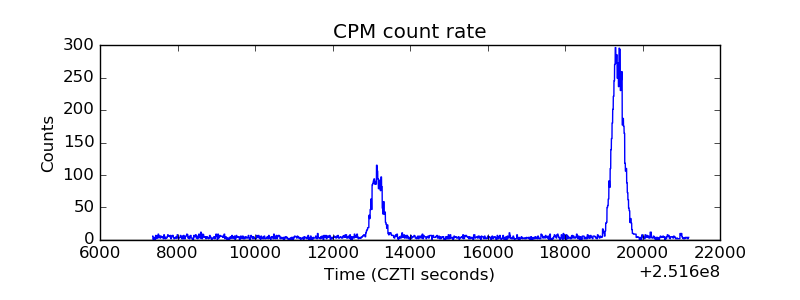 |
| CZT Counter | 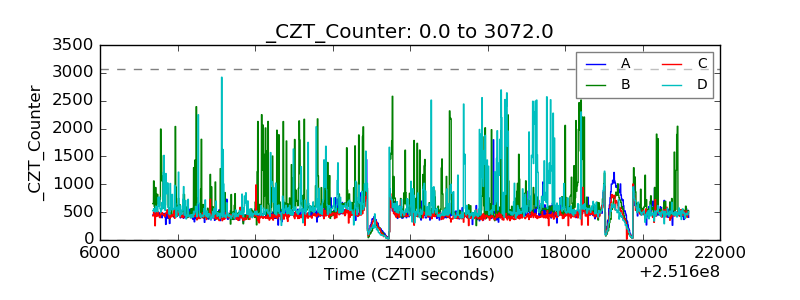 |
| +2.5 Volts monitor |  |
| +5 Volts monitor |  |
| _ROLL_ROT | 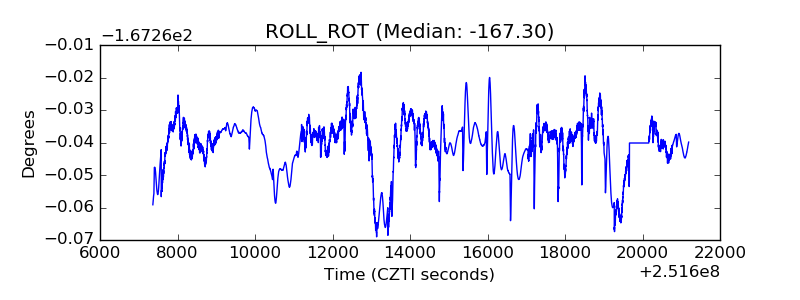 |
| _Roll_DEC | 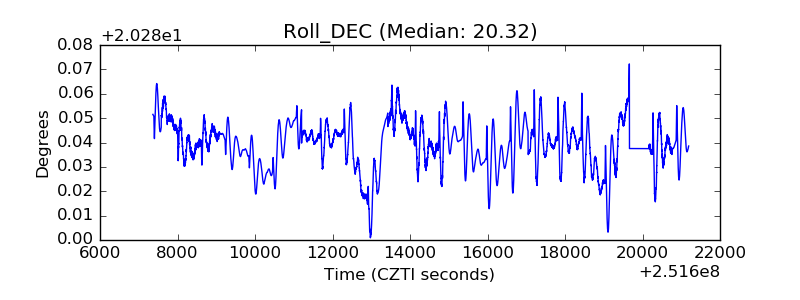 |
| _Roll_RA | 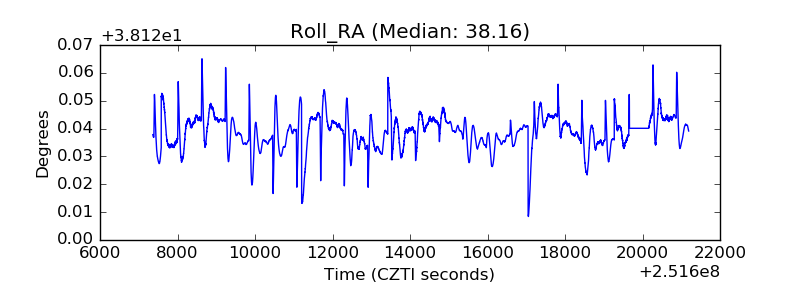 |
| Veto Counter | 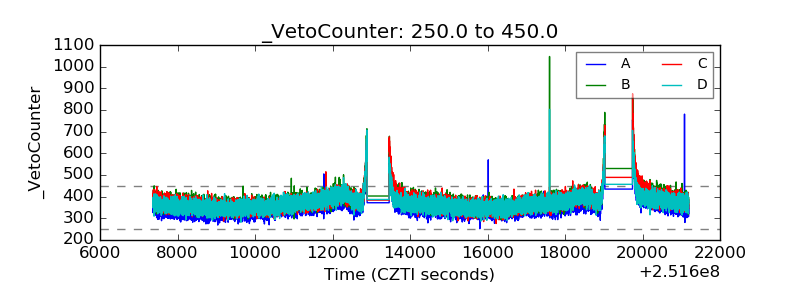 |