| Param | Original file | Final file |
|---|---|---|
| Filename | modeM0/AS1A04_130T01_9000001792_12080cztM0_level2.evt | modeM0/AS1A04_130T01_9000001792_12080cztM0_level2_quad_clean.evt |
| Size (bytes) | 394,848,000 | 53,982,720 |
| Size | 376.6 MB | 51.5 MB |
| Events in quadrant A | 2,344,875 | 342,333 |
| Events in quadrant B | 3,114,497 | 337,333 |
| Events in quadrant C | 2,143,608 | 343,950 |
| Events in quadrant D | 4,028,476 | 273,641 |
| Mode M0 | |||
|---|---|---|---|
| Quadrant | BADHDUFLAG | Total packets | Discarded packets |
| A | 0 | 10104 | 1 |
| B | 0 | 12320 | 1 |
| C | 0 | 9688 | 1 |
| D | 0 | 14950 | 1 |
| Mode M9 | |||
|---|---|---|---|
| Quadrant | BADHDUFLAG | Total packets | Discarded packets |
| A | 0 | 2 | 0 |
| B | 0 | 2 | 0 |
| C | 0 | 2 | 0 |
| D | 0 | 3 | 0 |
| Mode SS | |||
|---|---|---|---|
| Quadrant | BADHDUFLAG | Total packets | Discarded packets |
| A | 0 | 96 | 0 |
| B | 0 | 96 | 0 |
| C | 0 | 96 | 0 |
| D | 0 | 96 | 0 |
| Quadrant | Total seconds | Saturated seconds | Saturation percentage |
|---|---|---|---|
| A | 4796 | 46 | 0.959133% |
| B | 4796 | 223 | 4.649708% |
| C | 4796 | 18 | 0.375313% |
| D | 4796 | 679 | 14.157631% |
Noise dominated data is calculated using 1-second bins in cleaned event files. If a bin has >2000 counts, and if more than 50% of those come from <1% of pixels, then it is considered to be noise-dominated and hence unusable.
| Quadrant | # 1 sec bins | Bins with >0 counts | Bins with >2000 counts | High rate bins dominated by noise | Noise dominated (total time) | Noise dominated (detector-on time) | Marked lightcurve |
|---|---|---|---|---|---|---|---|
| A | 4797 | 4797 | 10 | 10 | 0.21% | 0.21% | 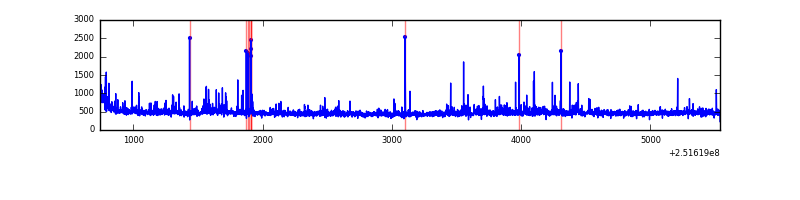 |
| B | 4797 | 4797 | 107 | 107 | 2.23% | 2.23% | 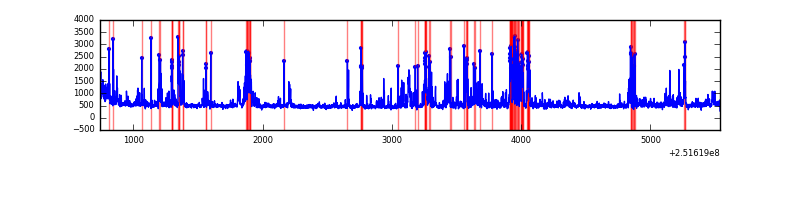 |
| C | 4797 | 4797 | 0 | 0 | 0.00% | 0.00% | 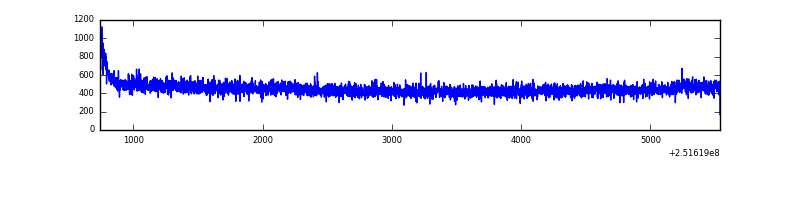 |
| D | 4797 | 4797 | 617 | 617 | 12.86% | 12.86% | 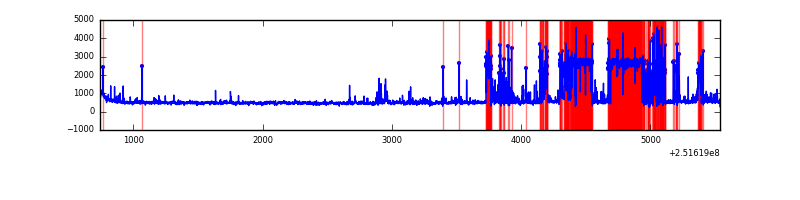 |
Top three noisy pixels from each quadrant. If the there are fewer than three noisy pixels in the level2.evt file, extra rows are filled as -1
| Pixel properties | Quadrant properties | ||||||
|---|---|---|---|---|---|---|---|
| Quadrant | DetID | PixID | Counts | Sigma | Mean | Median | Sigma |
| A | 1 | 162 | 69731 | 600.95 | 561 | 549 | 115.1 |
| A | 1 | 178 | 28469 | 242.53 | 561 | 549 | 115.1 |
| A | 1 | 161 | 26769 | 227.76 | 561 | 549 | 115.1 |
| B | 4 | 239 | 777195 | 7170.59 | 554 | 541 | 108.3 |
| B | 15 | 204 | 71980 | 659.57 | 554 | 541 | 108.3 |
| B | 11 | 51 | 58128 | 531.68 | 554 | 541 | 108.3 |
| C | 8 | 208 | 10859 | 80.53 | 543 | 545 | 128.1 |
| C | 8 | 128 | 9230 | 67.81 | 543 | 545 | 128.1 |
| C | 8 | 112 | 5117 | 35.7 | 543 | 545 | 128.1 |
| D | 1 | 52 | 1811606 | 15180.22 | 493 | 480 | 119.3 |
| D | 8 | 195 | 218344 | 1826.06 | 493 | 480 | 119.3 |
| D | 13 | 104 | 50027 | 415.29 | 493 | 480 | 119.3 |
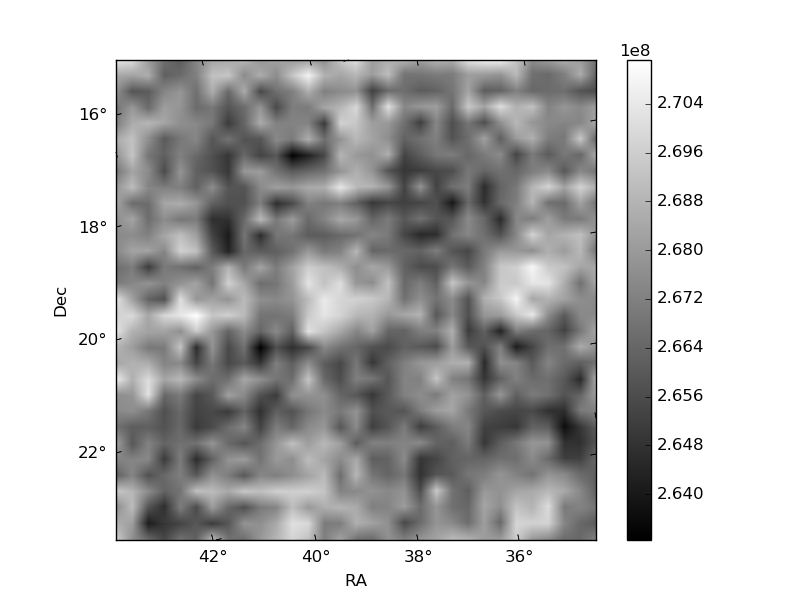
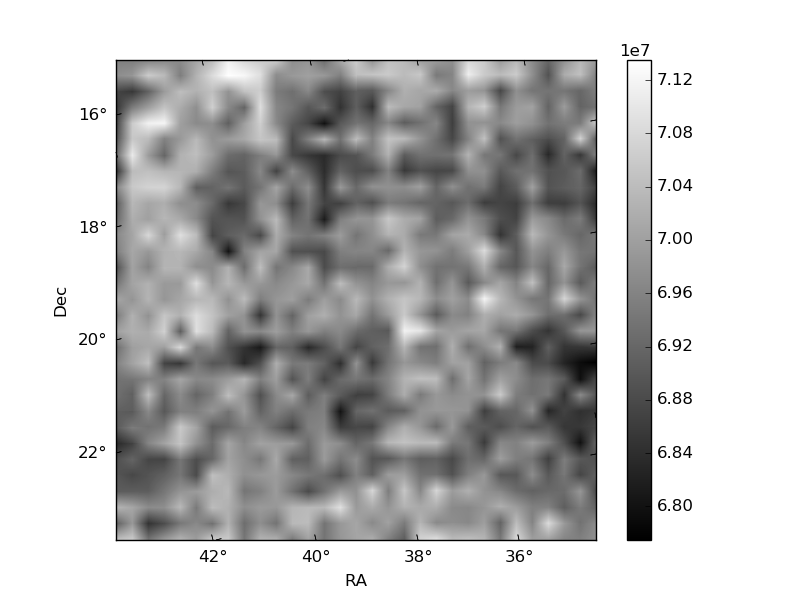
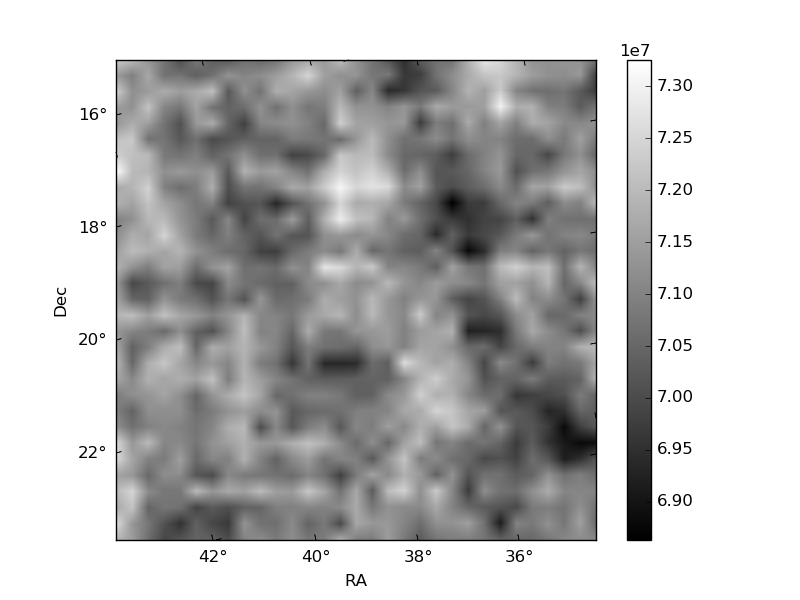
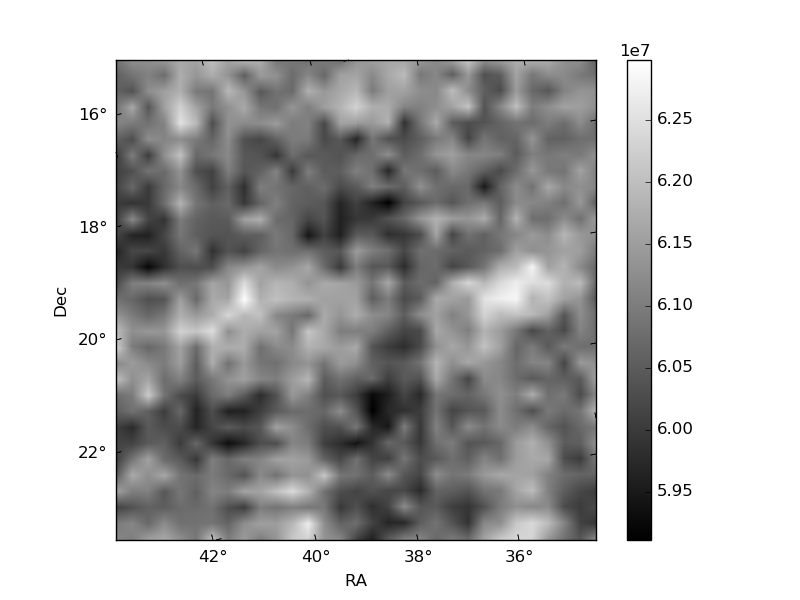
Histogram calculated using DETX and DETY for each event in the final _common_clean file
| Quadrant A | 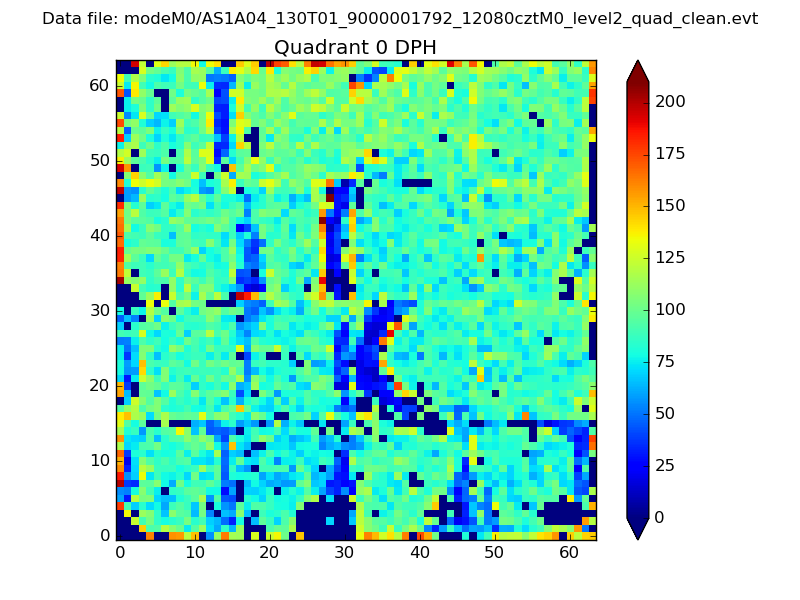 |
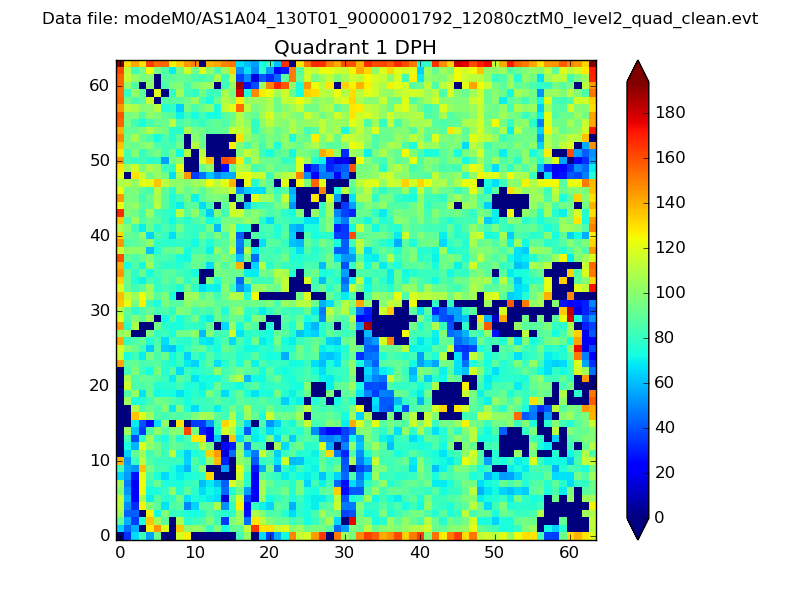 |
Quadrant B |
|---|---|---|---|
| Quadrant D | 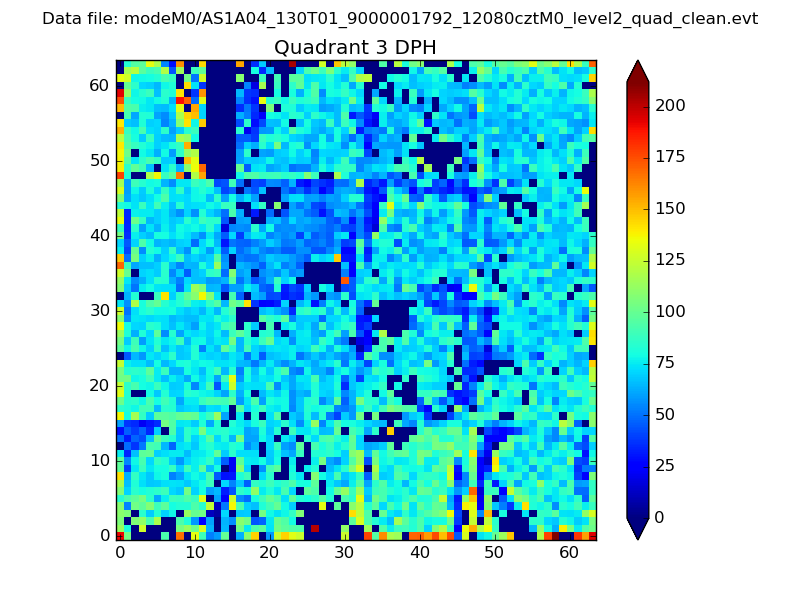 |
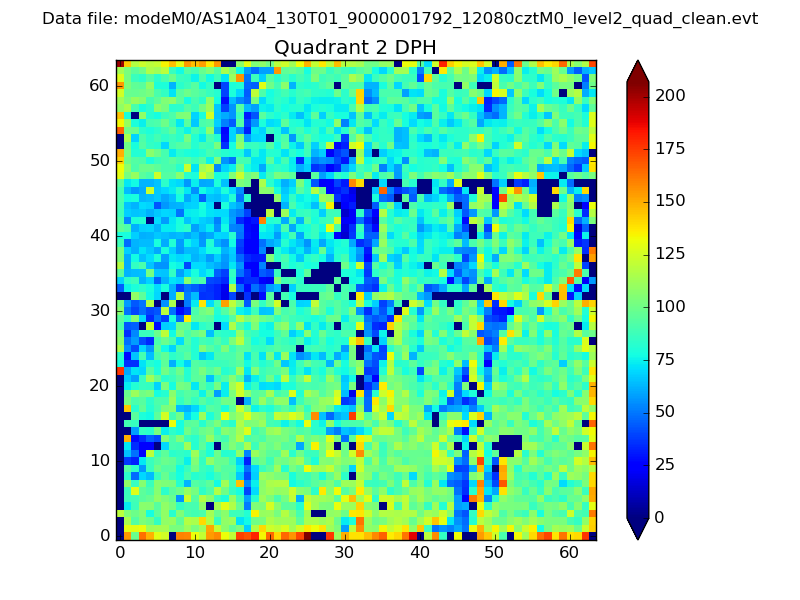 |
Quadrant C |
| Plot type | Count rate plots | Images |
|---|---|---|
| Comparison with Poisson distribution Blue bars denote a histogram of data divided into 1 sec bins. Red curve is a Poisson curve with rate = median count rate of data. |
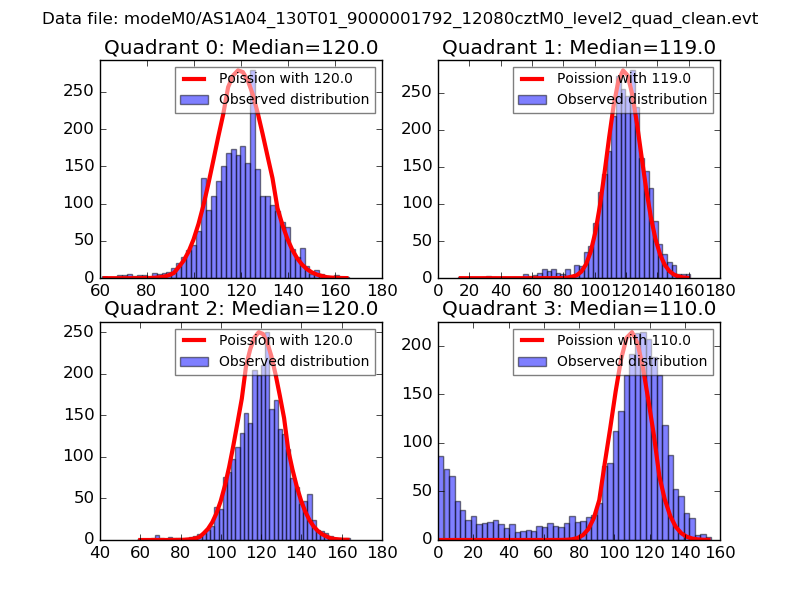 |
 |
| Quadrant-wise count rates Data is divided into 100 sec bins |
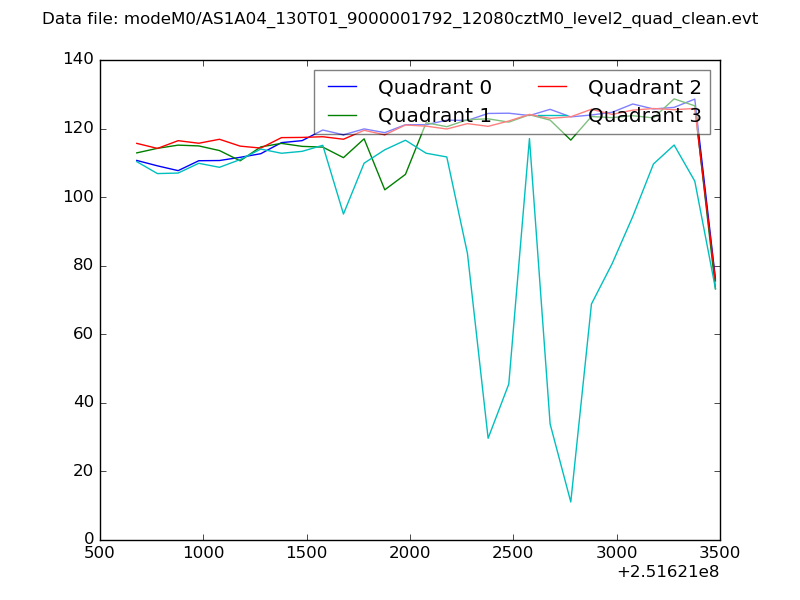 |
|
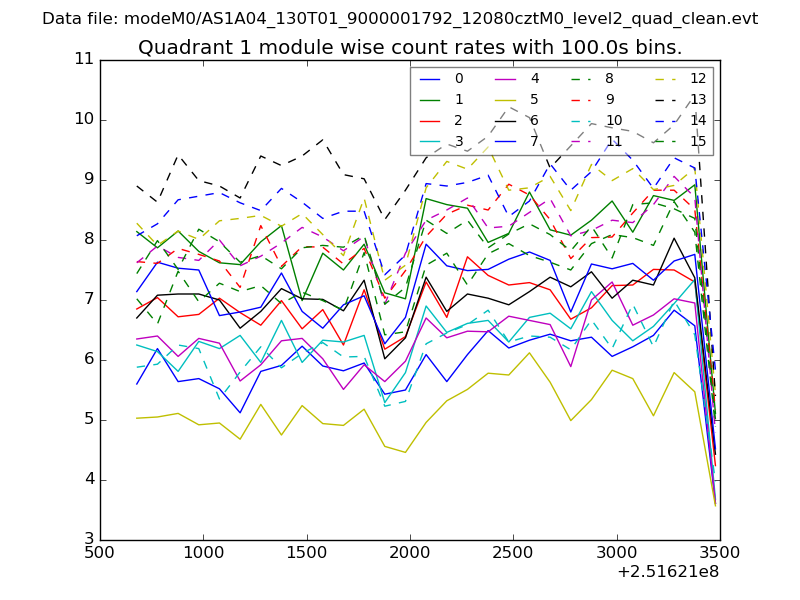
| Module-wise count rates for Quadrant A Data is divided into 100 sec bins |
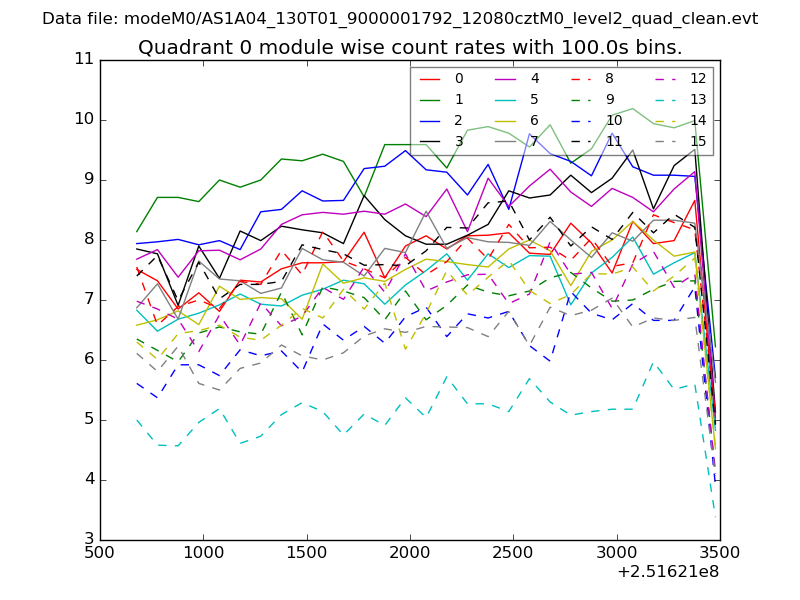 |
 |
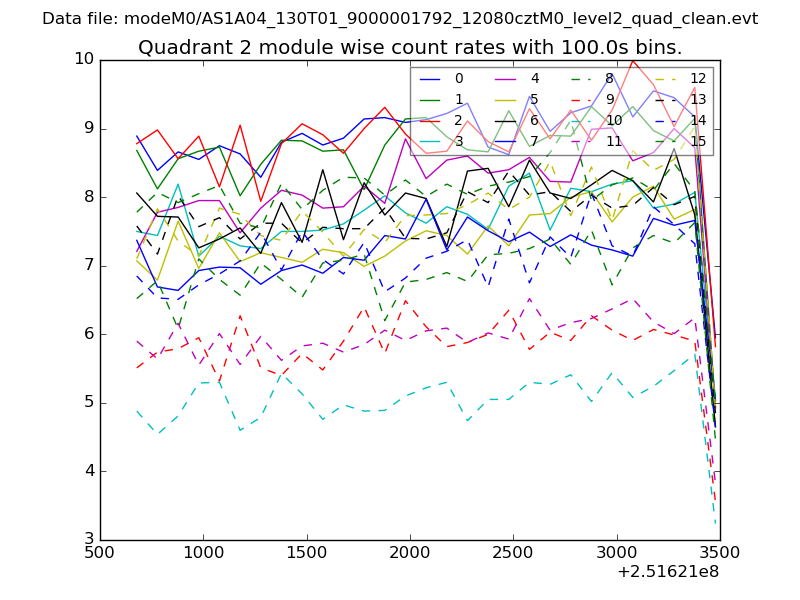
| Module-wise count rates for Quadrant B Data is divided into 100 sec bins |
 |
 |
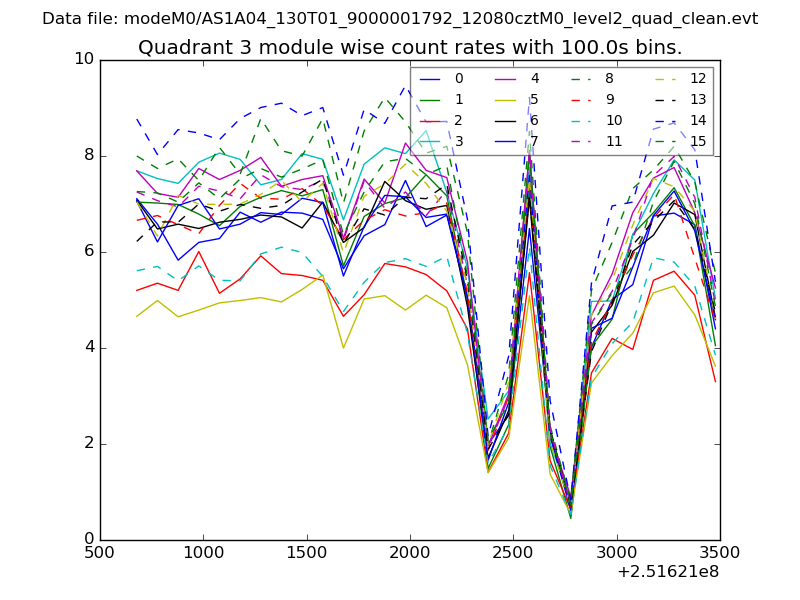
| Module-wise count rates for Quadrant C Data is divided into 100 sec bins |
 |
 |
| Module-wise count rates for Quadrant D Data is divided into 100 sec bins |
 |
 |
| Parameter | Plot |
|---|---|
| CZT HV Monitor | 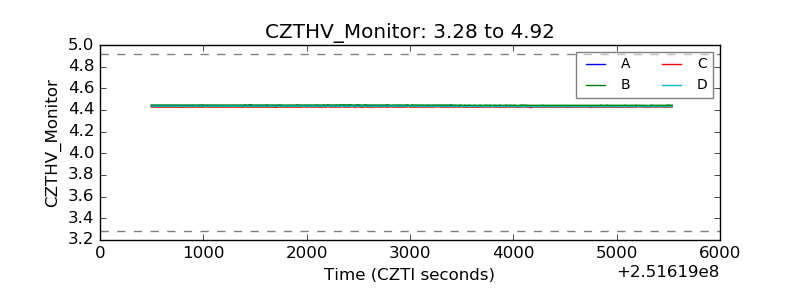 |
| D_VDD | 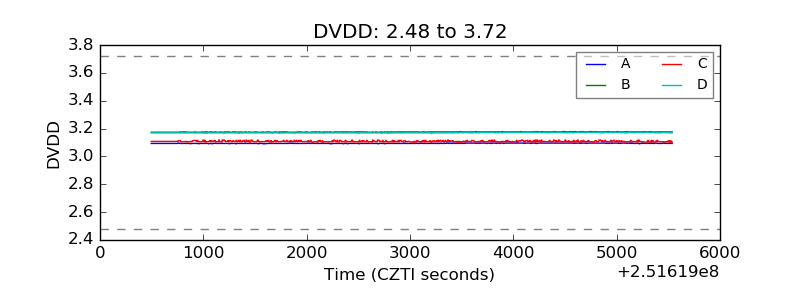 |
| Temperature 1 | 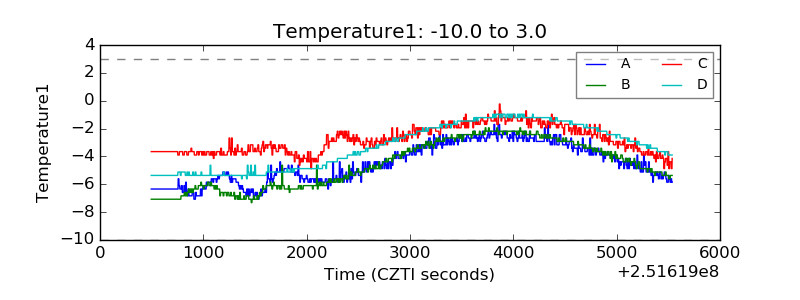 |
| Veto HV Monitor | 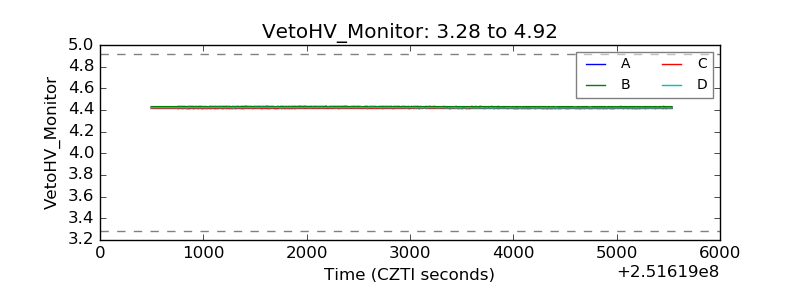 |
| Veto LLD | 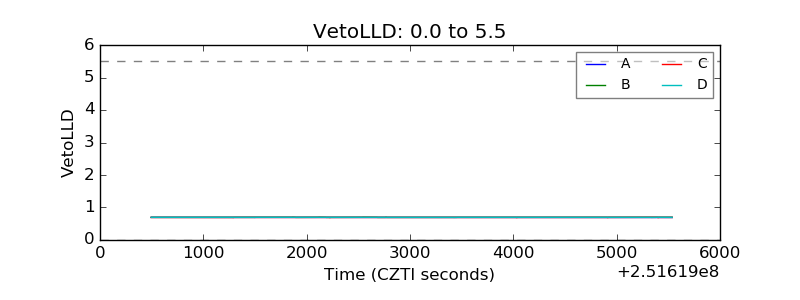 |
| Alpha Counter | 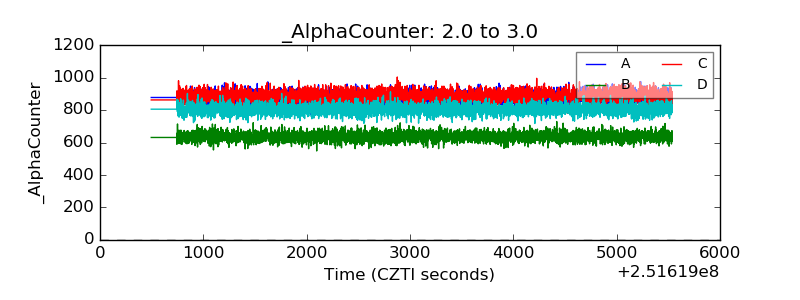 |
| _CPM_Rate | 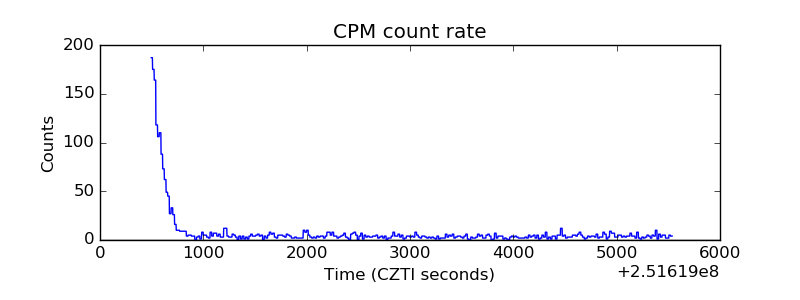 |
| CZT Counter | 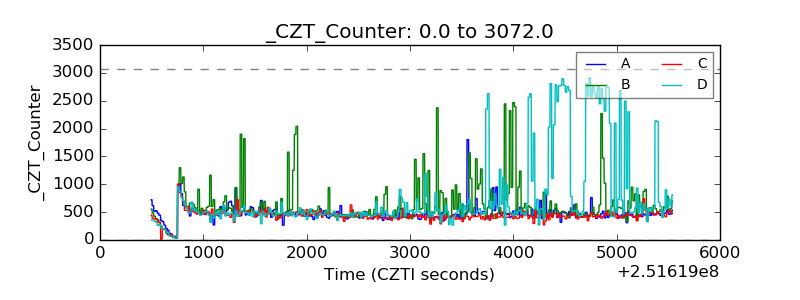 |
| +2.5 Volts monitor | 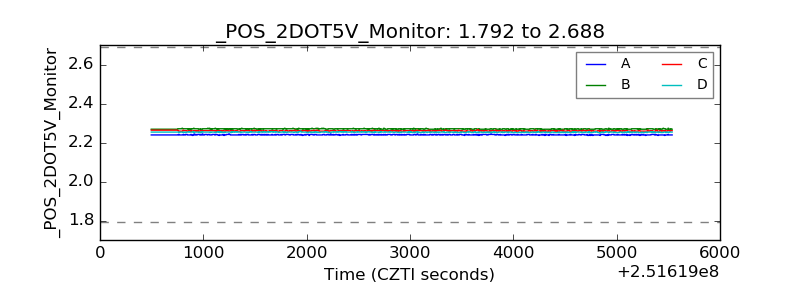 |
| +5 Volts monitor |  |
| _ROLL_ROT | 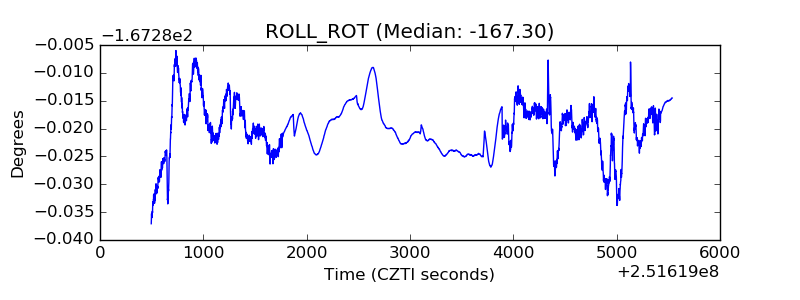 |
| _Roll_DEC | 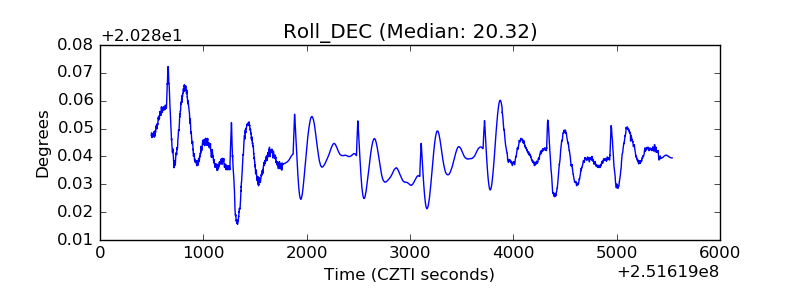 |
| _Roll_RA | 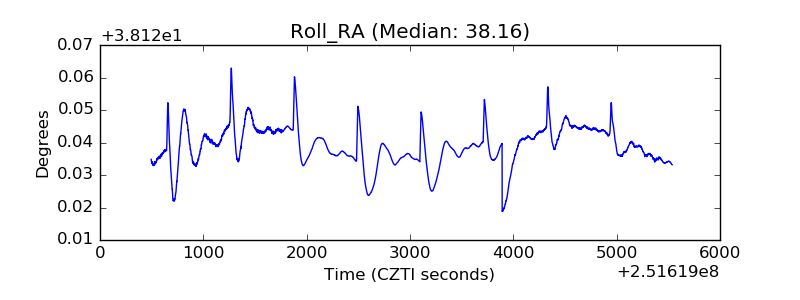 |
| Veto Counter | 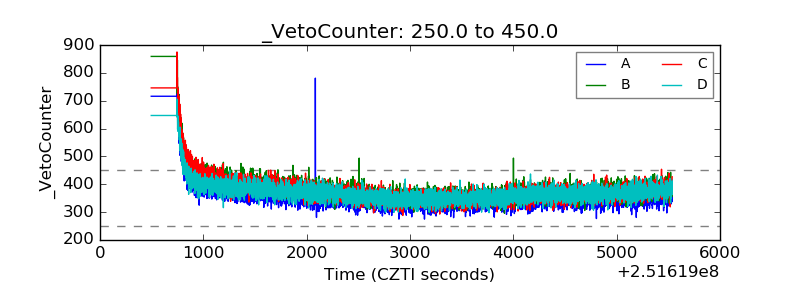 |