| Param | Original file | Final file |
|---|---|---|
| Filename | modeM0/AS1A04_145T02_9000001790_12071cztM0_level2.evt | modeM0/AS1A04_145T02_9000001790_12071cztM0_level2_quad_clean.evt |
| Size (bytes) | 122,400,000 | 32,307,840 |
| Size | 116.7 MB | 30.8 MB |
| Events in quadrant A | 840,250 | 220,226 |
| Events in quadrant B | 900,064 | 222,523 |
| Events in quadrant C | 749,185 | 220,666 |
| Events in quadrant D | 1,117,237 | 207,819 |
| Mode M0 | |||
|---|---|---|---|
| Quadrant | BADHDUFLAG | Total packets | Discarded packets |
| A | 0 | 3408 | 2 |
| B | 0 | 3657 | 1 |
| C | 0 | 3032 | 1 |
| D | 0 | 4320 | 1 |
| Mode SS | |||
|---|---|---|---|
| Quadrant | BADHDUFLAG | Total packets | Discarded packets |
| A | 0 | 30 | 0 |
| B | 0 | 30 | 0 |
| C | 0 | 30 | 0 |
| D | 0 | 30 | 0 |
| Mode M9 | |||
|---|---|---|---|
| Quadrant | BADHDUFLAG | Total packets | Discarded packets |
| A | 0 | 9 | 0 |
| B | 0 | 9 | 0 |
| C | 0 | 9 | 0 |
| D | 0 | 9 | 0 |
| Quadrant | Total seconds | Saturated seconds | Saturation percentage |
|---|---|---|---|
| A | 1431 | 15 | 1.048218% |
| B | 1431 | 22 | 1.537386% |
| C | 1431 | 3 | 0.209644% |
| D | 1431 | 36 | 2.515723% |
Noise dominated data is calculated using 1-second bins in cleaned event files. If a bin has >2000 counts, and if more than 50% of those come from <1% of pixels, then it is considered to be noise-dominated and hence unusable.
| Quadrant | # 1 sec bins | Bins with >0 counts | Bins with >2000 counts | High rate bins dominated by noise | Noise dominated (total time) | Noise dominated (detector-on time) | Marked lightcurve |
|---|---|---|---|---|---|---|---|
| A | 1432 | 1432 | 1 | 1 | 0.07% | 0.07% | 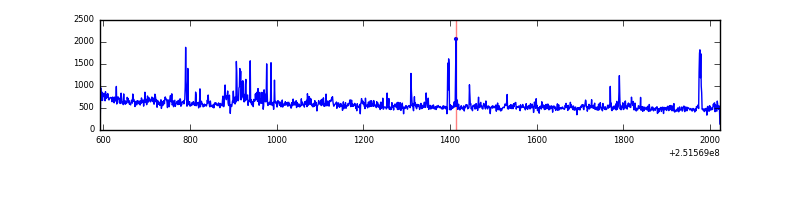 |
| B | 1432 | 1432 | 11 | 11 | 0.77% | 0.77% | 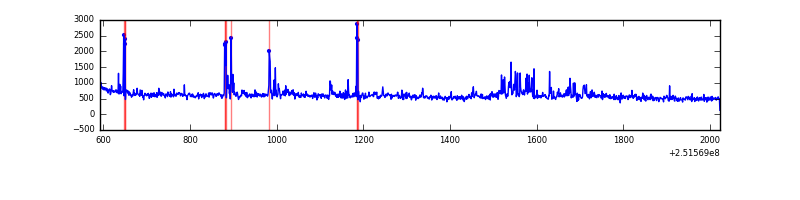 |
| C | 1432 | 1432 | 0 | 0 | 0.00% | 0.00% | 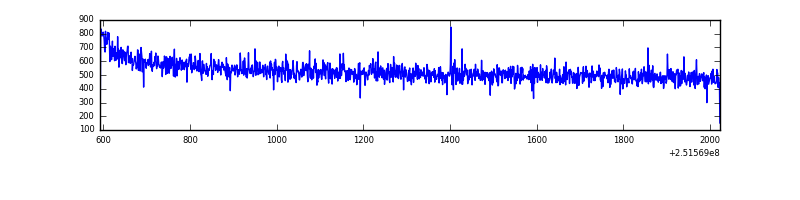 |
| D | 1432 | 1432 | 22 | 22 | 1.54% | 1.54% | 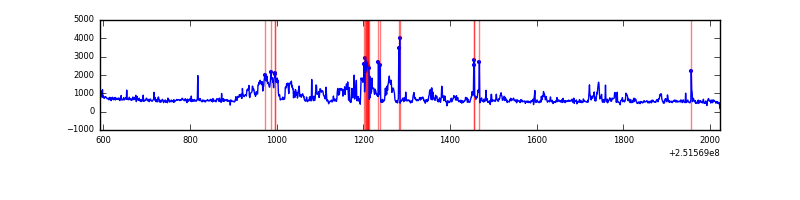 |
Top three noisy pixels from each quadrant. If the there are fewer than three noisy pixels in the level2.evt file, extra rows are filled as -1
| Pixel properties | Quadrant properties | ||||||
|---|---|---|---|---|---|---|---|
| Quadrant | DetID | PixID | Counts | Sigma | Mean | Median | Sigma |
| A | 13 | 248 | 23669 | 573.19 | 196 | 193 | 41.0 |
| A | 1 | 162 | 18347 | 443.25 | 196 | 193 | 41.0 |
| A | 1 | 178 | 8355 | 199.28 | 196 | 193 | 41.0 |
| B | 4 | 239 | 84022 | 2225.06 | 193 | 189 | 37.7 |
| B | 15 | 204 | 48779 | 1289.65 | 193 | 189 | 37.7 |
| B | 0 | 219 | 11059 | 288.51 | 193 | 189 | 37.7 |
| C | 13 | 61 | 1379 | 26.12 | 191 | 193 | 45.4 |
| C | 0 | 207 | 1222 | 22.67 | 191 | 193 | 45.4 |
| C | 3 | 202 | 501 | 6.78 | 191 | 193 | 45.4 |
| D | 1 | 52 | 260963 | 5589.4 | 192 | 187 | 46.7 |
| D | 7 | 71 | 49355 | 1053.85 | 192 | 187 | 46.7 |
| D | 8 | 195 | 44137 | 942.01 | 192 | 187 | 46.7 |
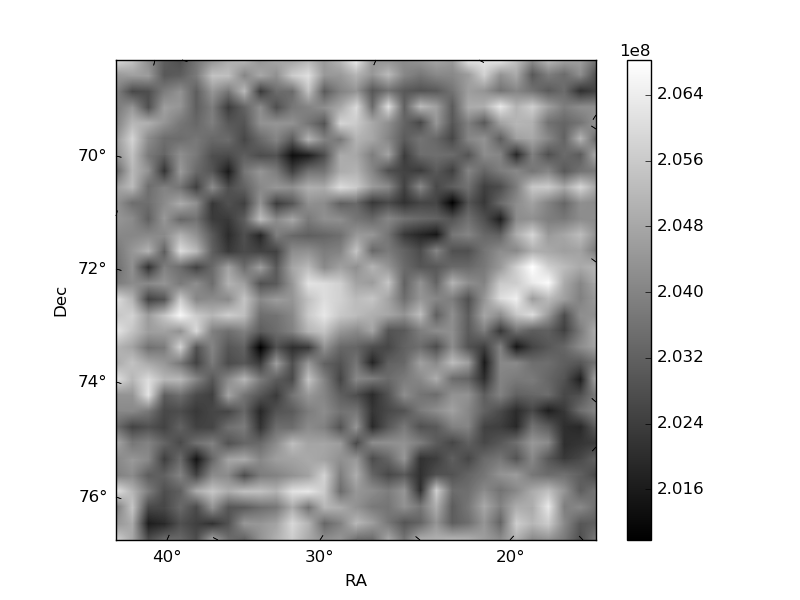
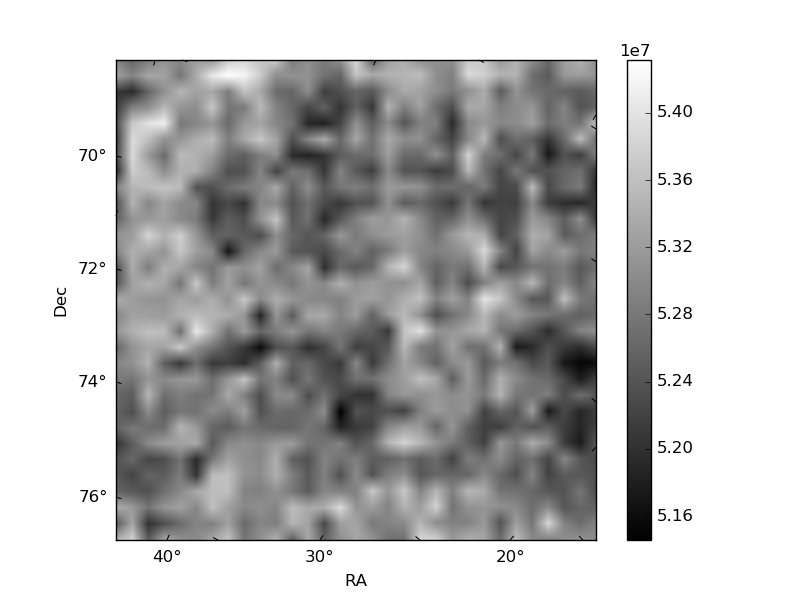
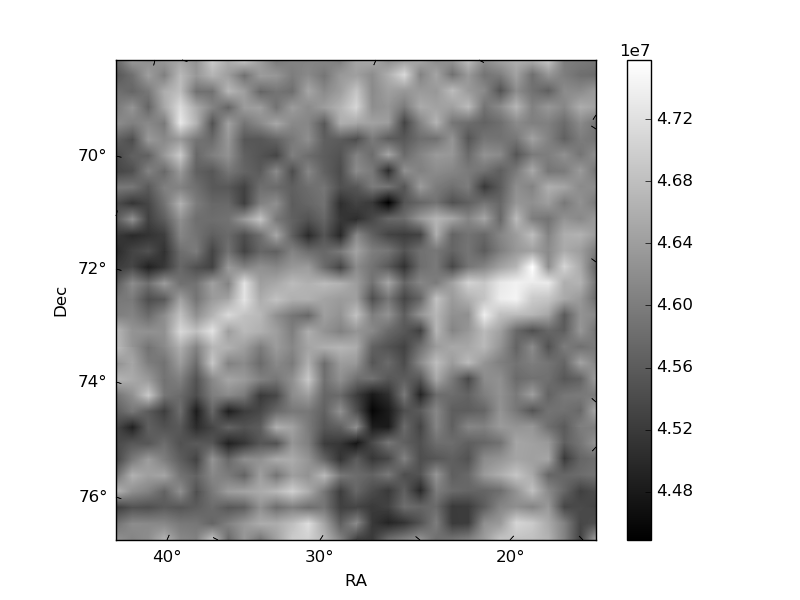
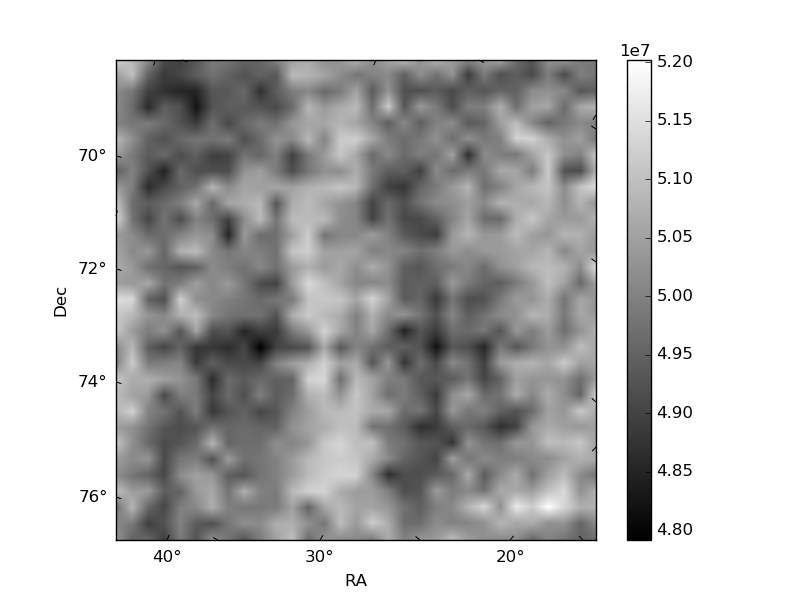
Histogram calculated using DETX and DETY for each event in the final _common_clean file
| Quadrant A | 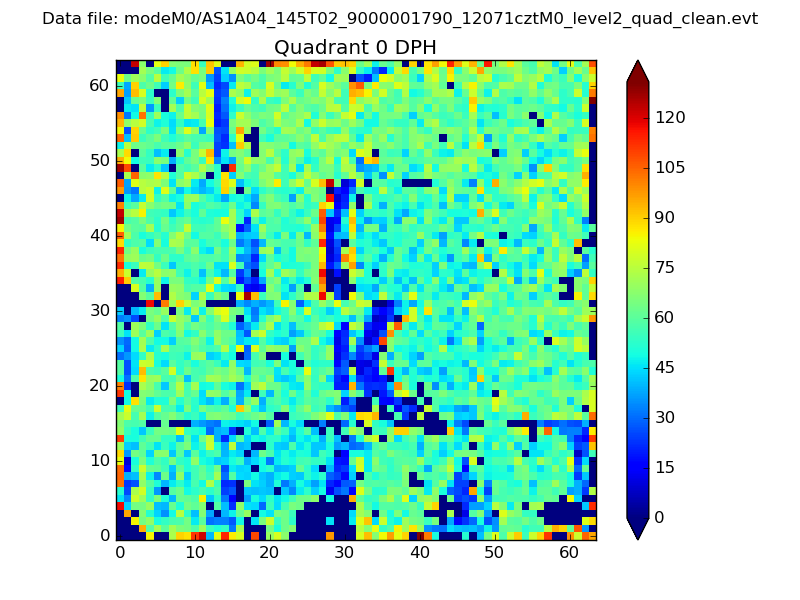 |
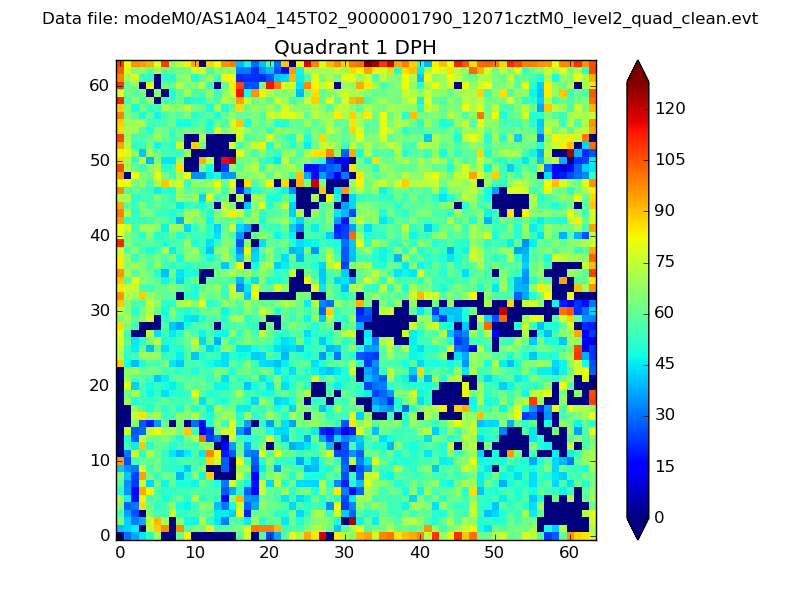 |
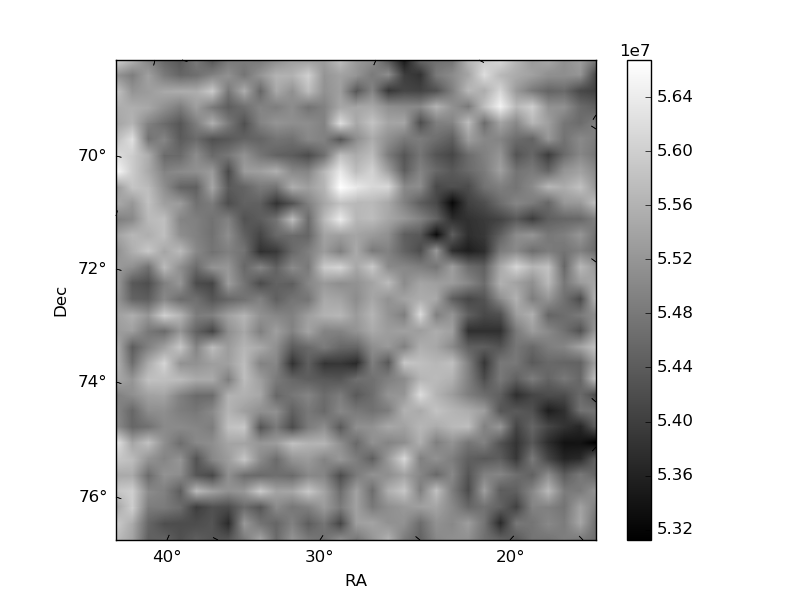
Quadrant B |
|---|---|---|---|
| Quadrant D | 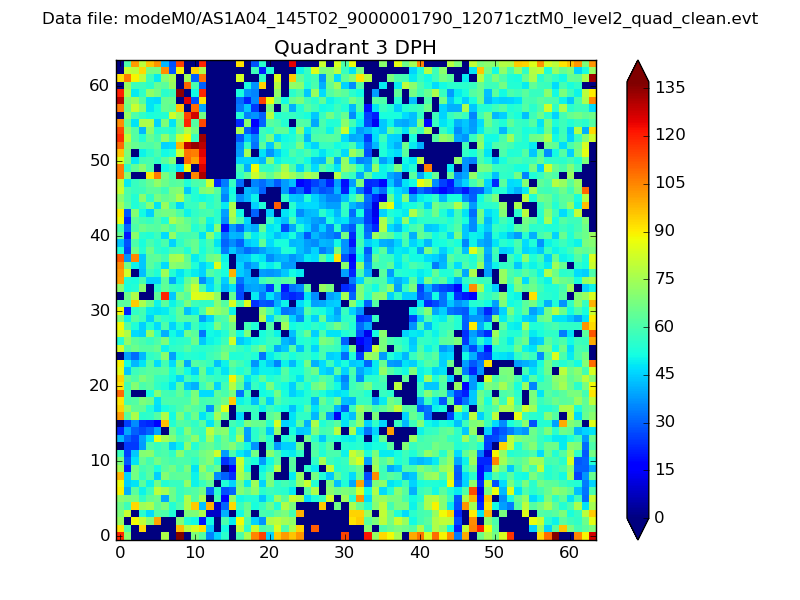 |
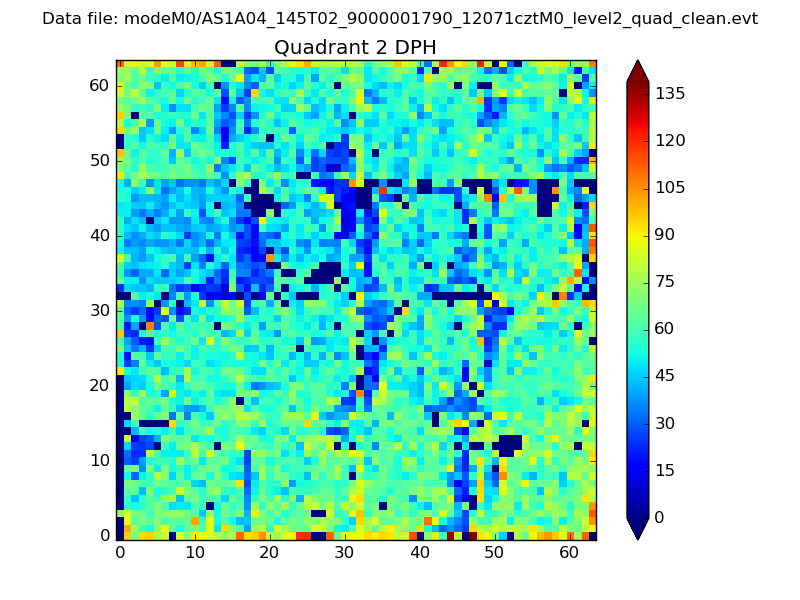 |
Quadrant C |
| Plot type | Count rate plots | Images |
|---|---|---|
| Comparison with Poisson distribution Blue bars denote a histogram of data divided into 1 sec bins. Red curve is a Poisson curve with rate = median count rate of data. |
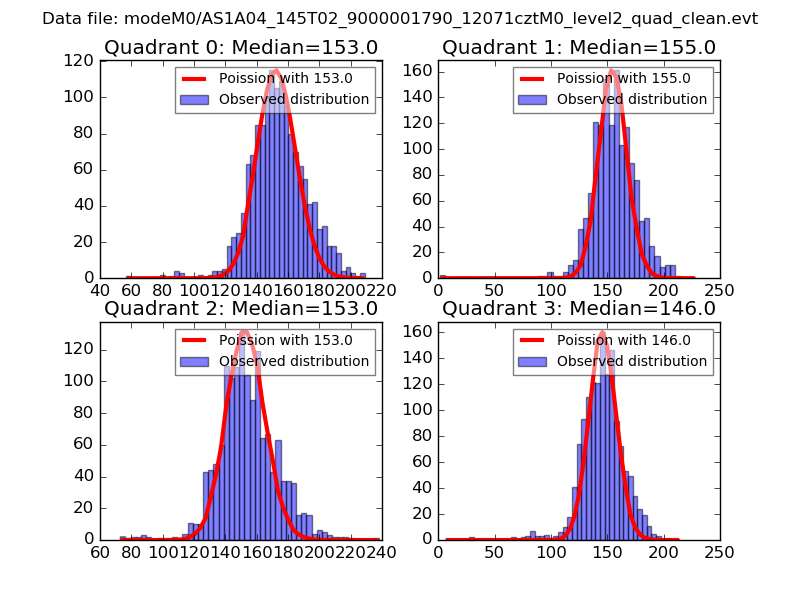 |
 |
| Quadrant-wise count rates Data is divided into 100 sec bins |
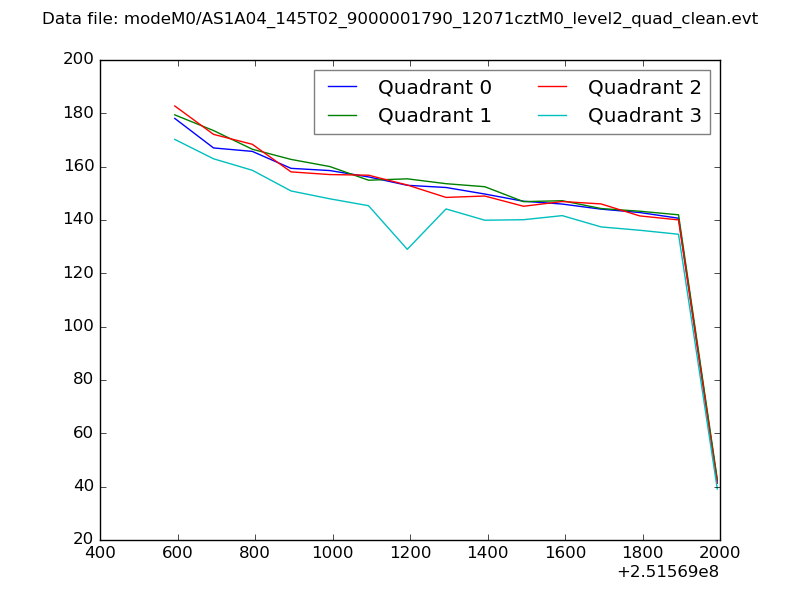 |
|
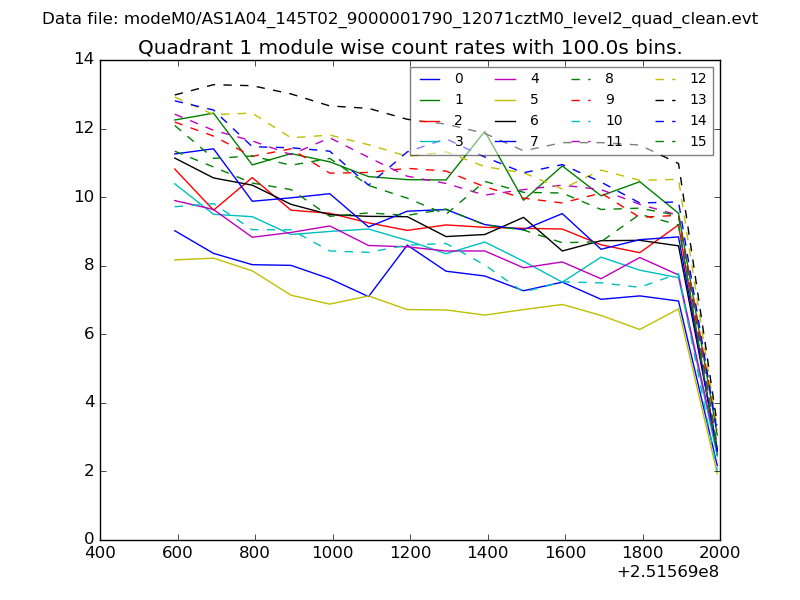
| Module-wise count rates for Quadrant A Data is divided into 100 sec bins |
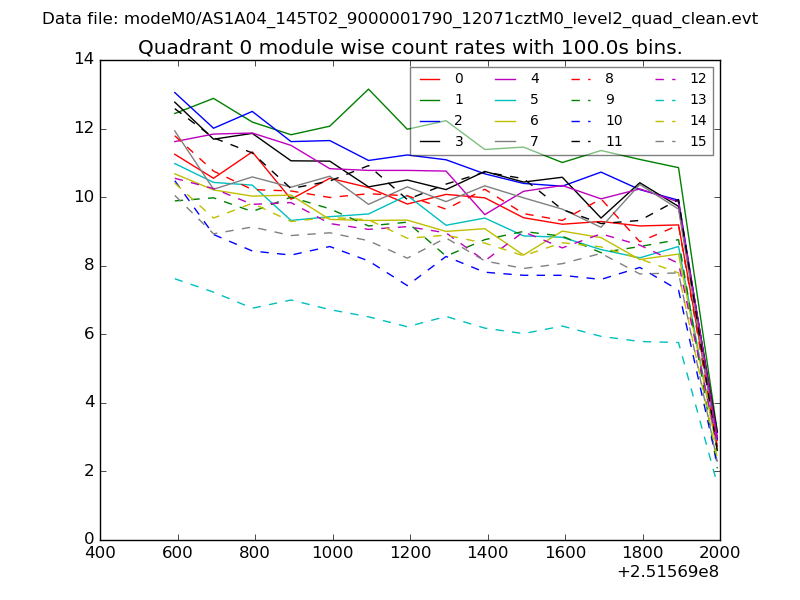 |
 |
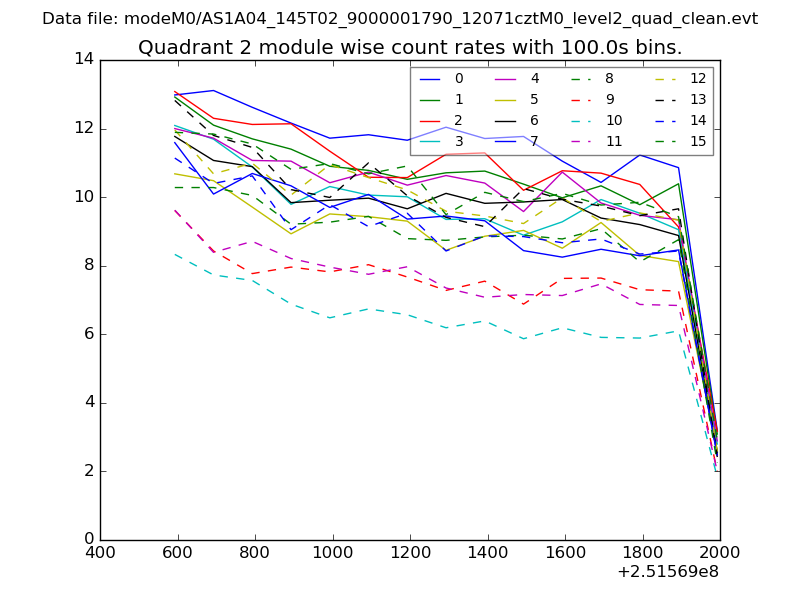
| Module-wise count rates for Quadrant B Data is divided into 100 sec bins |
 |
 |
| Module-wise count rates for Quadrant C Data is divided into 100 sec bins |
 |
 |
| Module-wise count rates for Quadrant D Data is divided into 100 sec bins |
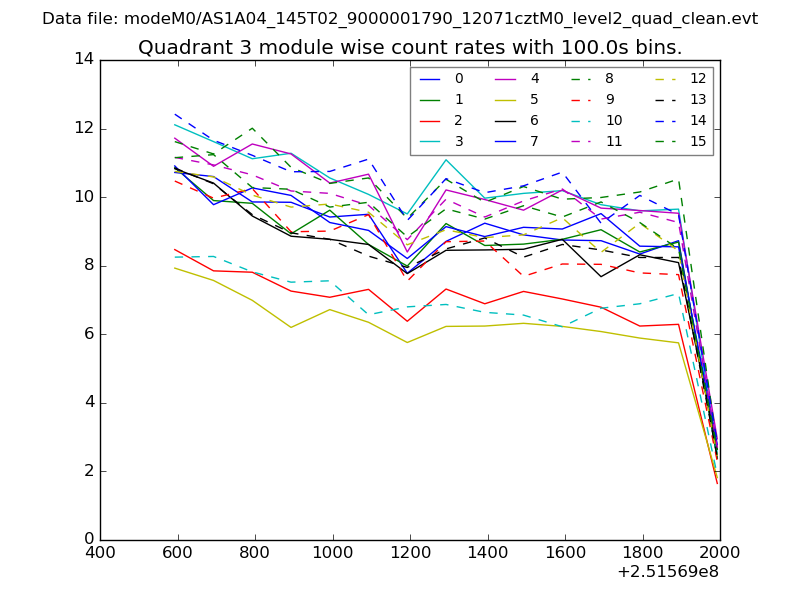 |
 |
| Parameter | Plot |
|---|---|
| CZT HV Monitor | 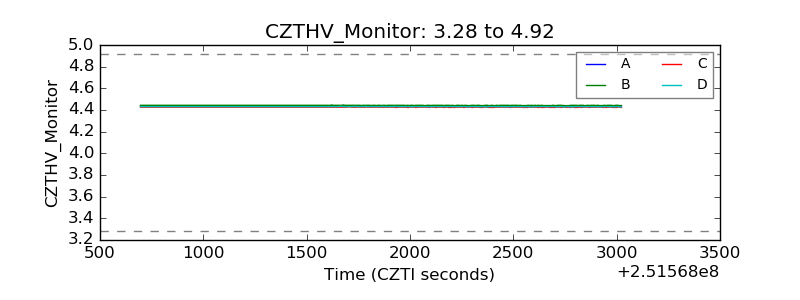 |
| D_VDD | 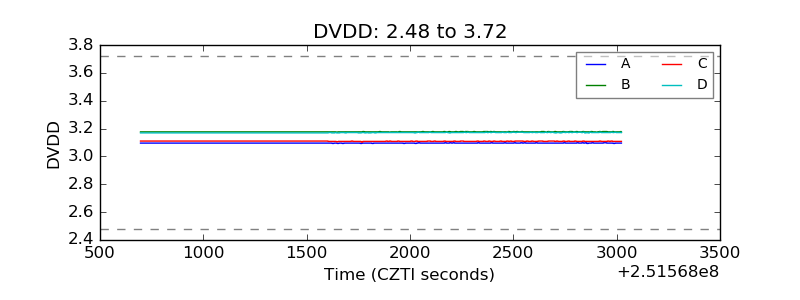 |
| Temperature 1 | 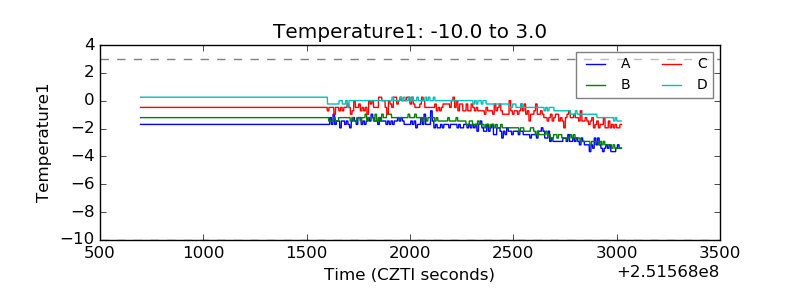 |
| Veto HV Monitor | 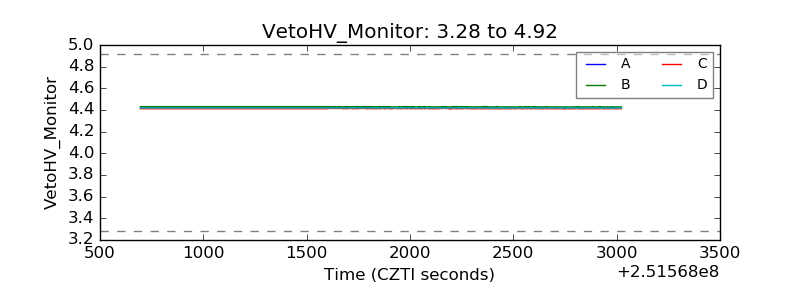 |
| Veto LLD | 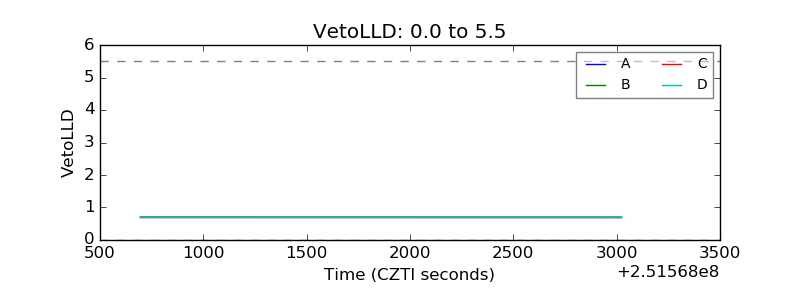 |
| Alpha Counter | 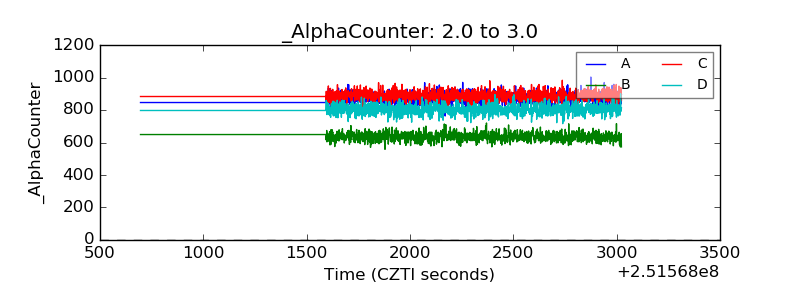 |
| _CPM_Rate | 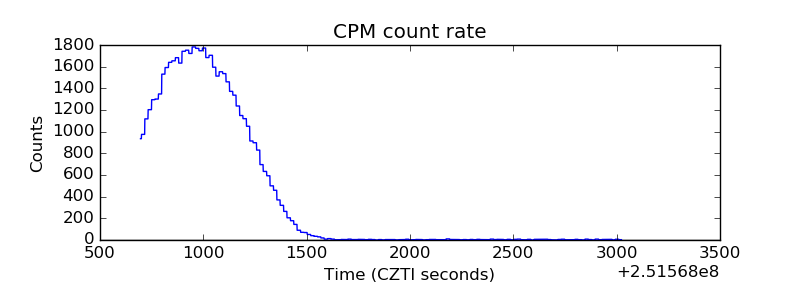 |
| CZT Counter | 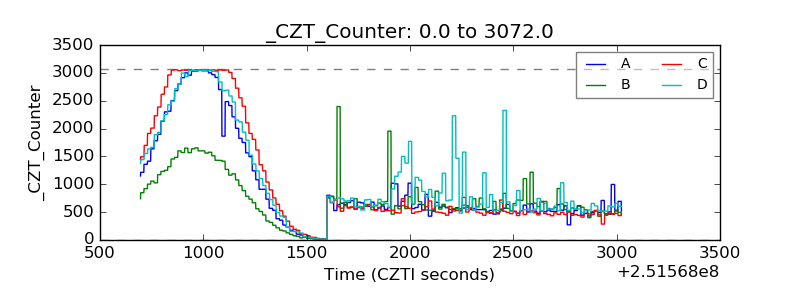 |
| +2.5 Volts monitor | 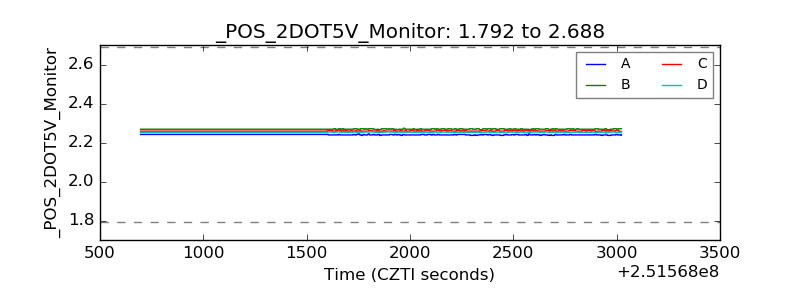 |
| +5 Volts monitor |  |
| _ROLL_ROT | 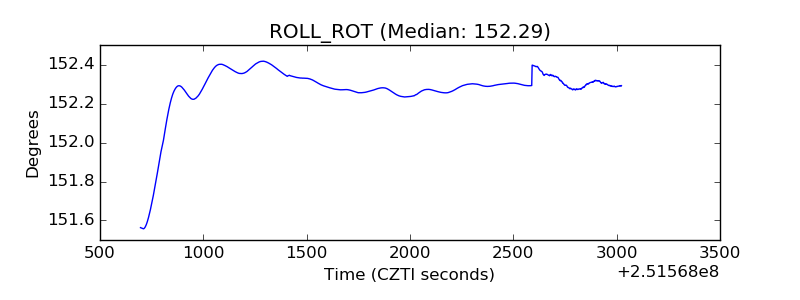 |
| _Roll_DEC | 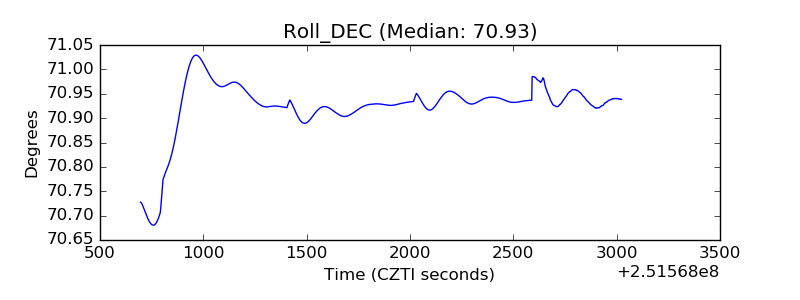 |
| _Roll_RA | 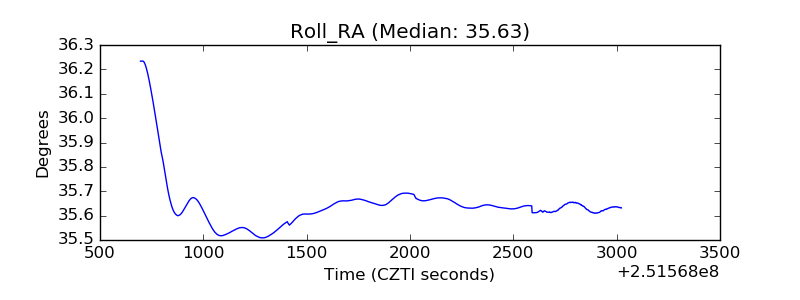 |
| Veto Counter | 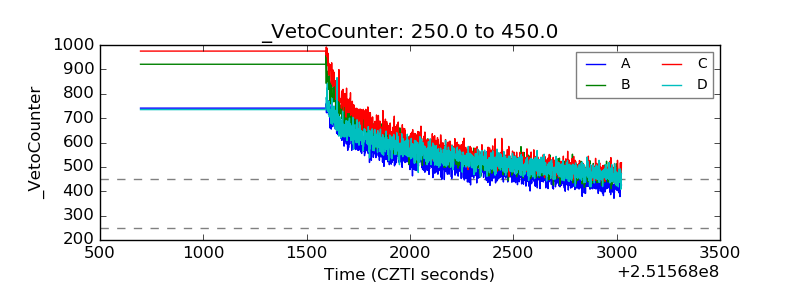 |