| Param | Original file | Final file |
|---|---|---|
| Filename | modeM0/AS1A04_145T02_9000001790_12073cztM0_level2.evt | modeM0/AS1A04_145T02_9000001790_12073cztM0_level2_quad_clean.evt |
| Size (bytes) | 464,973,120 | 101,799,360 |
| Size | 443.4 MB | 97.1 MB |
| Events in quadrant A | 3,074,396 | 675,452 |
| Events in quadrant B | 3,761,132 | 666,614 |
| Events in quadrant C | 2,829,535 | 675,000 |
| Events in quadrant D | 4,010,368 | 647,938 |
| Mode M0 | |||
|---|---|---|---|
| Quadrant | BADHDUFLAG | Total packets | Discarded packets |
| A | 0 | 13028 | 1 |
| B | 0 | 15128 | 1 |
| C | 0 | 12293 | 1 |
| D | 0 | 15917 | 1 |
| Mode SS | |||
|---|---|---|---|
| Quadrant | BADHDUFLAG | Total packets | Discarded packets |
| A | 0 | 120 | 0 |
| B | 0 | 120 | 0 |
| C | 0 | 120 | 0 |
| D | 0 | 120 | 0 |
| Mode M9 | |||
|---|---|---|---|
| Quadrant | BADHDUFLAG | Total packets | Discarded packets |
| A | 0 | 13 | 0 |
| B | 0 | 13 | 0 |
| C | 0 | 13 | 0 |
| D | 0 | 13 | 0 |
| Quadrant | Total seconds | Saturated seconds | Saturation percentage |
|---|---|---|---|
| A | 5989 | 71 | 1.185507% |
| B | 5989 | 250 | 4.174320% |
| C | 5989 | 54 | 0.901653% |
| D | 5989 | 189 | 3.155786% |
Noise dominated data is calculated using 1-second bins in cleaned event files. If a bin has >2000 counts, and if more than 50% of those come from <1% of pixels, then it is considered to be noise-dominated and hence unusable.
| Quadrant | # 1 sec bins | Bins with >0 counts | Bins with >2000 counts | High rate bins dominated by noise | Noise dominated (total time) | Noise dominated (detector-on time) | Marked lightcurve |
|---|---|---|---|---|---|---|---|
| A | 7260 | 5991 | 6 | 6 | 0.08% | 0.10% | 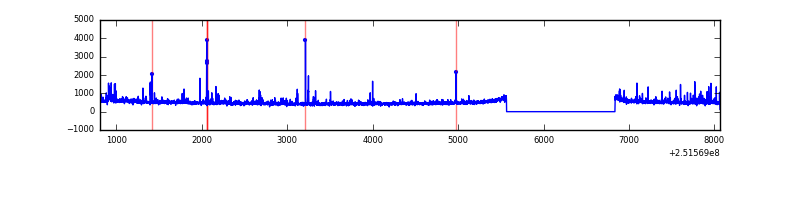 |
| B | 7260 | 5990 | 147 | 147 | 2.02% | 2.45% |  |
| C | 7260 | 5991 | 2 | 2 | 0.03% | 0.03% | 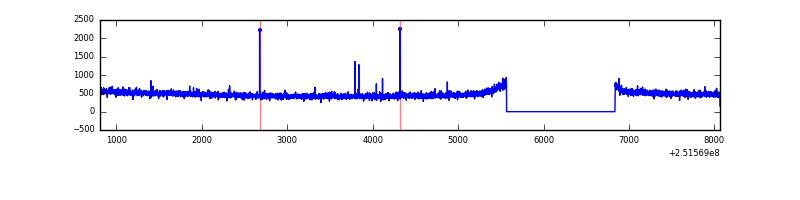 |
| D | 7260 | 5991 | 95 | 95 | 1.31% | 1.59% | 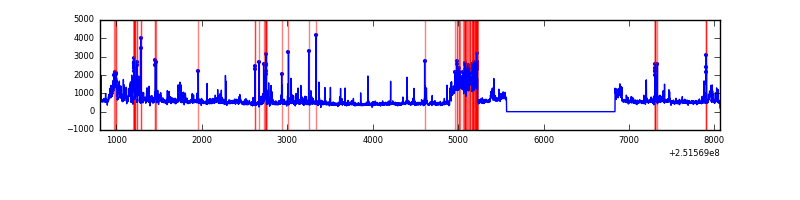 |
Top three noisy pixels from each quadrant. If the there are fewer than three noisy pixels in the level2.evt file, extra rows are filled as -1
| Pixel properties | Quadrant properties | ||||||
|---|---|---|---|---|---|---|---|
| Quadrant | DetID | PixID | Counts | Sigma | Mean | Median | Sigma |
| A | 1 | 162 | 67849 | 457.88 | 729 | 714 | 146.6 |
| A | 13 | 248 | 42597 | 285.65 | 729 | 714 | 146.6 |
| A | 1 | 178 | 28837 | 191.81 | 729 | 714 | 146.6 |
| B | 4 | 239 | 723418 | 5365.82 | 723 | 705 | 134.7 |
| B | 15 | 204 | 155848 | 1151.87 | 723 | 705 | 134.7 |
| B | 3 | 209 | 23633 | 170.23 | 723 | 705 | 134.7 |
| C | 12 | 4 | 7832 | 43.1 | 721 | 726 | 164.9 |
| C | 0 | 207 | 6655 | 35.96 | 721 | 726 | 164.9 |
| C | 13 | 61 | 5238 | 27.37 | 721 | 726 | 164.9 |
| D | 1 | 52 | 785593 | 4598.06 | 715 | 695 | 170.7 |
| D | 8 | 195 | 146083 | 851.71 | 715 | 695 | 170.7 |
| D | 7 | 71 | 104110 | 605.82 | 715 | 695 | 170.7 |
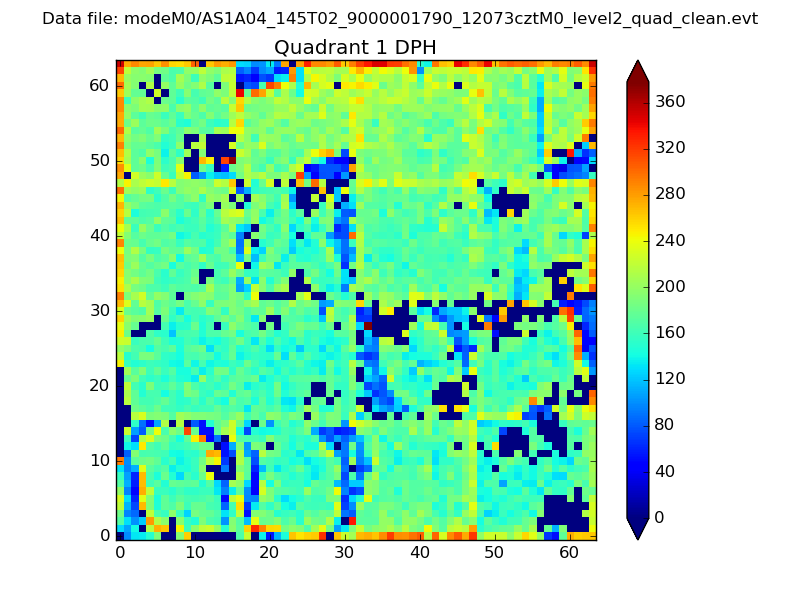
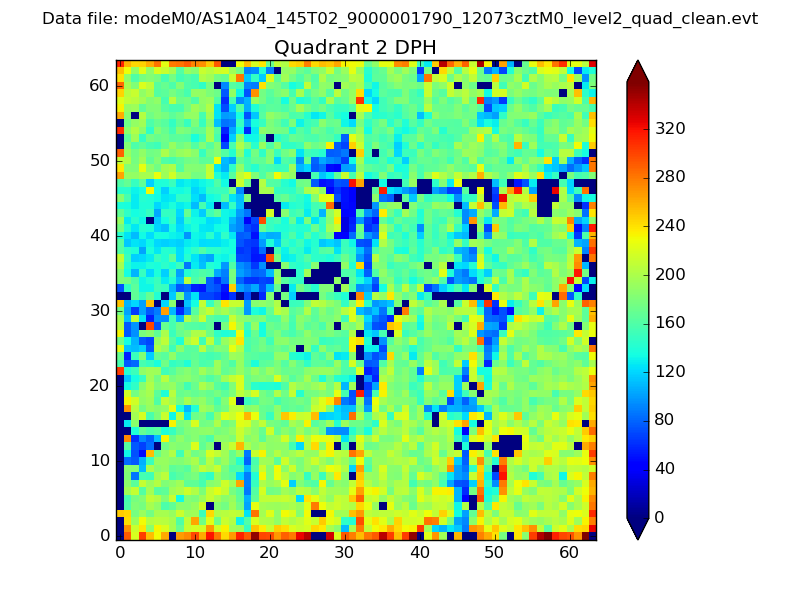
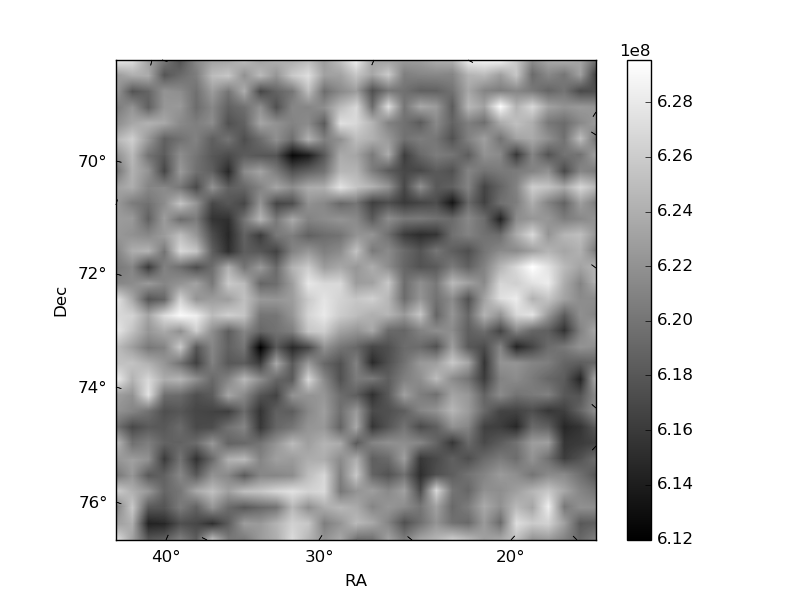
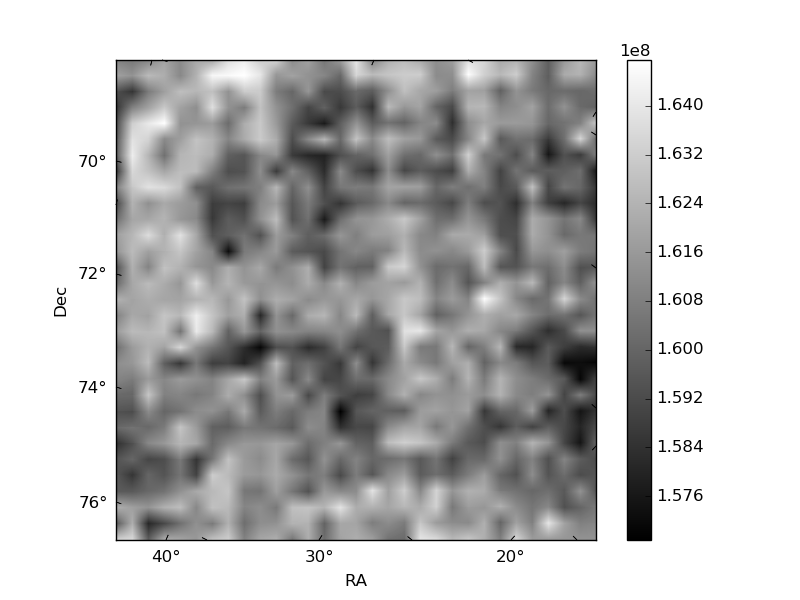
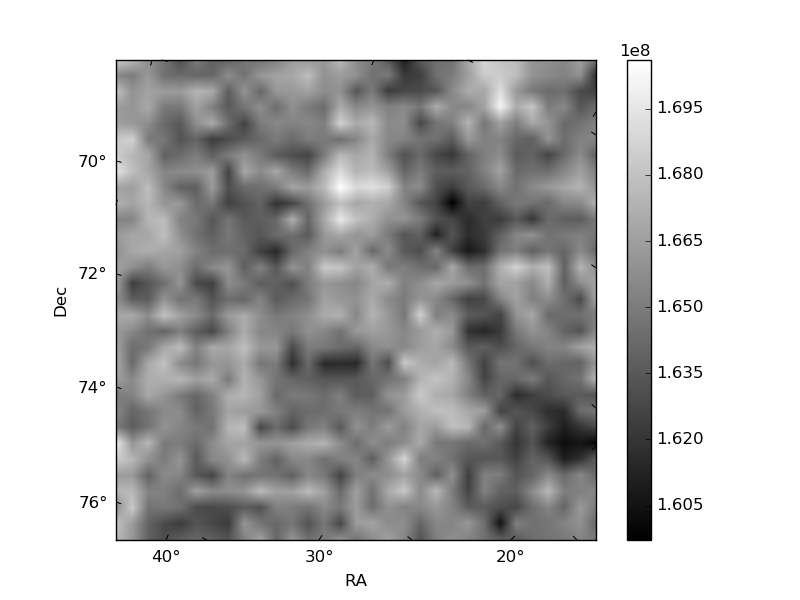
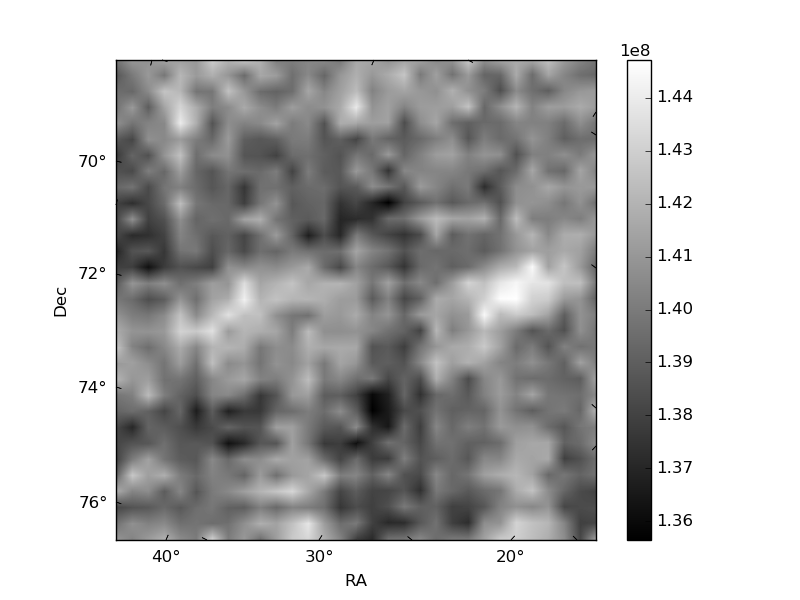
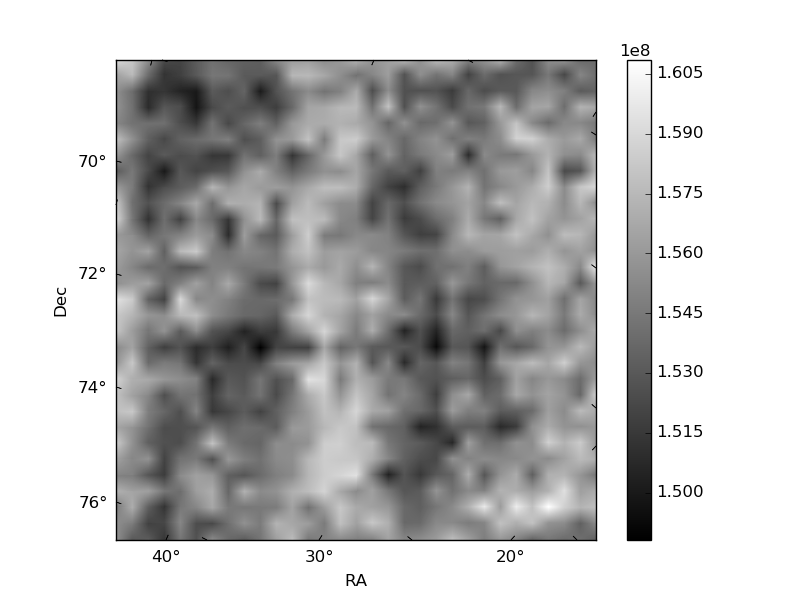
Histogram calculated using DETX and DETY for each event in the final _common_clean file
| Quadrant A | 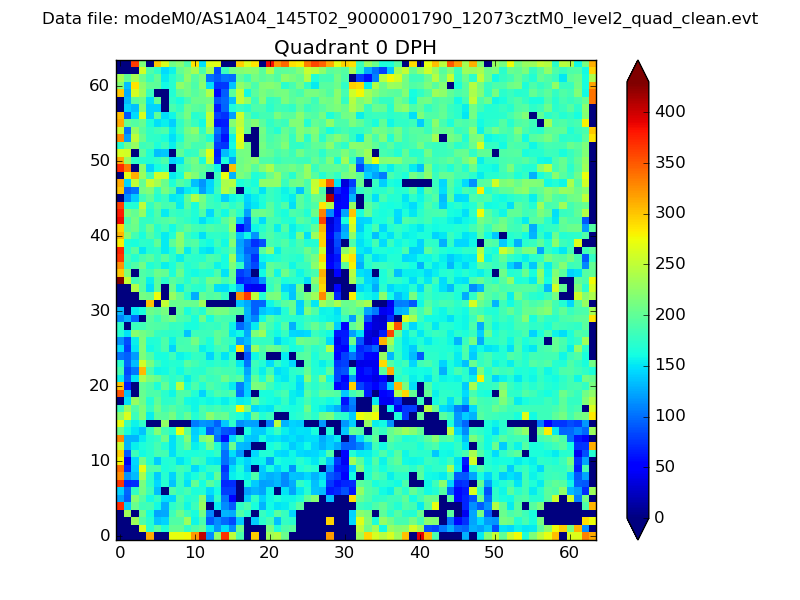 |
 |
Quadrant B |
|---|---|---|---|
| Quadrant D | 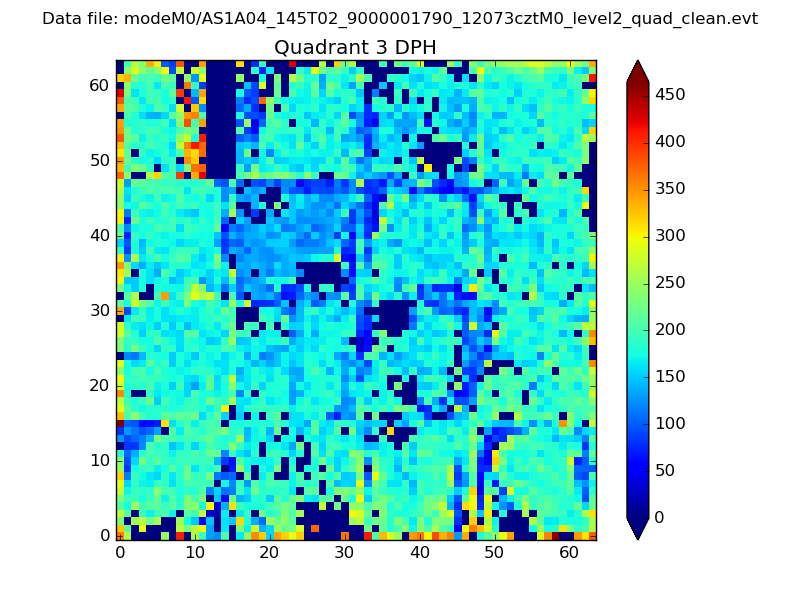 |
 |
Quadrant C |
| Plot type | Count rate plots | Images |
|---|---|---|
| Comparison with Poisson distribution Blue bars denote a histogram of data divided into 1 sec bins. Red curve is a Poisson curve with rate = median count rate of data. |
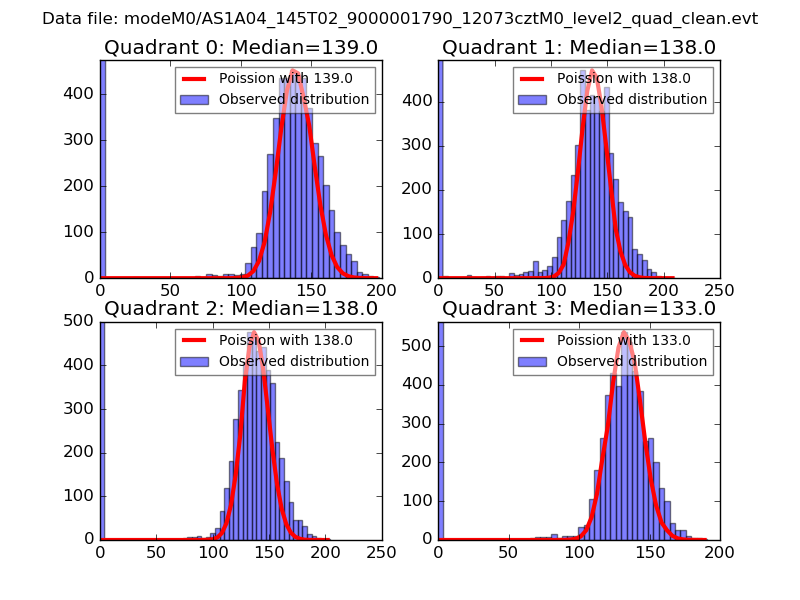 |
 |
| Quadrant-wise count rates Data is divided into 100 sec bins |
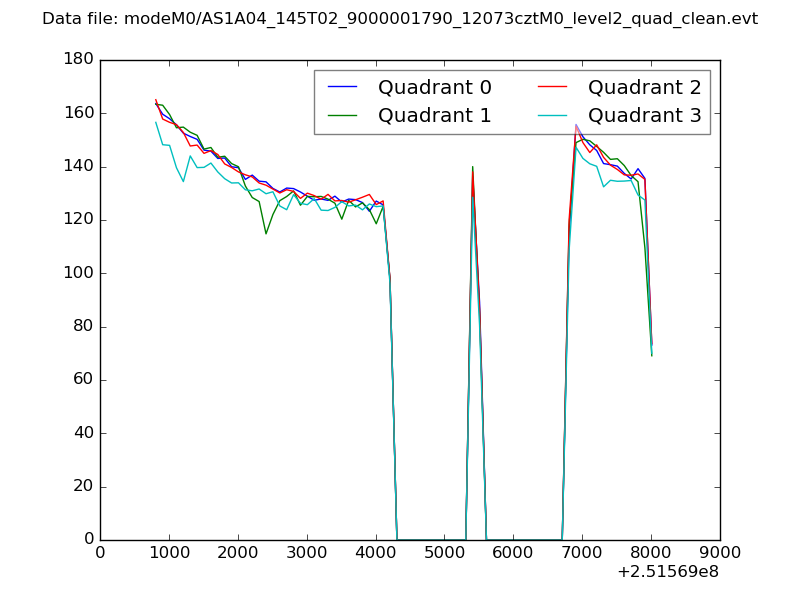 |
|
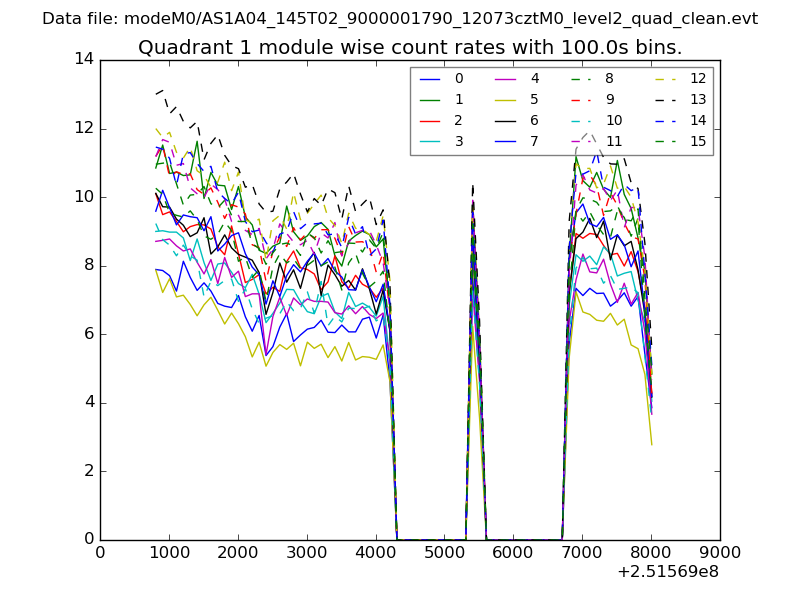
| Module-wise count rates for Quadrant A Data is divided into 100 sec bins |
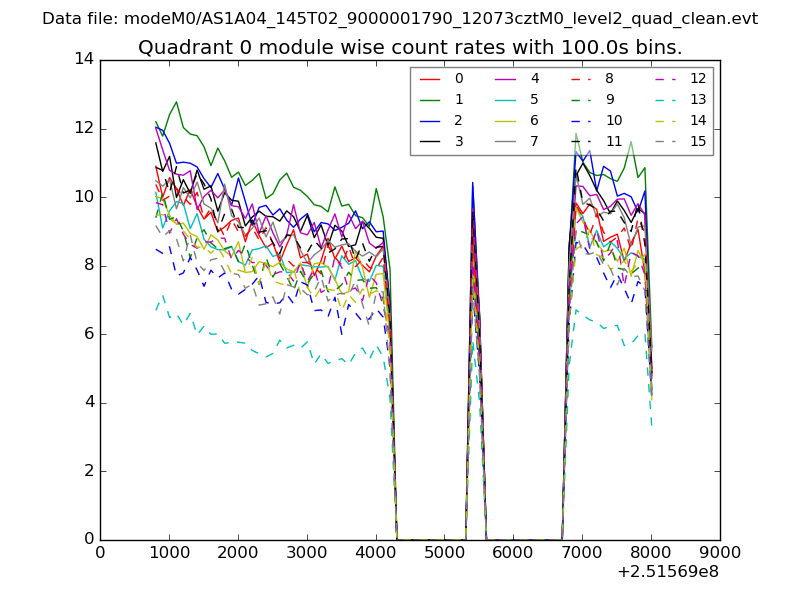 |
 |
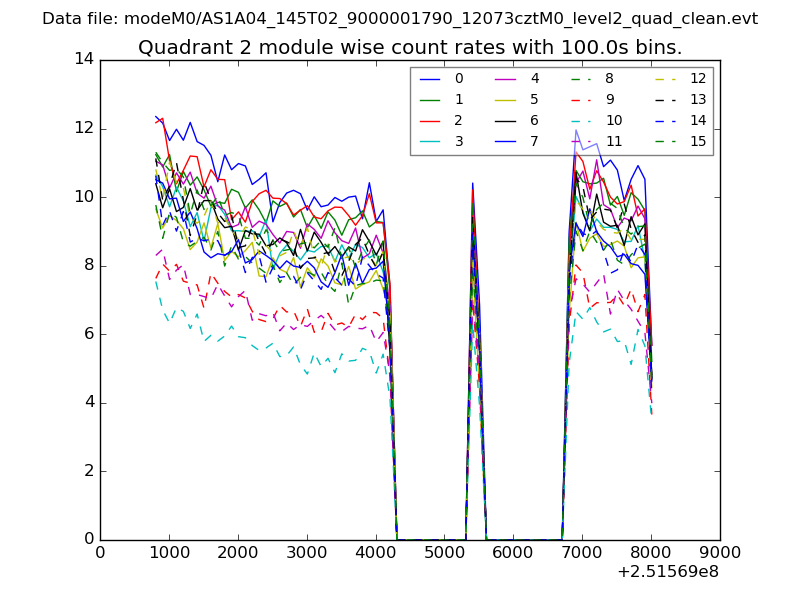
| Module-wise count rates for Quadrant B Data is divided into 100 sec bins |
 |
 |
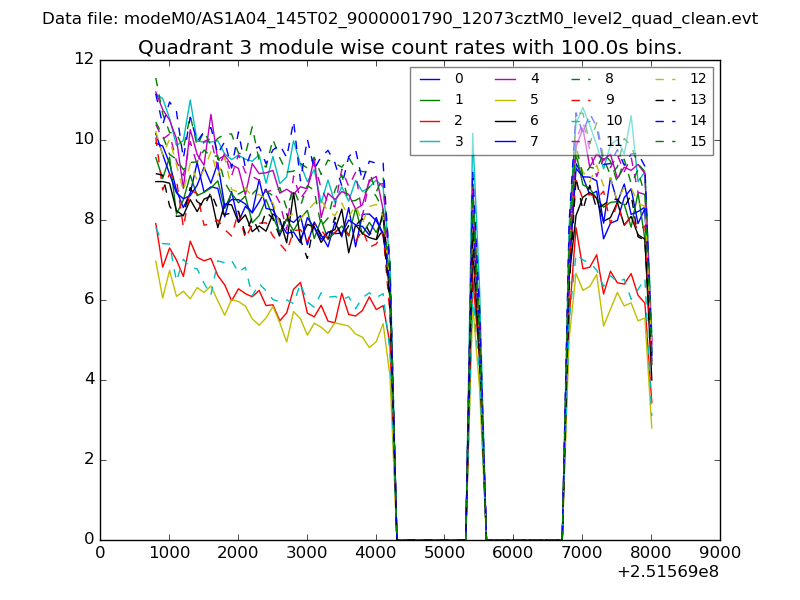
| Module-wise count rates for Quadrant C Data is divided into 100 sec bins |
 |
 |
| Module-wise count rates for Quadrant D Data is divided into 100 sec bins |
 |
 |
| Parameter | Plot |
|---|---|
| CZT HV Monitor | 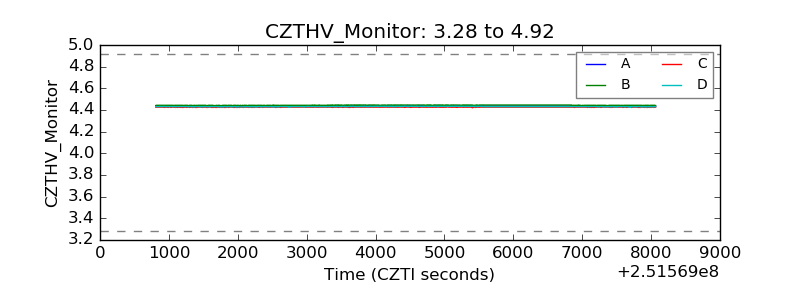 |
| D_VDD | 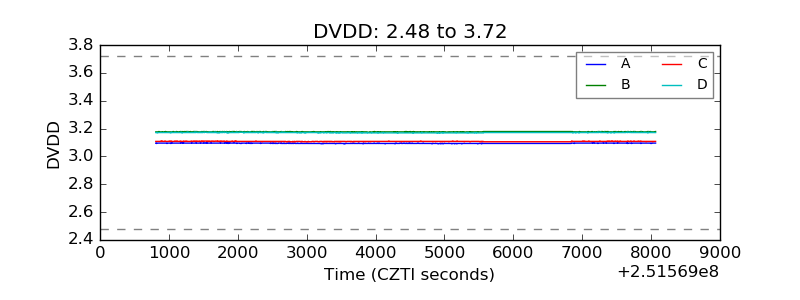 |
| Temperature 1 | 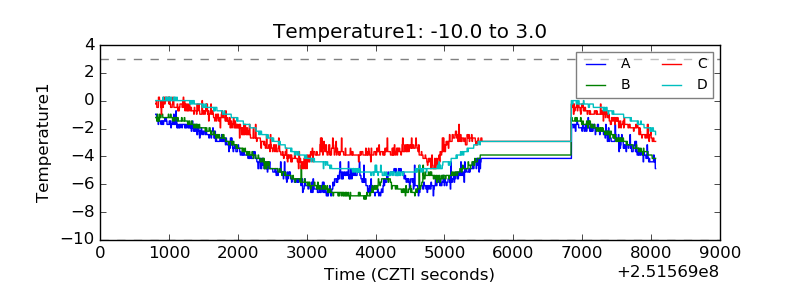 |
| Veto HV Monitor | 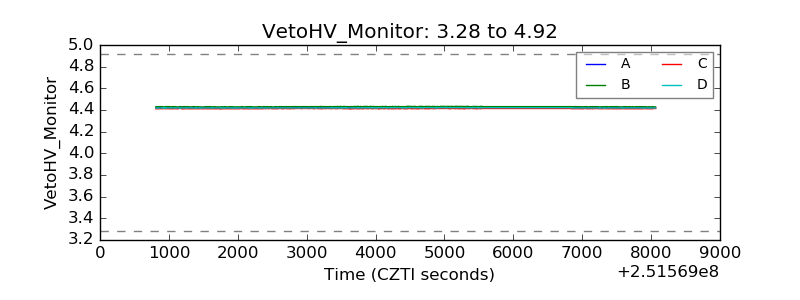 |
| Veto LLD | 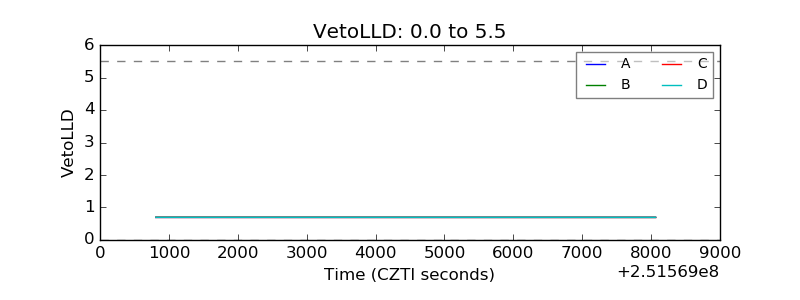 |
| Alpha Counter | 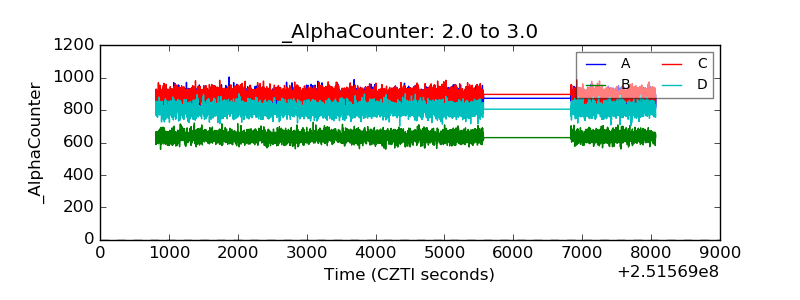 |
| _CPM_Rate | 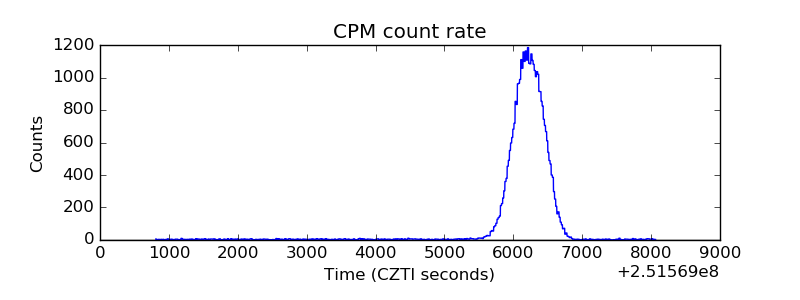 |
| CZT Counter | 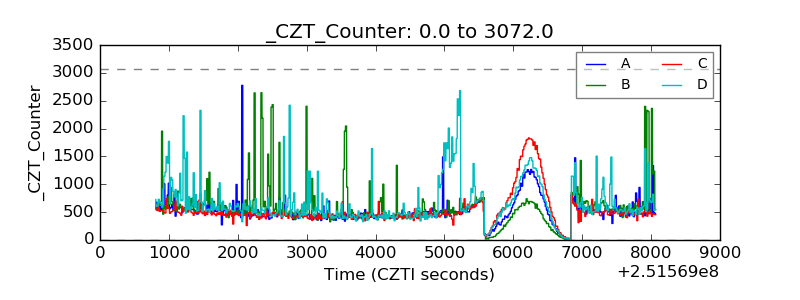 |
| +2.5 Volts monitor |  |
| +5 Volts monitor |  |
| _ROLL_ROT | 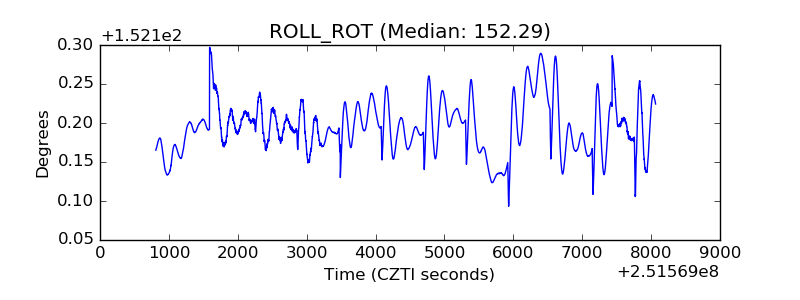 |
| _Roll_DEC |  |
| _Roll_RA | 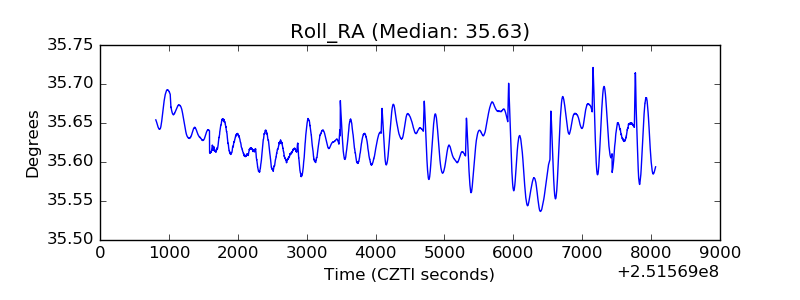 |
| Veto Counter | 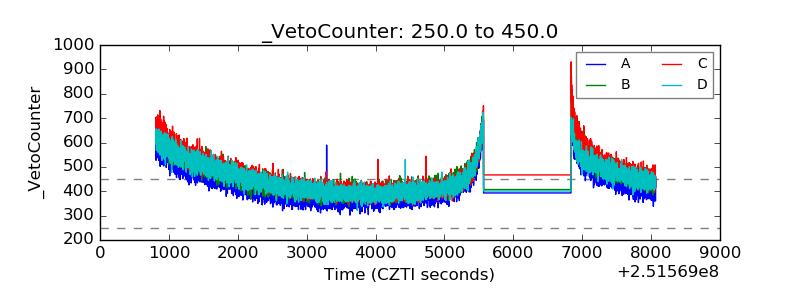 |