| Param | Original file | Final file |
|---|---|---|
| Filename | modeM0/AS1A04_176T01_9000001786_12062cztM0_level2.evt | modeM0/AS1A04_176T01_9000001786_12062cztM0_level2_quad_clean.evt |
| Size (bytes) | 417,219,840 | 68,304,960 |
| Size | 397.9 MB | 65.1 MB |
| Events in quadrant A | 2,492,567 | 437,503 |
| Events in quadrant B | 4,038,731 | 422,005 |
| Events in quadrant C | 2,376,726 | 427,255 |
| Events in quadrant D | 3,370,353 | 413,395 |
| Mode M0 | |||
|---|---|---|---|
| Quadrant | BADHDUFLAG | Total packets | Discarded packets |
| A | 0 | 10945 | 2 |
| B | 0 | 15704 | 1 |
| C | 0 | 10822 | 1 |
| D | 0 | 13691 | 1 |
| Mode SS | |||
|---|---|---|---|
| Quadrant | BADHDUFLAG | Total packets | Discarded packets |
| A | 0 | 106 | 0 |
| B | 0 | 106 | 0 |
| C | 0 | 106 | 0 |
| D | 0 | 106 | 0 |
| Mode M9 | |||
|---|---|---|---|
| Quadrant | BADHDUFLAG | Total packets | Discarded packets |
| A | 0 | 2 | 0 |
| B | 0 | 2 | 0 |
| C | 0 | 2 | 0 |
| D | 0 | 2 | 0 |
| Quadrant | Total seconds | Saturated seconds | Saturation percentage |
|---|---|---|---|
| A | 5256 | 85 | 1.617199% |
| B | 5256 | 440 | 8.371385% |
| C | 5256 | 50 | 0.951294% |
| D | 5256 | 250 | 4.756469% |
Noise dominated data is calculated using 1-second bins in cleaned event files. If a bin has >2000 counts, and if more than 50% of those come from <1% of pixels, then it is considered to be noise-dominated and hence unusable.
| Quadrant | # 1 sec bins | Bins with >0 counts | Bins with >2000 counts | High rate bins dominated by noise | Noise dominated (total time) | Noise dominated (detector-on time) | Marked lightcurve |
|---|---|---|---|---|---|---|---|
| A | 5457 | 5257 | 6 | 6 | 0.11% | 0.11% | 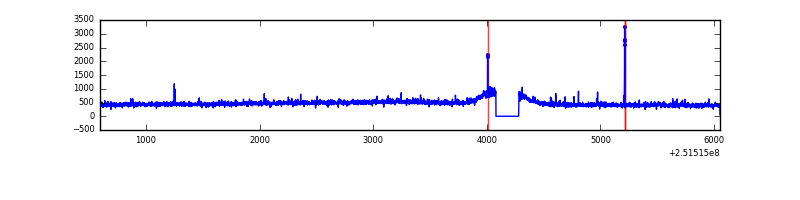 |
| B | 5457 | 5257 | 207 | 207 | 3.79% | 3.94% | 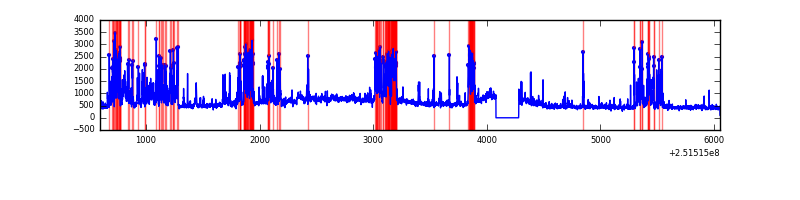 |
| C | 5457 | 5258 | 0 | 0 | 0.00% | 0.00% |  |
| D | 5457 | 5258 | 146 | 146 | 2.68% | 2.78% | 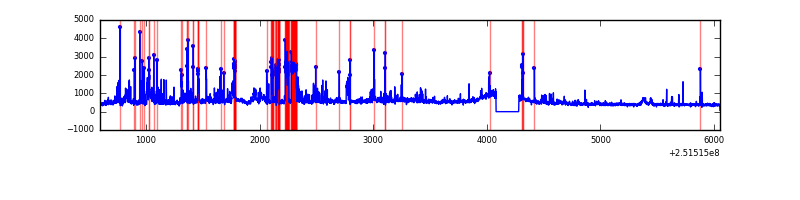 |
Top three noisy pixels from each quadrant. If the there are fewer than three noisy pixels in the level2.evt file, extra rows are filled as -1
| Pixel properties | Quadrant properties | ||||||
|---|---|---|---|---|---|---|---|
| Quadrant | DetID | PixID | Counts | Sigma | Mean | Median | Sigma |
| A | 13 | 251 | 18973 | 140.87 | 632 | 618 | 130.3 |
| A | 1 | 162 | 15236 | 112.19 | 632 | 618 | 130.3 |
| A | 1 | 178 | 6035 | 41.57 | 632 | 618 | 130.3 |
| B | 4 | 239 | 1212359 | 10059.54 | 617 | 600 | 120.5 |
| B | 4 | 206 | 286365 | 2372.31 | 617 | 600 | 120.5 |
| B | 15 | 204 | 73660 | 606.51 | 617 | 600 | 120.5 |
| C | 13 | 61 | 4448 | 27.01 | 609 | 612 | 142.0 |
| C | 3 | 202 | 1521 | 6.4 | 609 | 612 | 142.0 |
| C | 14 | 234 | 1520 | 6.39 | 609 | 612 | 142.0 |
| D | 1 | 52 | 857572 | 5997.55 | 592 | 573 | 142.9 |
| D | 8 | 195 | 159420 | 1111.66 | 592 | 573 | 142.9 |
| D | 10 | 50 | 32693 | 224.79 | 592 | 573 | 142.9 |
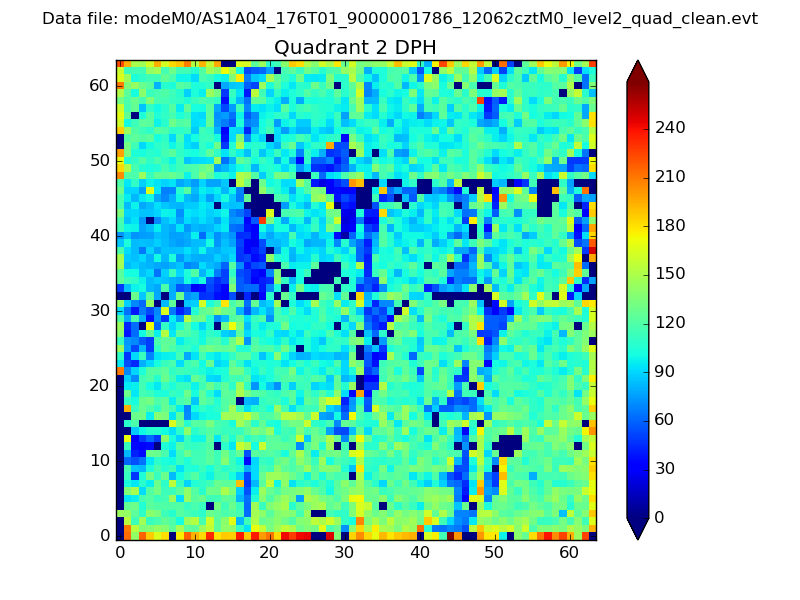
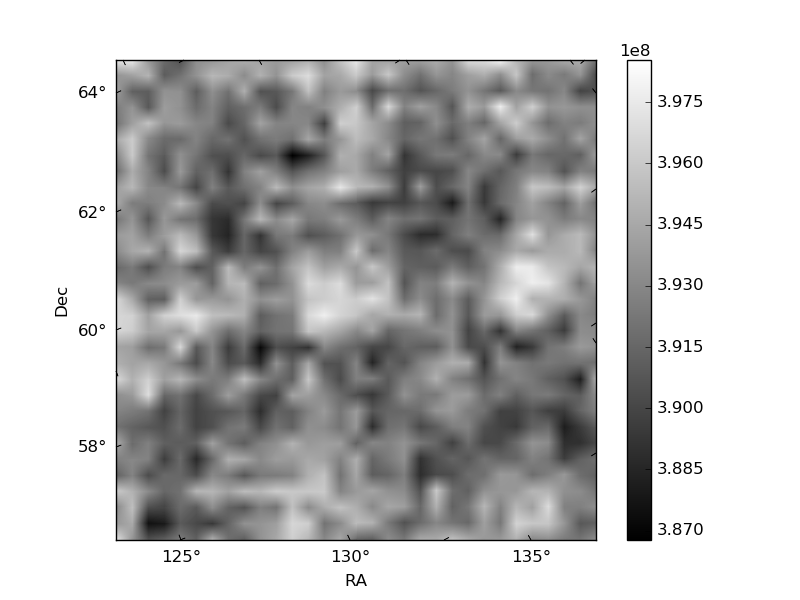
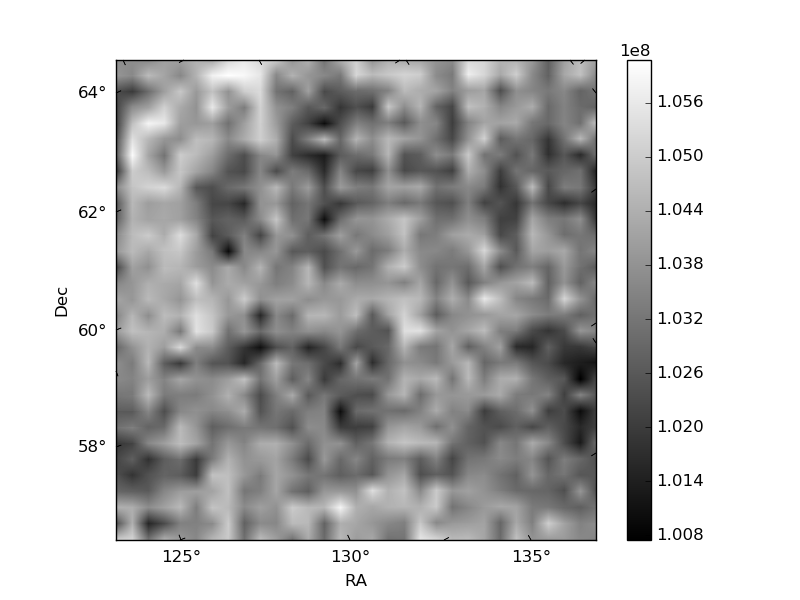
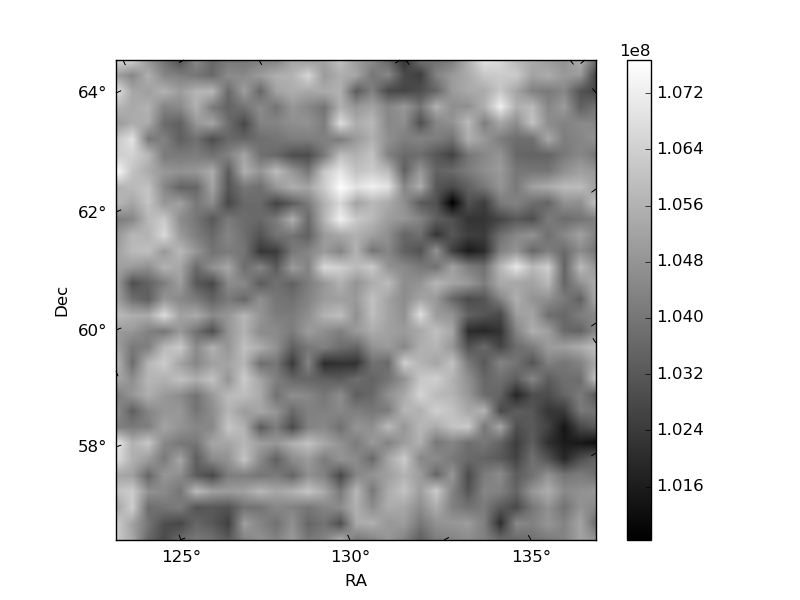
Histogram calculated using DETX and DETY for each event in the final _common_clean file
| Quadrant A | 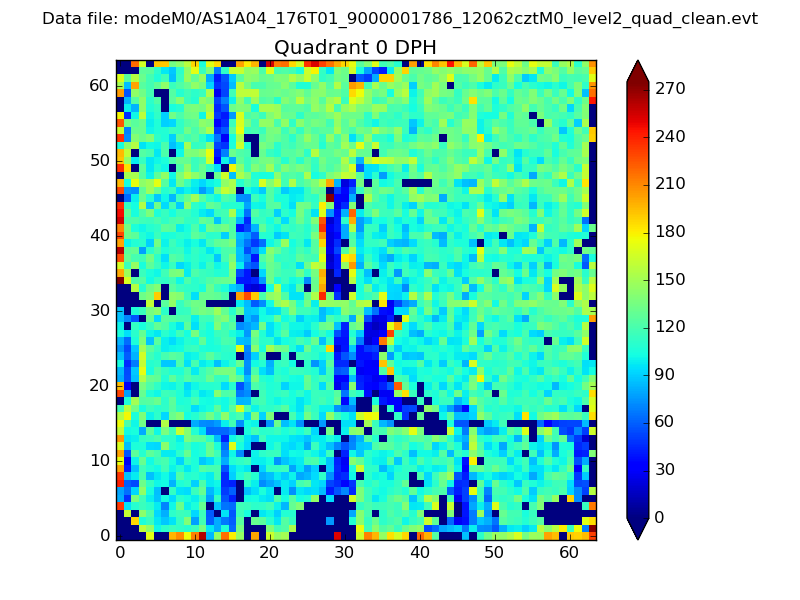 |
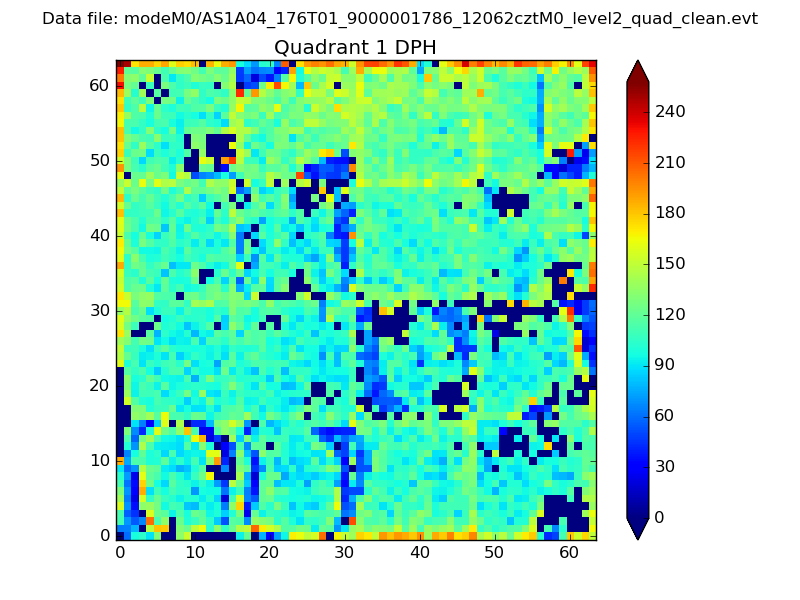 |
Quadrant B |
|---|---|---|---|
| Quadrant D | 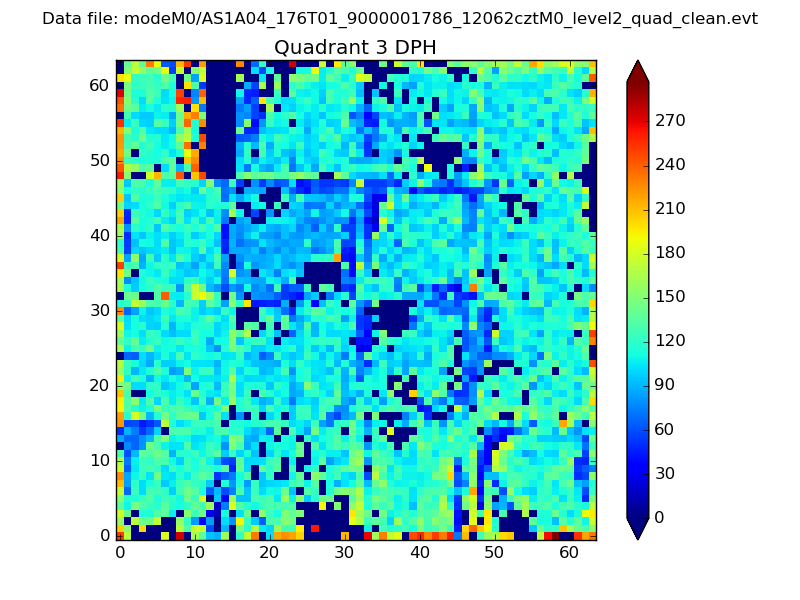 |
 |
Quadrant C |
| Plot type | Count rate plots | Images |
|---|---|---|
| Comparison with Poisson distribution Blue bars denote a histogram of data divided into 1 sec bins. Red curve is a Poisson curve with rate = median count rate of data. |
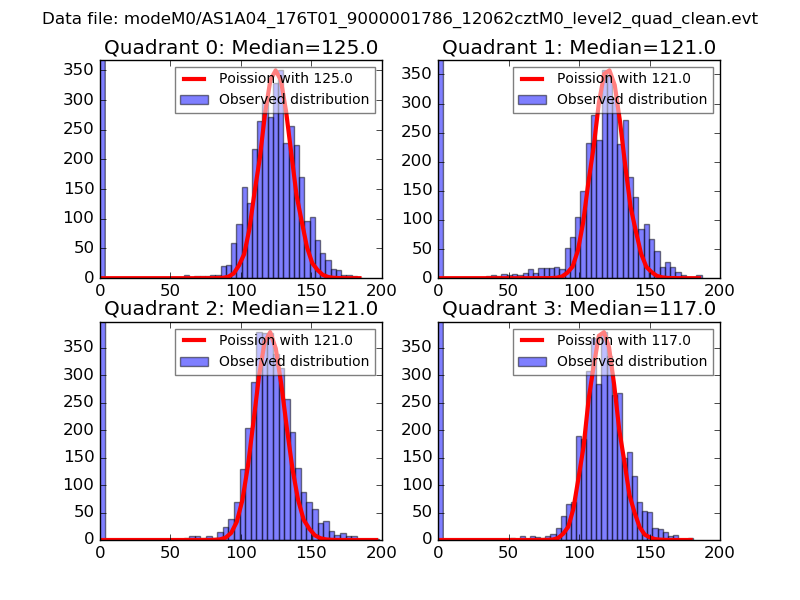 |
 |
| Quadrant-wise count rates Data is divided into 100 sec bins |
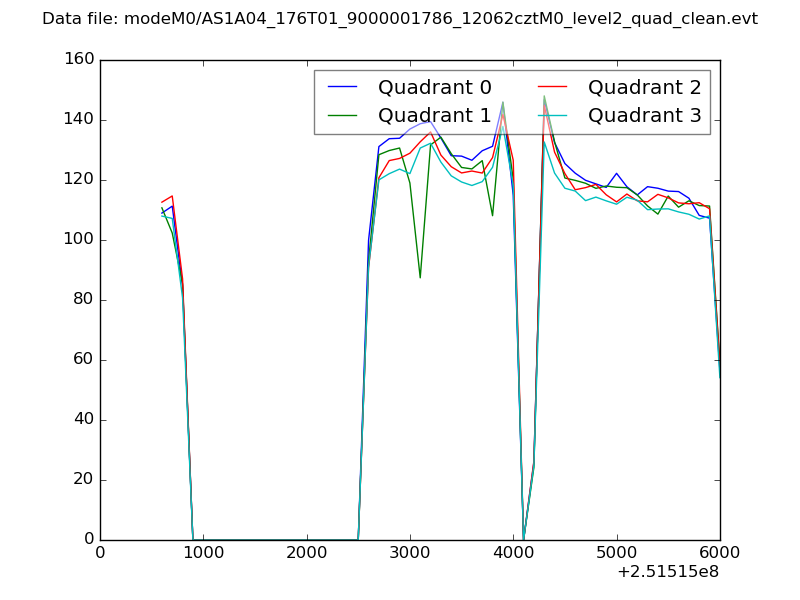 |
|
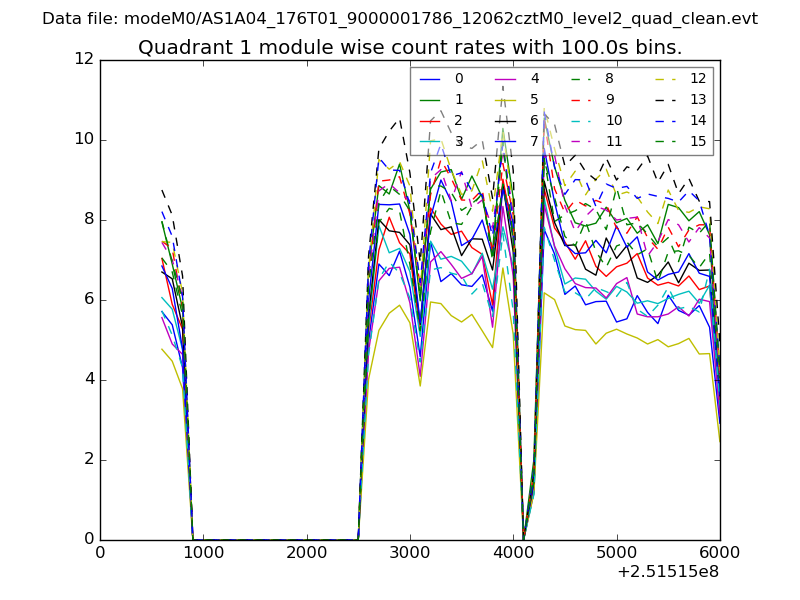
| Module-wise count rates for Quadrant A Data is divided into 100 sec bins |
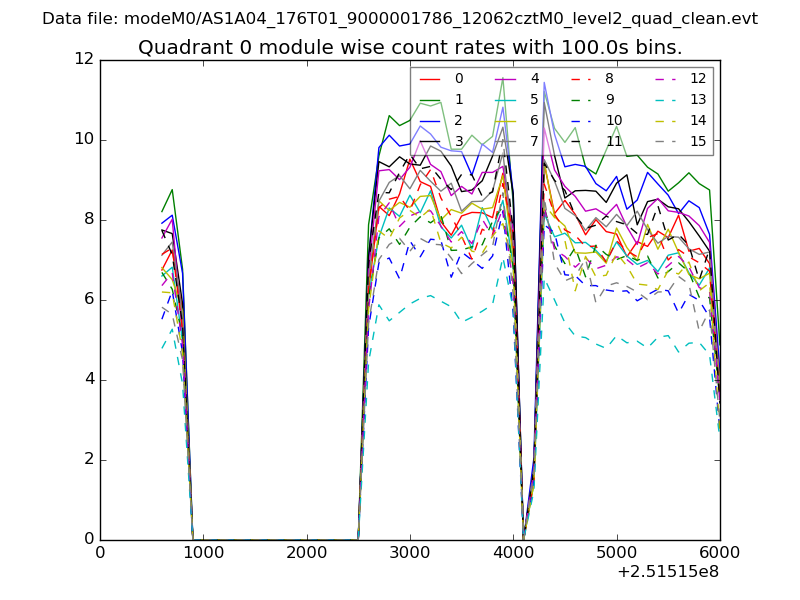 |
 |
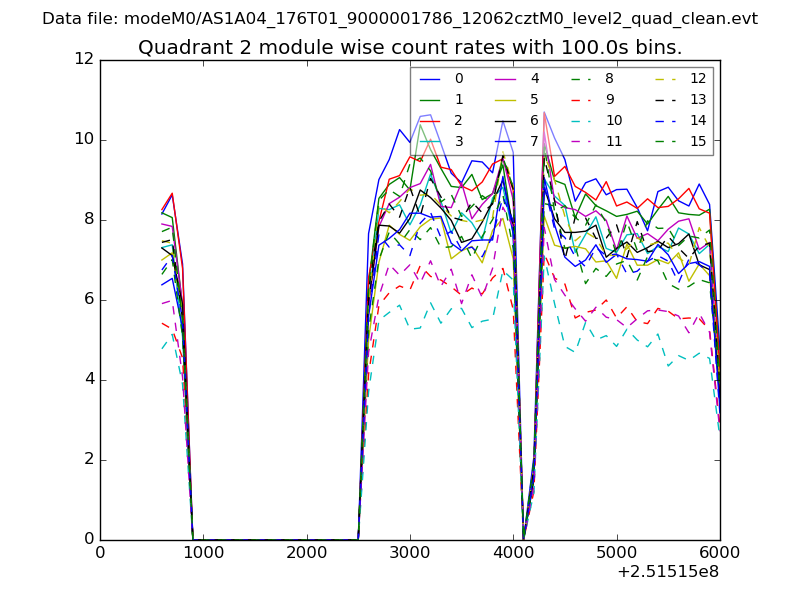
| Module-wise count rates for Quadrant B Data is divided into 100 sec bins |
 |
 |
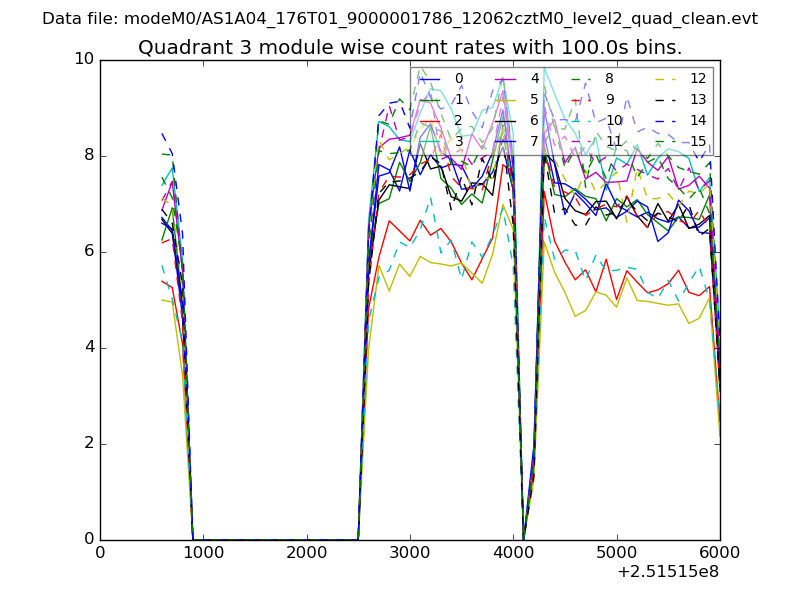
| Module-wise count rates for Quadrant C Data is divided into 100 sec bins |
 |
 |
| Module-wise count rates for Quadrant D Data is divided into 100 sec bins |
 |
 |
| Parameter | Plot |
|---|---|
| CZT HV Monitor | 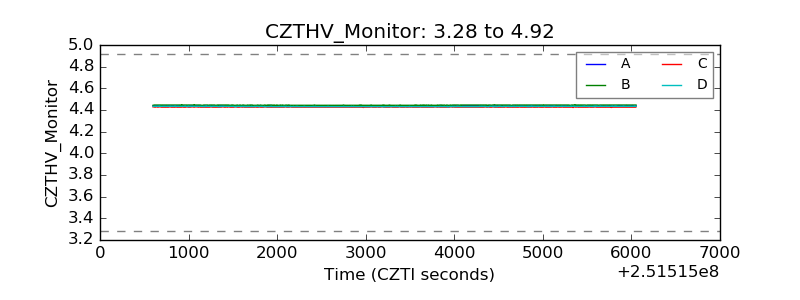 |
| D_VDD | 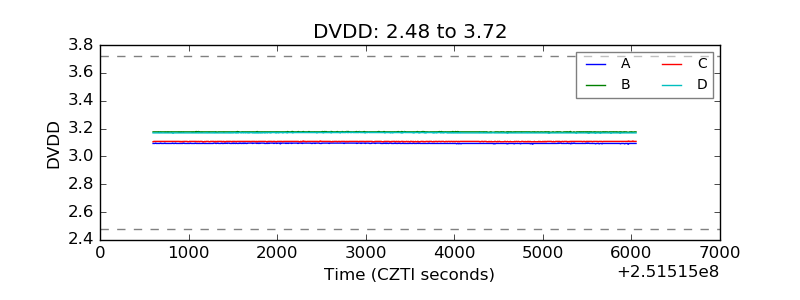 |
| Temperature 1 | 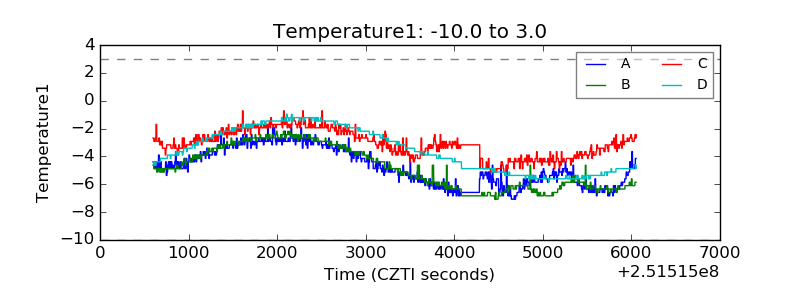 |
| Veto HV Monitor | 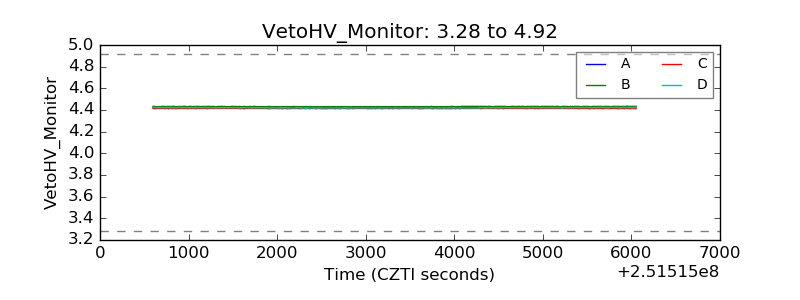 |
| Veto LLD | 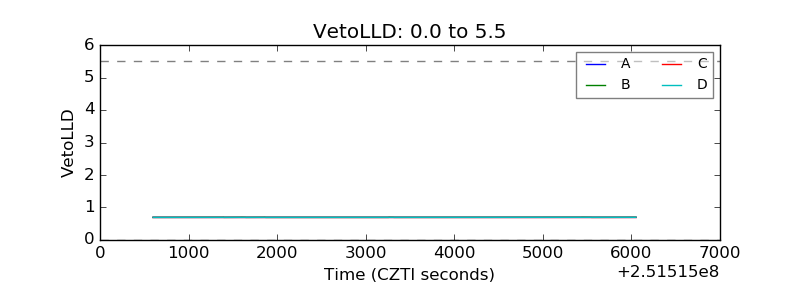 |
| Alpha Counter | 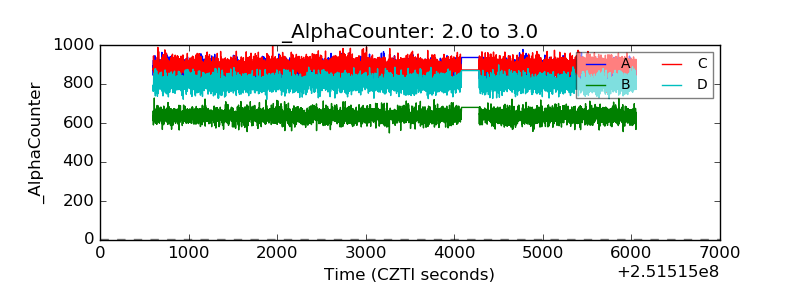 |
| _CPM_Rate | 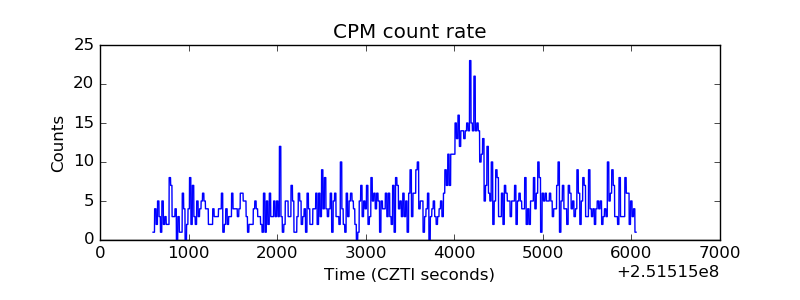 |
| CZT Counter | 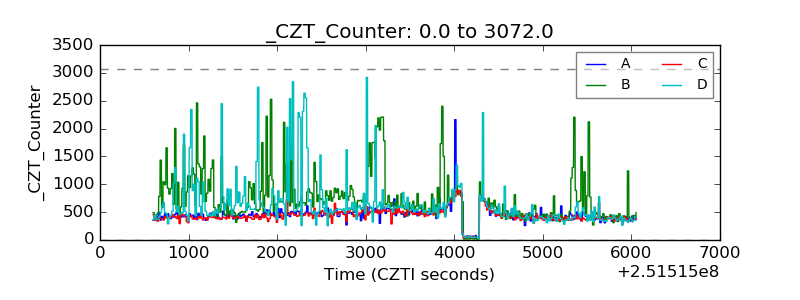 |
| +2.5 Volts monitor |  |
| +5 Volts monitor | 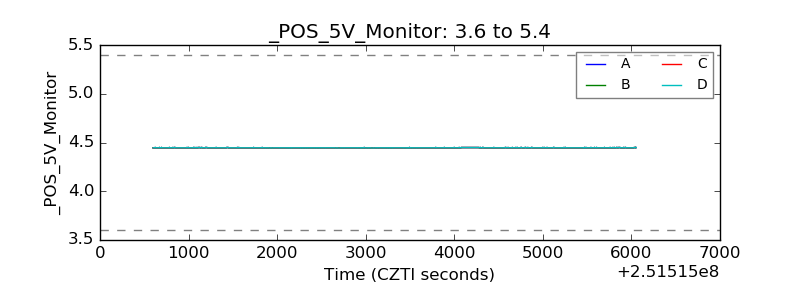 |
| _ROLL_ROT | 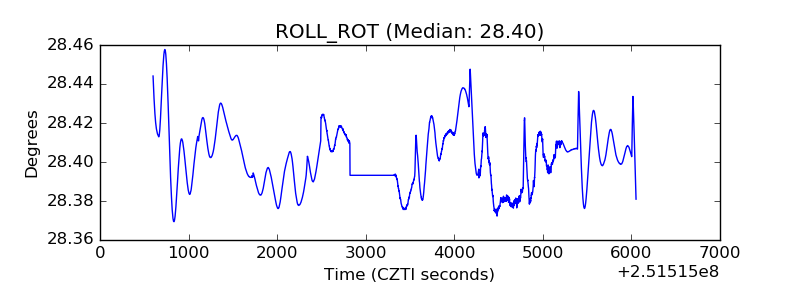 |
| _Roll_DEC | 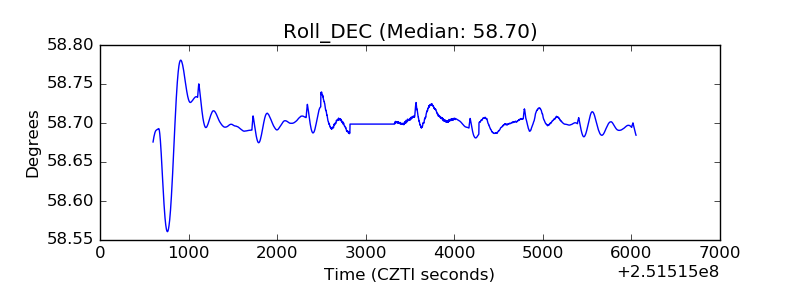 |
| _Roll_RA | 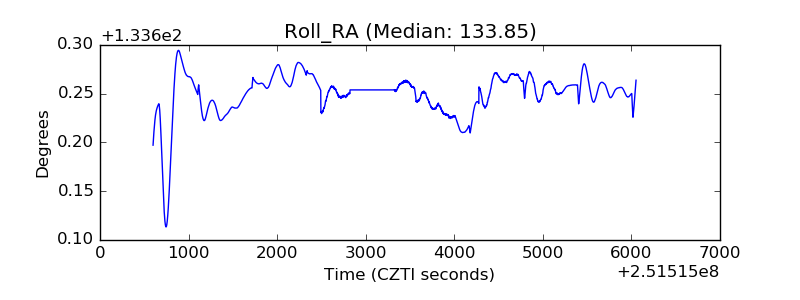 |
| Veto Counter | 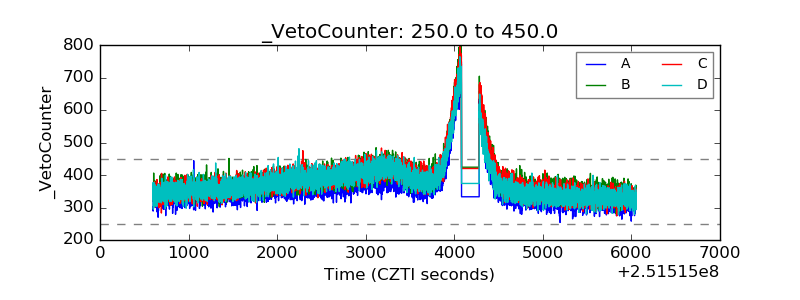 |