| Param | Original file | Final file |
|---|---|---|
| Filename | modeM0/AS1A04_176T01_9000001786_12065cztM0_level2.evt | modeM0/AS1A04_176T01_9000001786_12065cztM0_level2_quad_clean.evt |
| Size (bytes) | 564,376,320 | 102,113,280 |
| Size | 538.2 MB | 97.4 MB |
| Events in quadrant A | 3,420,692 | 672,356 |
| Events in quadrant B | 5,368,316 | 640,807 |
| Events in quadrant C | 3,228,779 | 660,519 |
| Events in quadrant D | 4,585,650 | 616,727 |
| Mode M0 | |||
|---|---|---|---|
| Quadrant | BADHDUFLAG | Total packets | Discarded packets |
| A | 0 | 15123 | 3 |
| B | 0 | 20988 | 2 |
| C | 0 | 14819 | 2 |
| D | 0 | 18616 | 2 |
| Mode SS | |||
|---|---|---|---|
| Quadrant | BADHDUFLAG | Total packets | Discarded packets |
| A | 0 | 148 | 0 |
| B | 0 | 148 | 0 |
| C | 0 | 148 | 0 |
| D | 0 | 148 | 0 |
| Mode M9 | |||
|---|---|---|---|
| Quadrant | BADHDUFLAG | Total packets | Discarded packets |
| A | 0 | 7 | 0 |
| B | 0 | 7 | 0 |
| C | 0 | 7 | 0 |
| D | 0 | 7 | 0 |
| Quadrant | Total seconds | Saturated seconds | Saturation percentage |
|---|---|---|---|
| A | 7203 | 128 | 1.777037% |
| B | 7203 | 633 | 8.788005% |
| C | 7203 | 59 | 0.819103% |
| D | 7203 | 404 | 5.608774% |
Noise dominated data is calculated using 1-second bins in cleaned event files. If a bin has >2000 counts, and if more than 50% of those come from <1% of pixels, then it is considered to be noise-dominated and hence unusable.
| Quadrant | # 1 sec bins | Bins with >0 counts | Bins with >2000 counts | High rate bins dominated by noise | Noise dominated (total time) | Noise dominated (detector-on time) | Marked lightcurve |
|---|---|---|---|---|---|---|---|
| A | 7874 | 7204 | 6 | 6 | 0.08% | 0.08% | 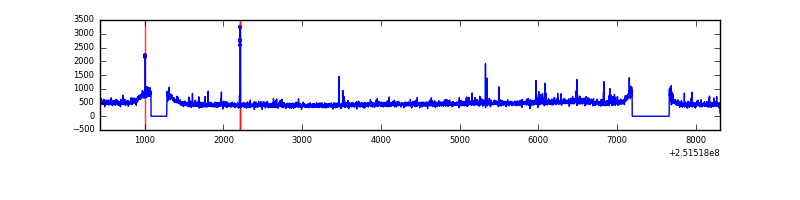 |
| B | 7874 | 7205 | 315 | 315 | 4.00% | 4.37% | 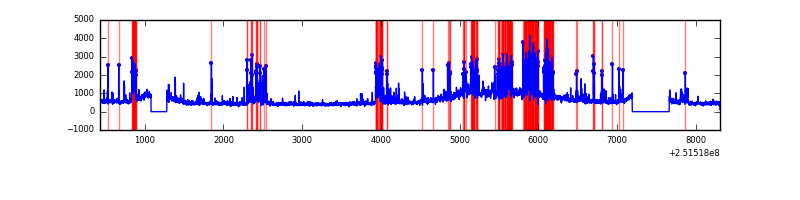 |
| C | 7874 | 7206 | 0 | 0 | 0.00% | 0.00% | 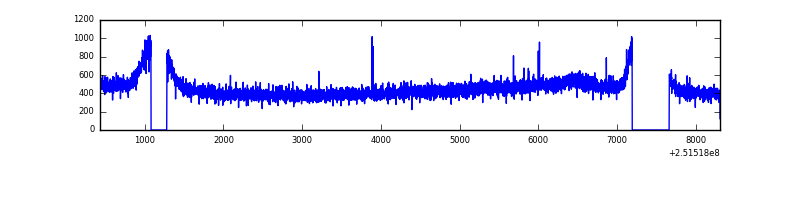 |
| D | 7874 | 7206 | 294 | 294 | 3.73% | 4.08% | 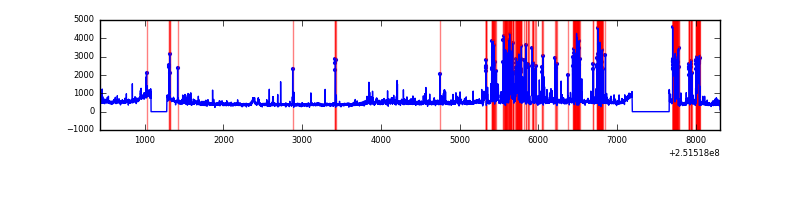 |
Top three noisy pixels from each quadrant. If the there are fewer than three noisy pixels in the level2.evt file, extra rows are filled as -1
| Pixel properties | Quadrant properties | ||||||
|---|---|---|---|---|---|---|---|
| Quadrant | DetID | PixID | Counts | Sigma | Mean | Median | Sigma |
| A | 1 | 162 | 29620 | 163.29 | 853 | 834 | 176.3 |
| A | 13 | 251 | 21452 | 116.96 | 853 | 834 | 176.3 |
| A | 13 | 248 | 19454 | 105.63 | 853 | 834 | 176.3 |
| B | 4 | 239 | 1289329 | 8003.14 | 826 | 803 | 161.0 |
| B | 4 | 206 | 640247 | 3971.64 | 826 | 803 | 161.0 |
| B | 15 | 204 | 94736 | 583.43 | 826 | 803 | 161.0 |
| C | 14 | 234 | 7196 | 33.28 | 826 | 828 | 191.4 |
| C | 13 | 61 | 6070 | 27.39 | 826 | 828 | 191.4 |
| C | 3 | 202 | 2083 | 6.56 | 826 | 828 | 191.4 |
| D | 1 | 52 | 1085347 | 5595.97 | 802 | 775 | 193.8 |
| D | 8 | 195 | 180858 | 929.16 | 802 | 775 | 193.8 |
| D | 12 | 221 | 89270 | 456.6 | 802 | 775 | 193.8 |
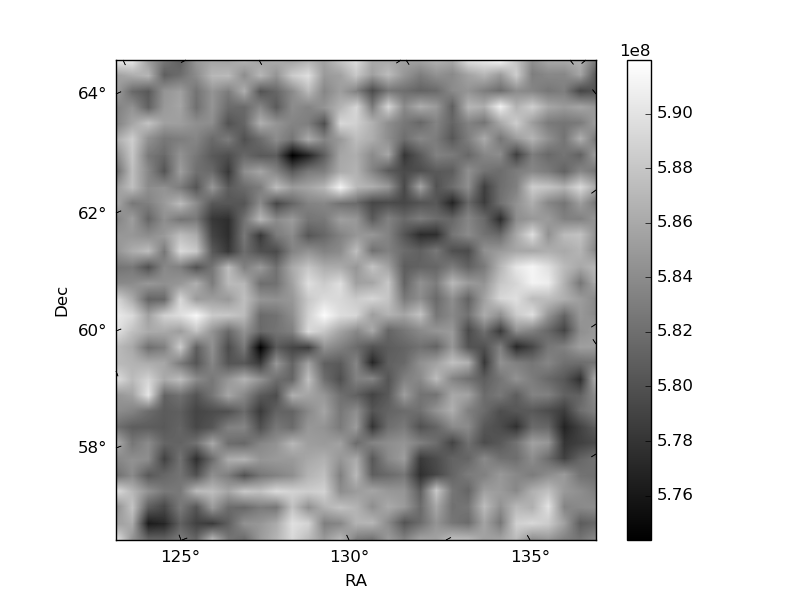
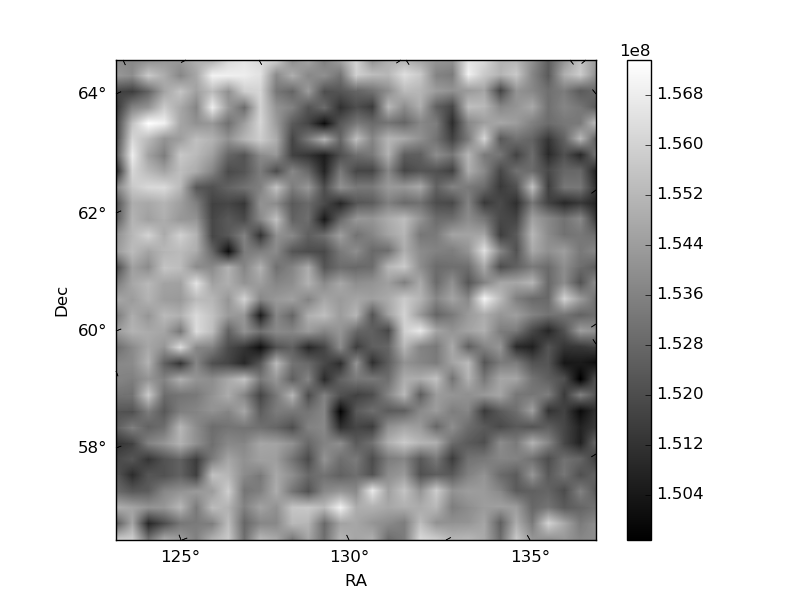
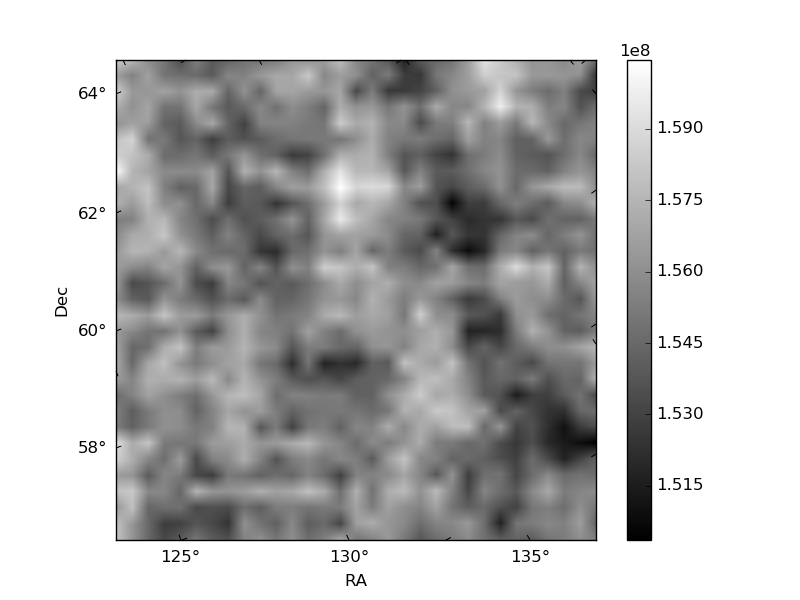
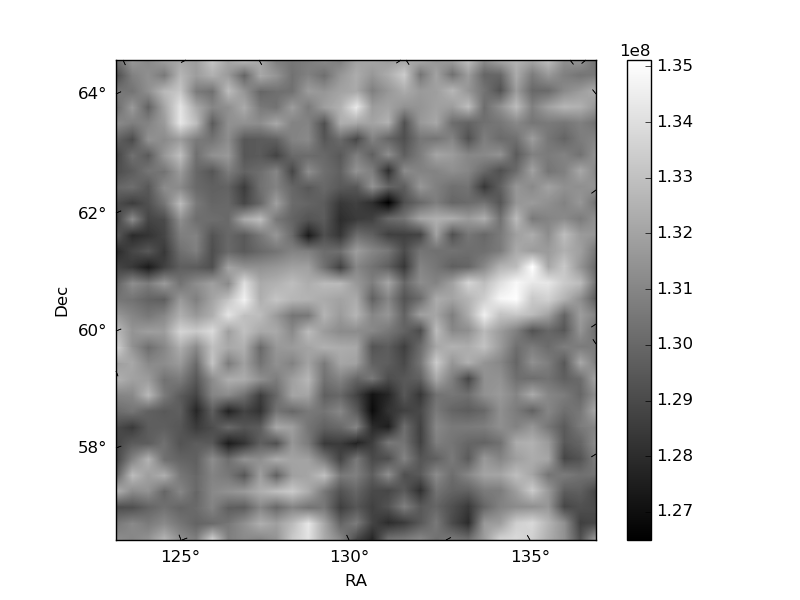
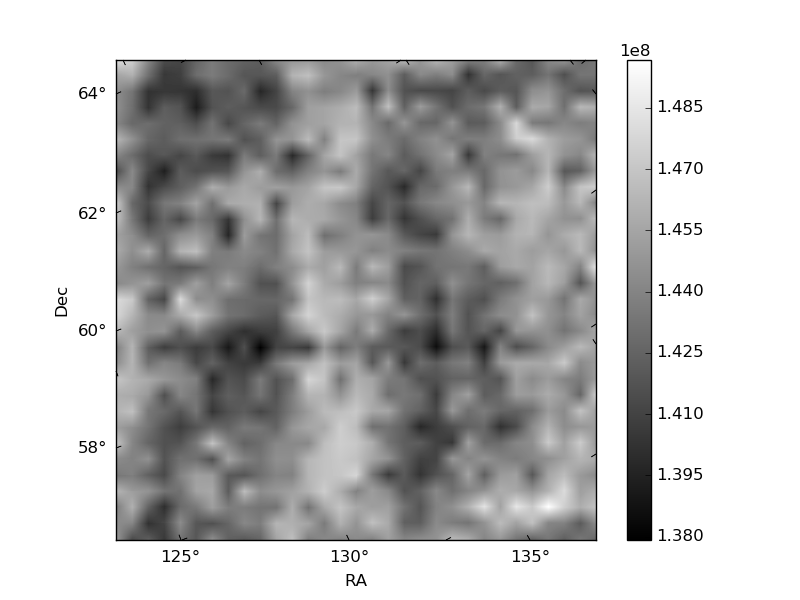
Histogram calculated using DETX and DETY for each event in the final _common_clean file
| Quadrant A | 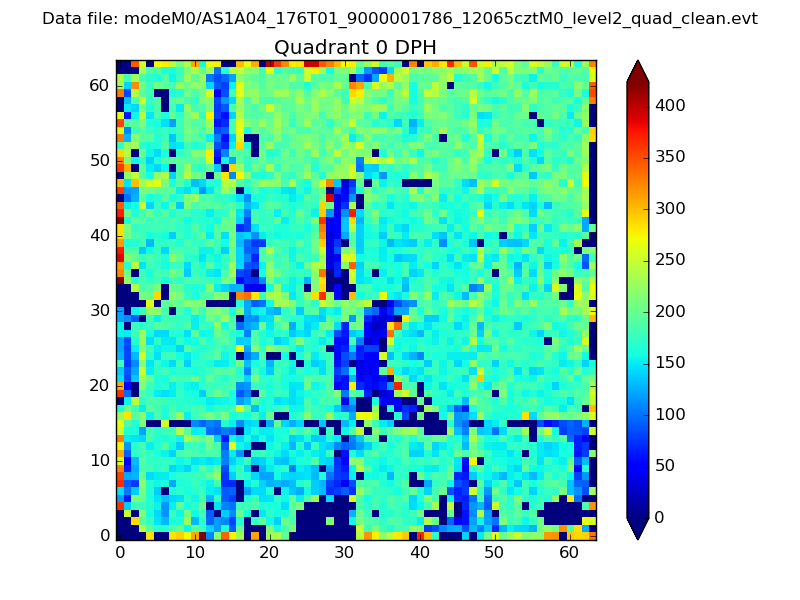 |
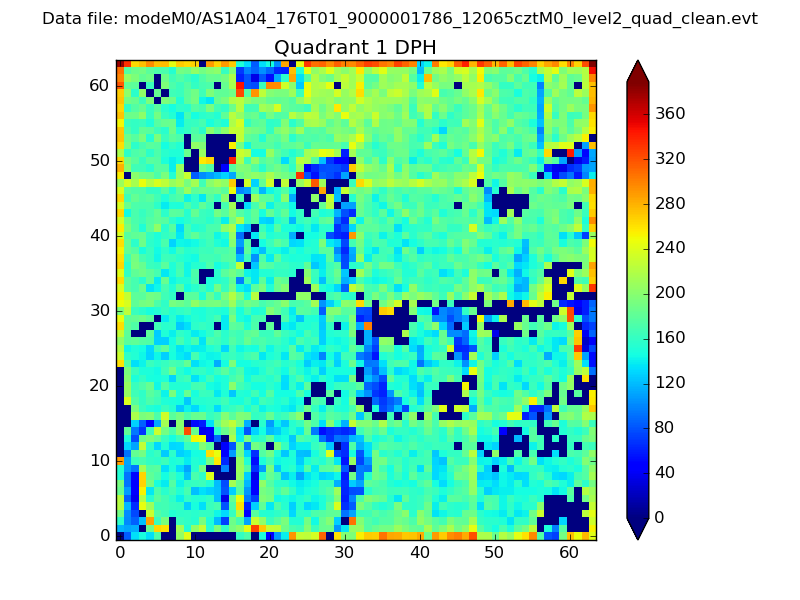 |
Quadrant B |
|---|---|---|---|
| Quadrant D | 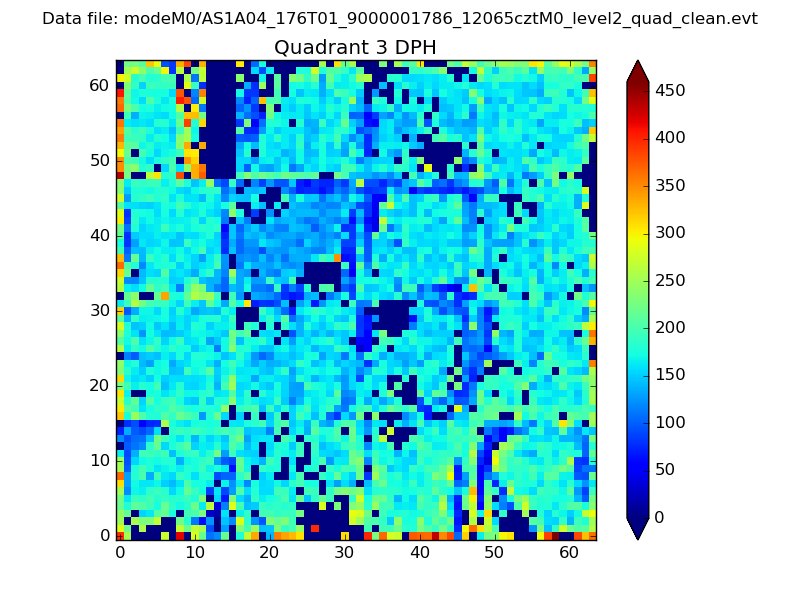 |
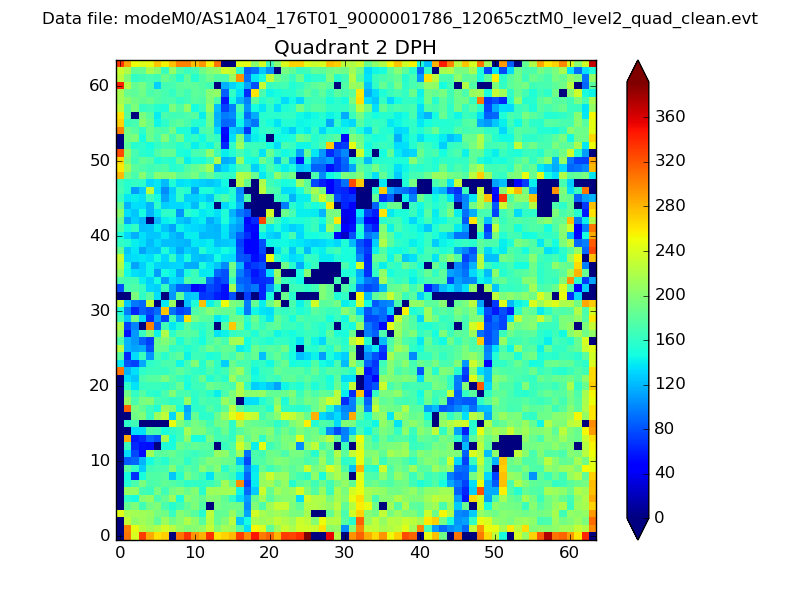 |
Quadrant C |
| Plot type | Count rate plots | Images |
|---|---|---|
| Comparison with Poisson distribution Blue bars denote a histogram of data divided into 1 sec bins. Red curve is a Poisson curve with rate = median count rate of data. |
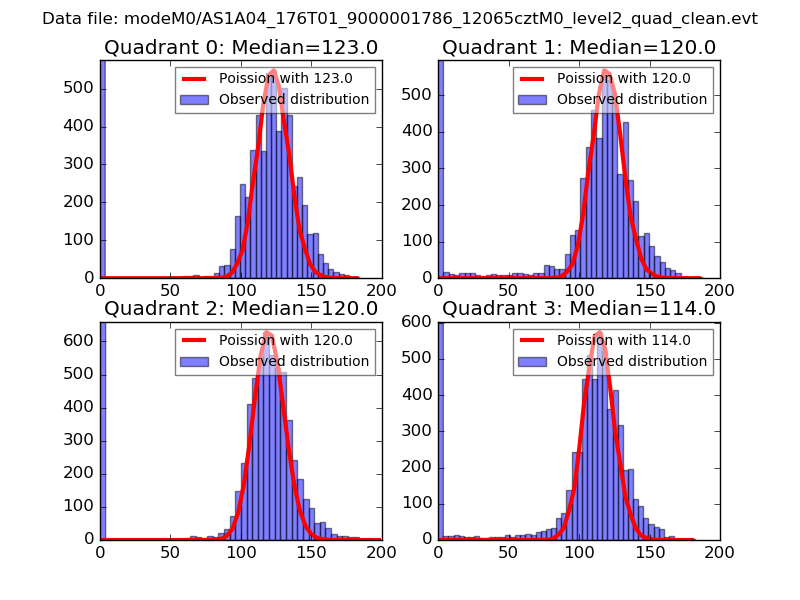 |
 |
| Quadrant-wise count rates Data is divided into 100 sec bins |
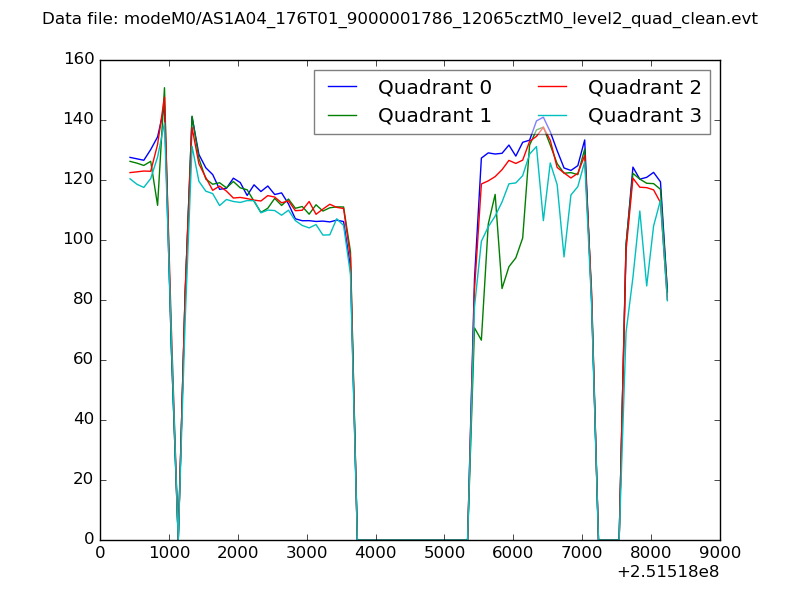 |
|
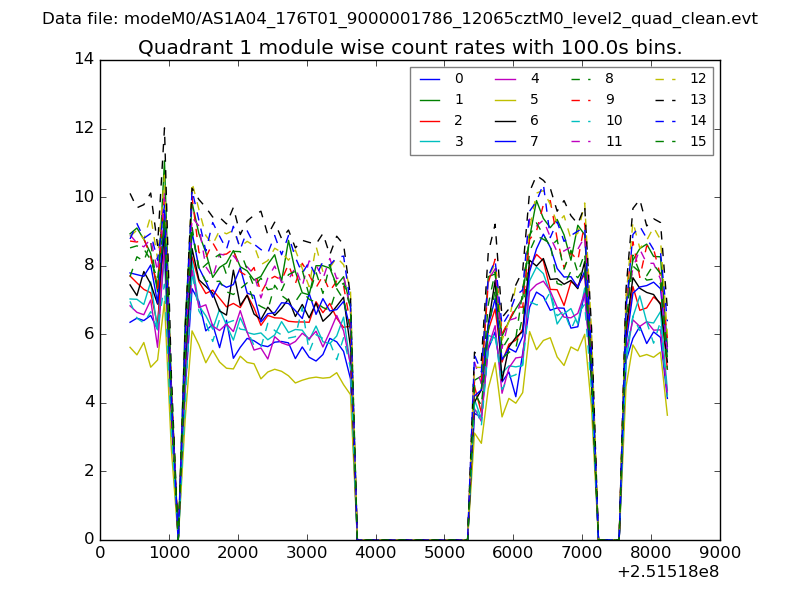
| Module-wise count rates for Quadrant A Data is divided into 100 sec bins |
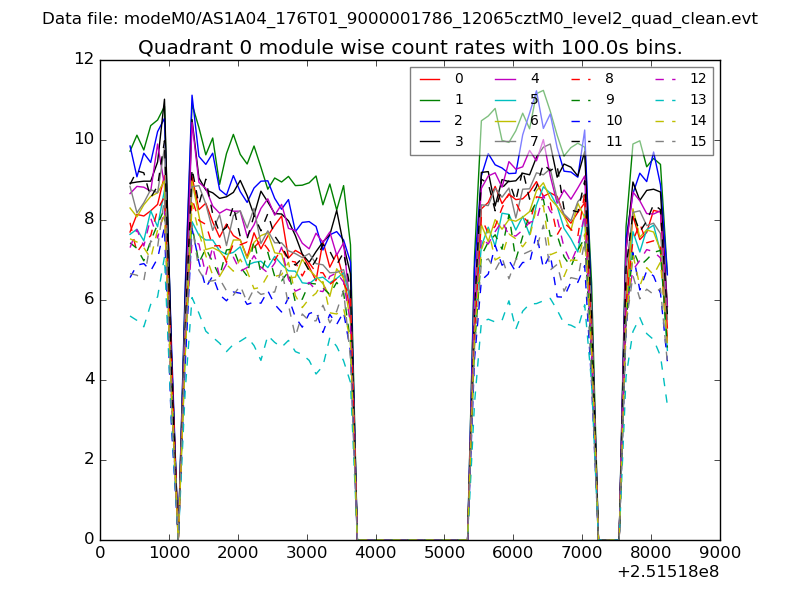 |
 |
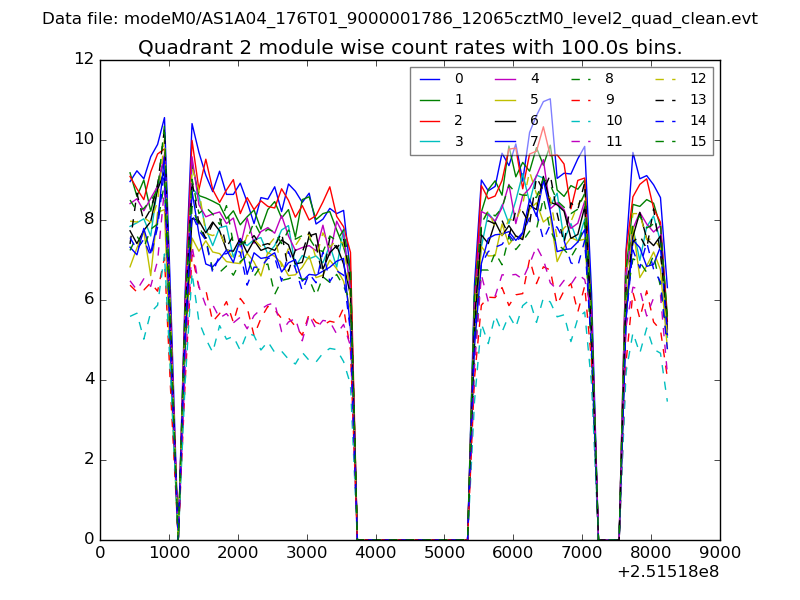
| Module-wise count rates for Quadrant B Data is divided into 100 sec bins |
 |
 |
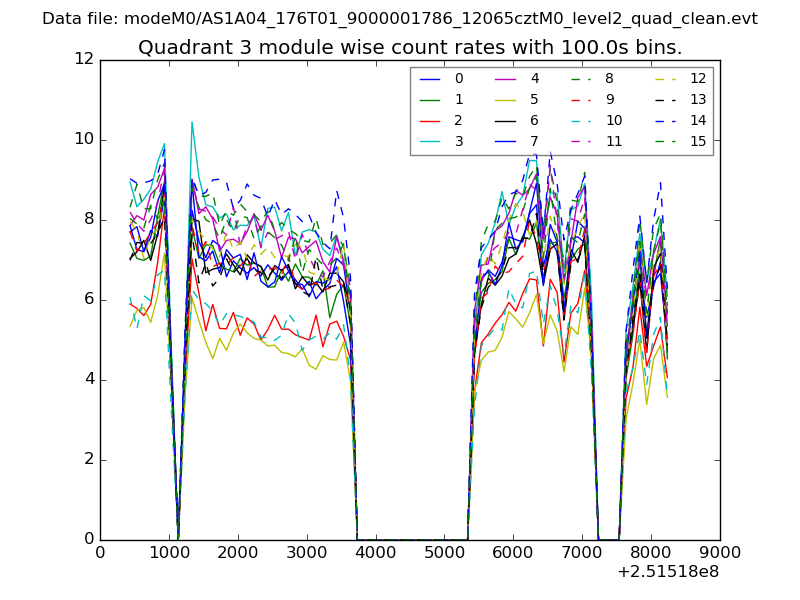
| Module-wise count rates for Quadrant C Data is divided into 100 sec bins |
 |
 |
| Module-wise count rates for Quadrant D Data is divided into 100 sec bins |
 |
 |
| Parameter | Plot |
|---|---|
| CZT HV Monitor | 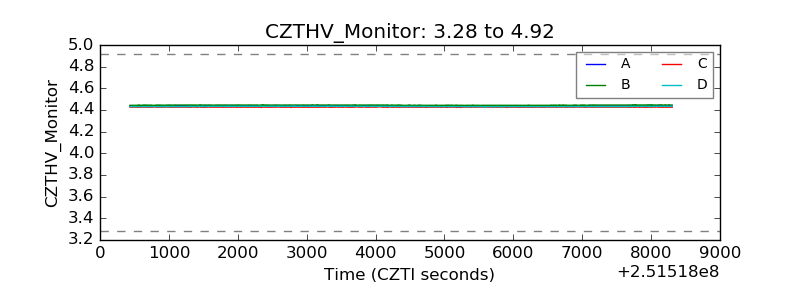 |
| D_VDD | 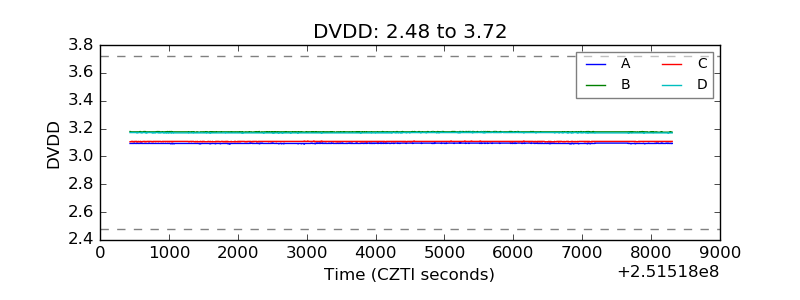 |
| Temperature 1 | 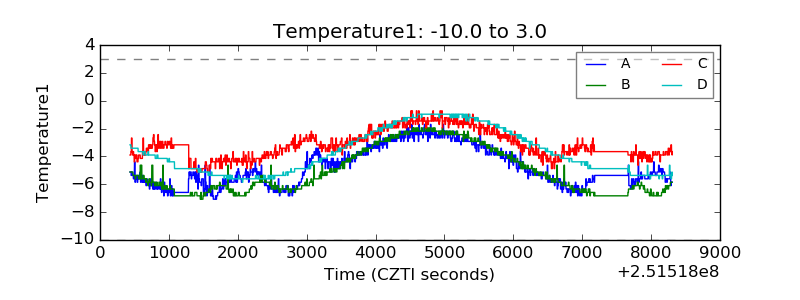 |
| Veto HV Monitor | 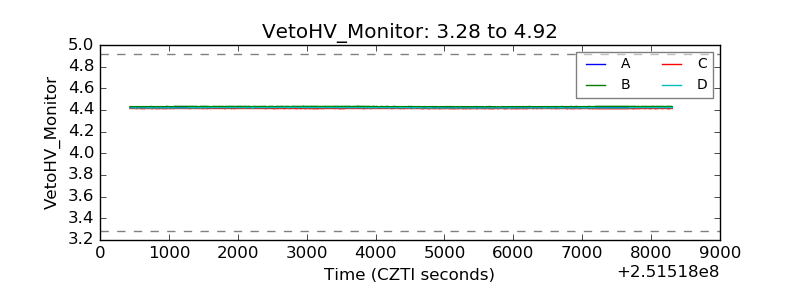 |
| Veto LLD | 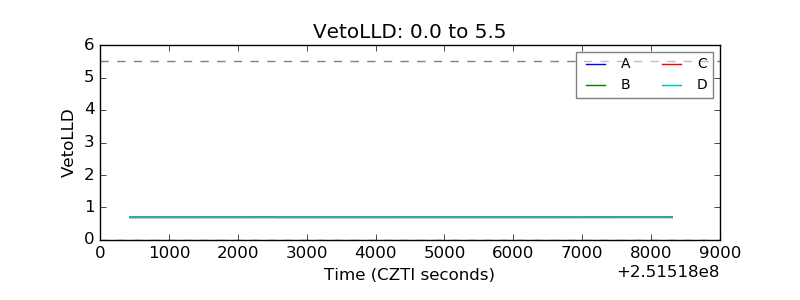 |
| Alpha Counter | 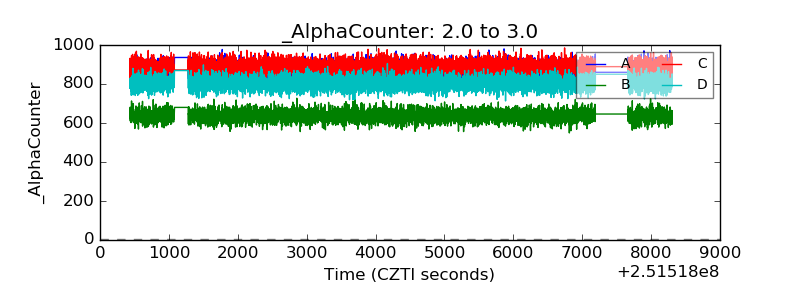 |
| _CPM_Rate | 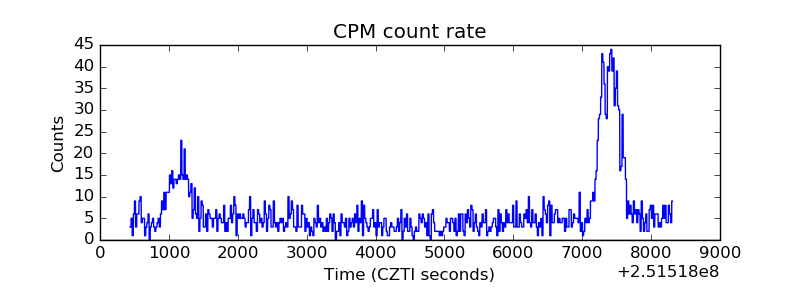 |
| CZT Counter | 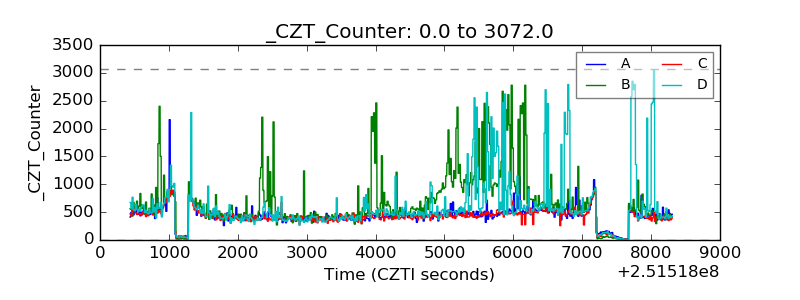 |
| +2.5 Volts monitor | 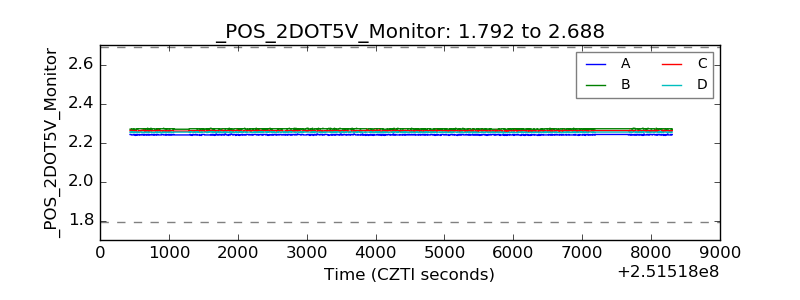 |
| +5 Volts monitor |  |
| _ROLL_ROT | 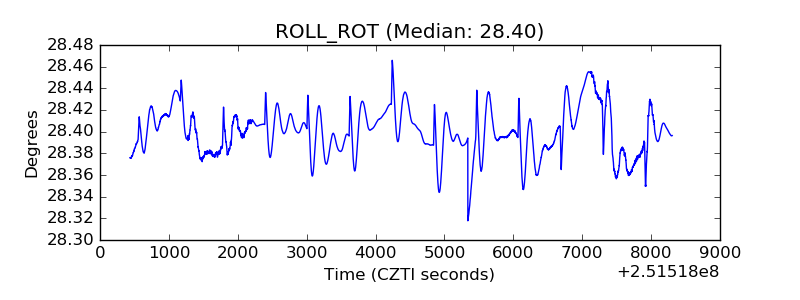 |
| _Roll_DEC | 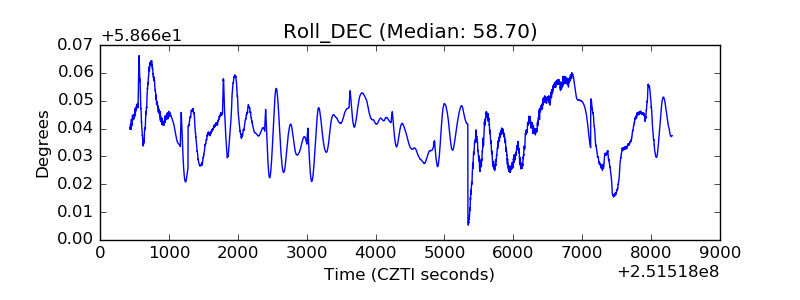 |
| _Roll_RA | 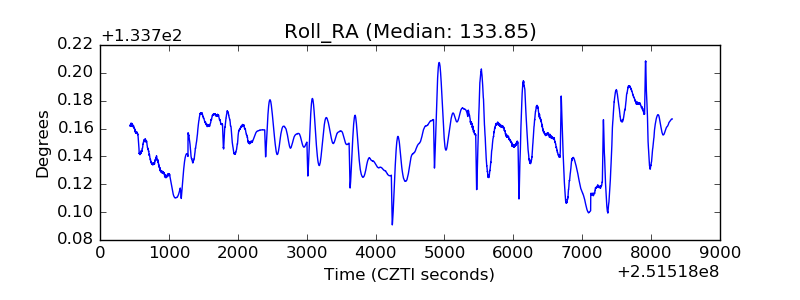 |
| Veto Counter | 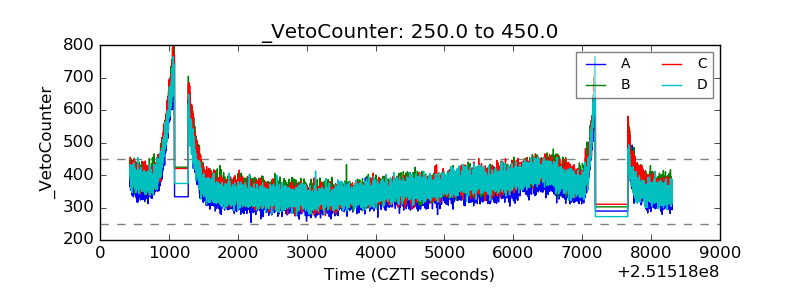 |