| Param | Original file | Final file |
|---|---|---|
| Filename | modeM0/AS1A04_176T01_9000001786_12066cztM0_level2.evt | modeM0/AS1A04_176T01_9000001786_12066cztM0_level2_quad_clean.evt |
| Size (bytes) | 1,416,228,480 | 234,826,560 |
| Size | 1.3 GB | 223.9 MB |
| Events in quadrant A | 9,103,973 | 1,504,082 |
| Events in quadrant B | 13,864,675 | 1,452,886 |
| Events in quadrant C | 8,062,429 | 1,477,902 |
| Events in quadrant D | 10,620,261 | 1,412,229 |
| Mode M0 | |||
|---|---|---|---|
| Quadrant | BADHDUFLAG | Total packets | Discarded packets |
| A | 0 | 38748 | 5 |
| B | 0 | 53554 | 4 |
| C | 0 | 37103 | 4 |
| D | 0 | 43425 | 4 |
| Mode SS | |||
|---|---|---|---|
| Quadrant | BADHDUFLAG | Total packets | Discarded packets |
| A | 0 | 374 | 0 |
| B | 0 | 374 | 0 |
| C | 0 | 374 | 0 |
| D | 0 | 374 | 0 |
| Mode M9 | |||
|---|---|---|---|
| Quadrant | BADHDUFLAG | Total packets | Discarded packets |
| A | 0 | 29 | 0 |
| B | 0 | 29 | 0 |
| C | 0 | 29 | 0 |
| D | 0 | 29 | 0 |
| Quadrant | Total seconds | Saturated seconds | Saturation percentage |
|---|---|---|---|
| A | 18358 | 222 | 1.209282% |
| B | 18358 | 1121 | 6.106330% |
| C | 18358 | 74 | 0.403094% |
| D | 18358 | 532 | 2.897919% |
Noise dominated data is calculated using 1-second bins in cleaned event files. If a bin has >2000 counts, and if more than 50% of those come from <1% of pixels, then it is considered to be noise-dominated and hence unusable.
| Quadrant | # 1 sec bins | Bins with >0 counts | Bins with >2000 counts | High rate bins dominated by noise | Noise dominated (total time) | Noise dominated (detector-on time) | Marked lightcurve |
|---|---|---|---|---|---|---|---|
| A | 21224 | 18360 | 14 | 14 | 0.07% | 0.08% | 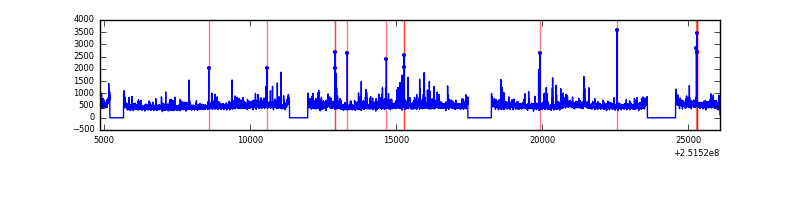 |
| B | 21224 | 18362 | 680 | 680 | 3.20% | 3.70% | 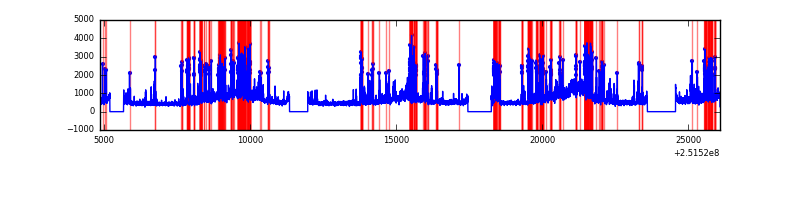 |
| C | 21224 | 18362 | 0 | 0 | 0.00% | 0.00% | 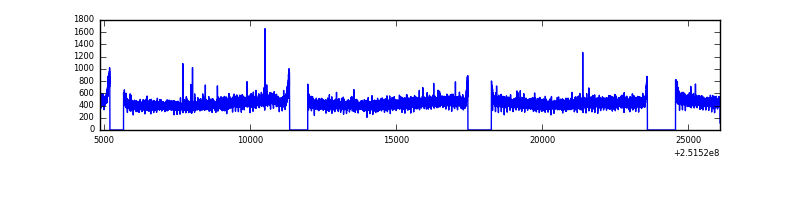 |
| D | 21224 | 18360 | 373 | 373 | 1.76% | 2.03% | 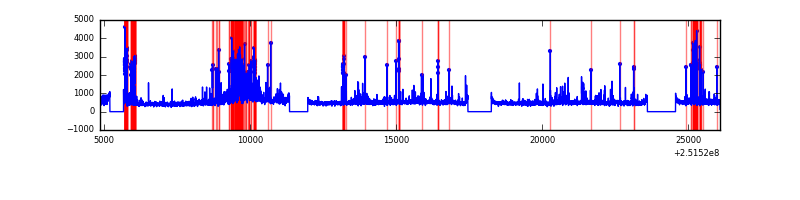 |
Top three noisy pixels from each quadrant. If the there are fewer than three noisy pixels in the level2.evt file, extra rows are filled as -1
| Pixel properties | Quadrant properties | ||||||
|---|---|---|---|---|---|---|---|
| Quadrant | DetID | PixID | Counts | Sigma | Mean | Median | Sigma |
| A | 1 | 162 | 205434 | 466.82 | 2149 | 2108 | 435.6 |
| A | 15 | 239 | 156162 | 353.7 | 2149 | 2108 | 435.6 |
| A | 14 | 63 | 101269 | 227.67 | 2149 | 2108 | 435.6 |
| B | 4 | 239 | 2990757 | 7517.74 | 2097 | 2045 | 397.6 |
| B | 4 | 206 | 2204933 | 5541.1 | 2097 | 2045 | 397.6 |
| B | 15 | 204 | 253280 | 631.95 | 2097 | 2045 | 397.6 |
| C | 13 | 61 | 15199 | 27.69 | 2064 | 2073 | 474.1 |
| C | 0 | 207 | 7457 | 11.36 | 2064 | 2073 | 474.1 |
| C | 12 | 4 | 6433 | 9.2 | 2064 | 2073 | 474.1 |
| D | 1 | 52 | 1672637 | 3427.69 | 2039 | 1981 | 487.4 |
| D | 8 | 195 | 758776 | 1552.72 | 2039 | 1981 | 487.4 |
| D | 13 | 104 | 135982 | 274.93 | 2039 | 1981 | 487.4 |
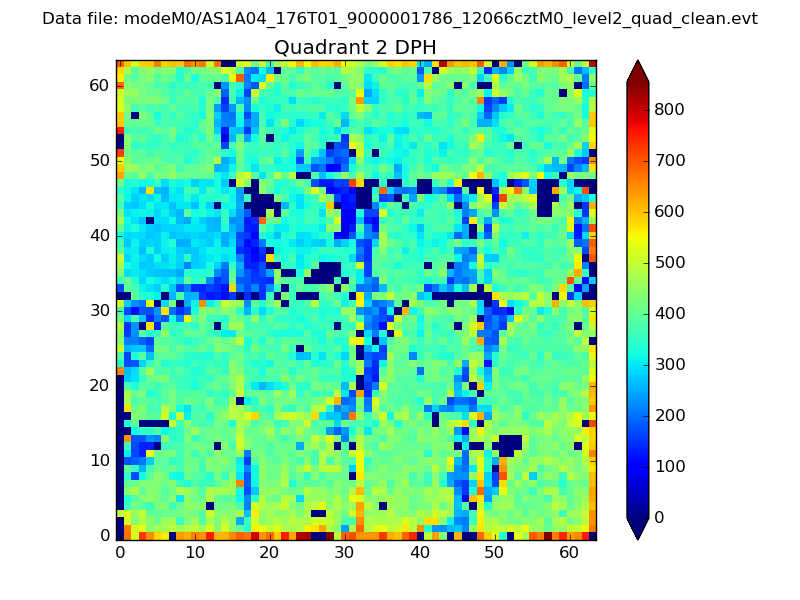
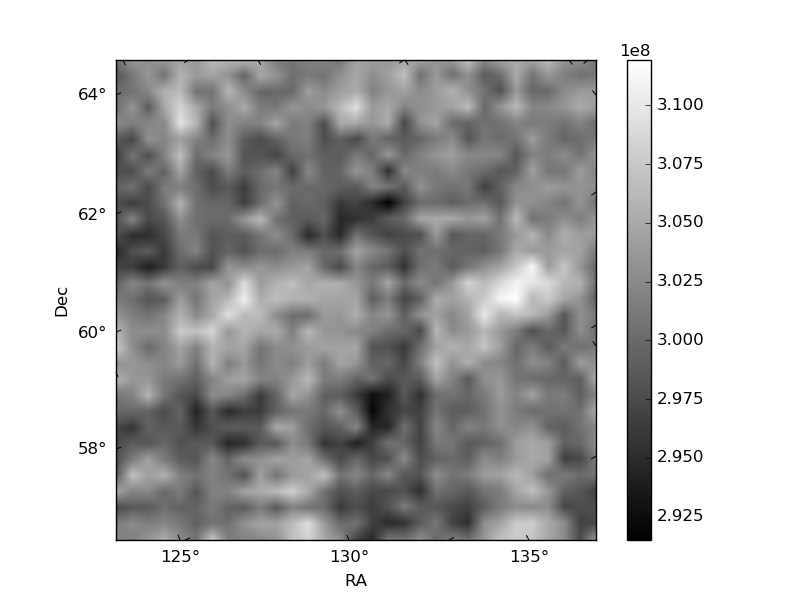
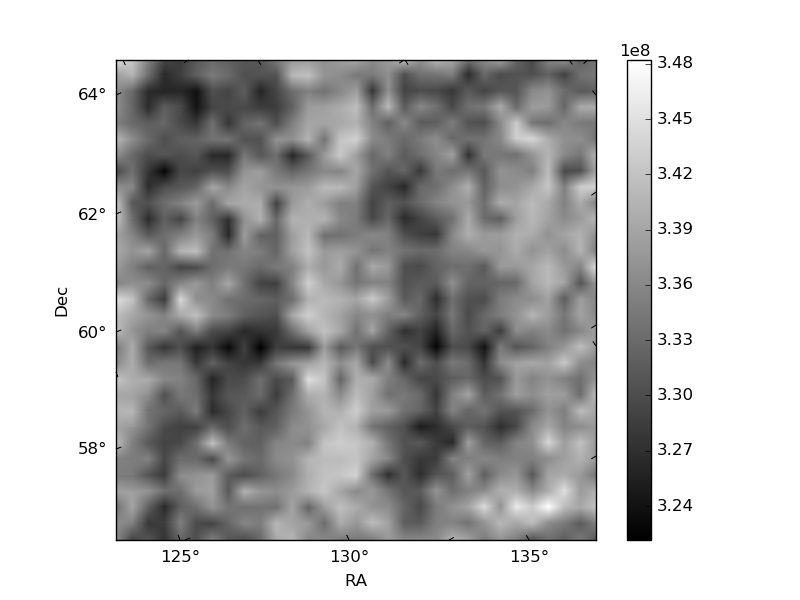
Histogram calculated using DETX and DETY for each event in the final _common_clean file
| Quadrant A | 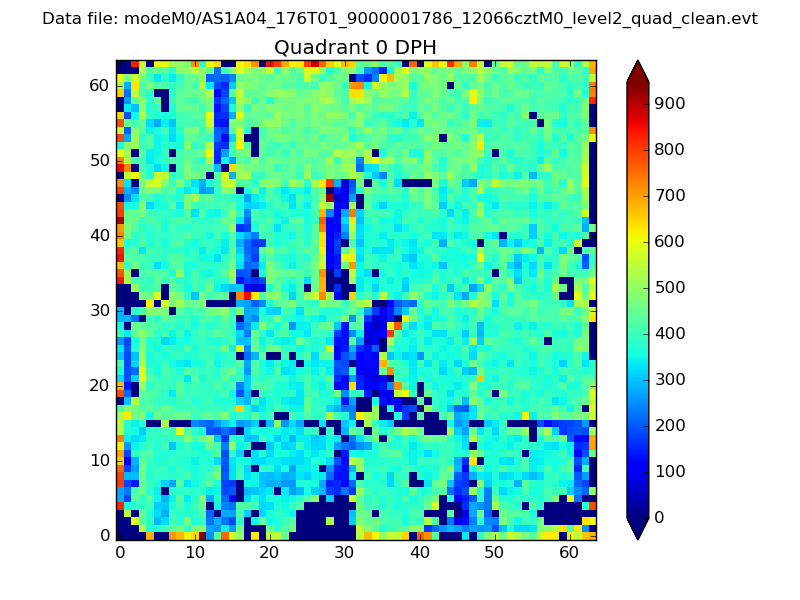 |
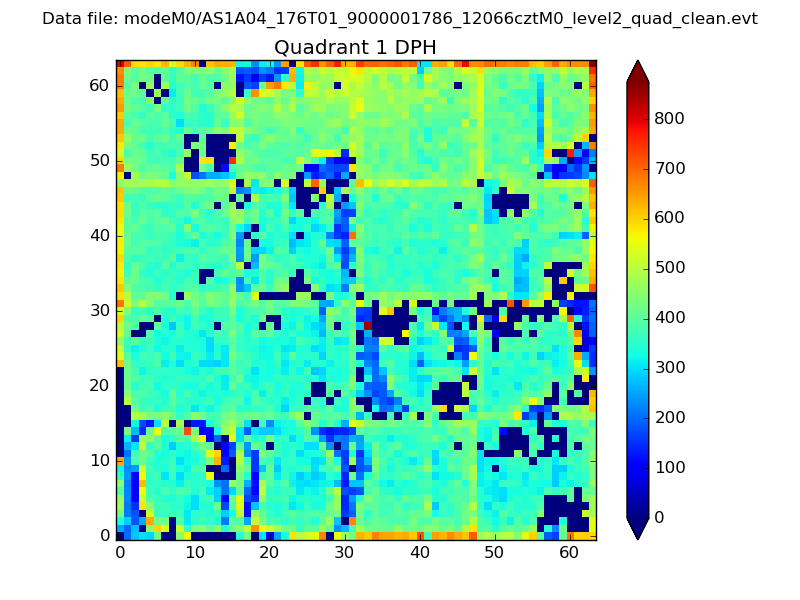 |
Quadrant B |
|---|---|---|---|
| Quadrant D | 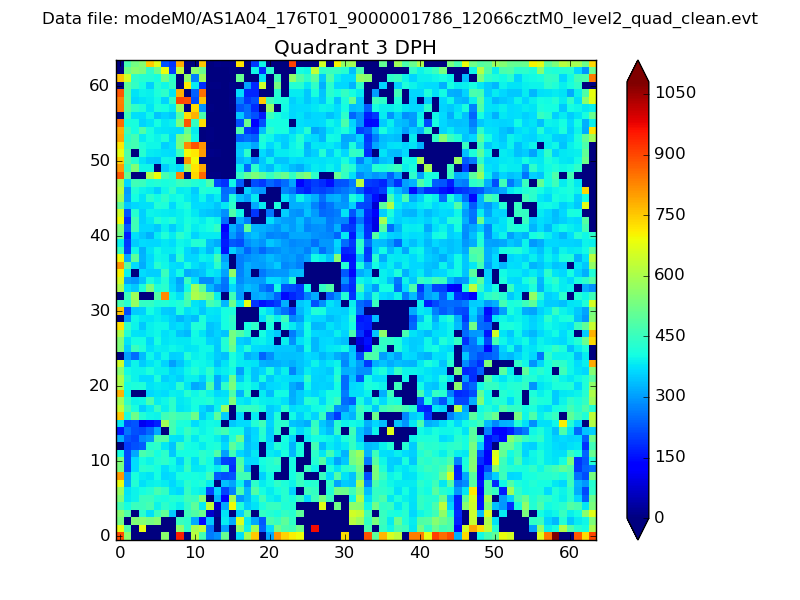 |
 |
Quadrant C |
| Plot type | Count rate plots | Images |
|---|---|---|
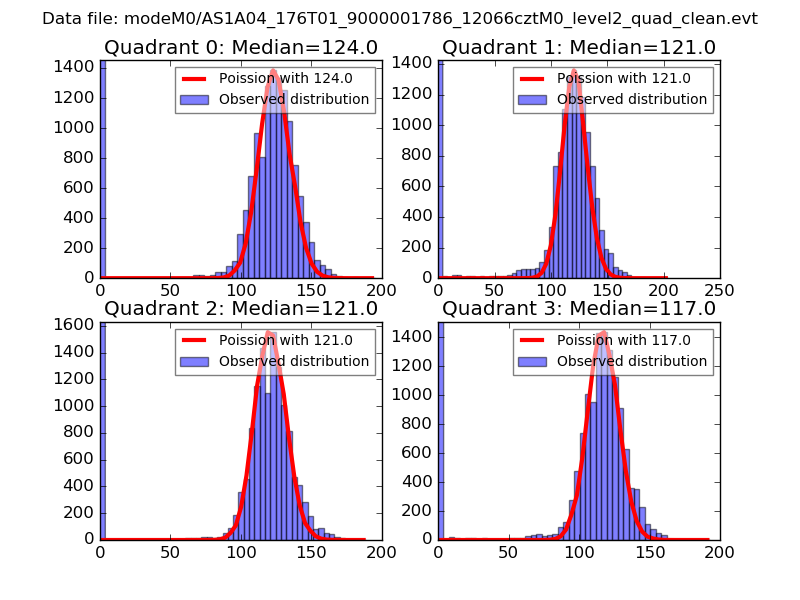
| Comparison with Poisson distribution Blue bars denote a histogram of data divided into 1 sec bins. Red curve is a Poisson curve with rate = median count rate of data. |
 |
 |
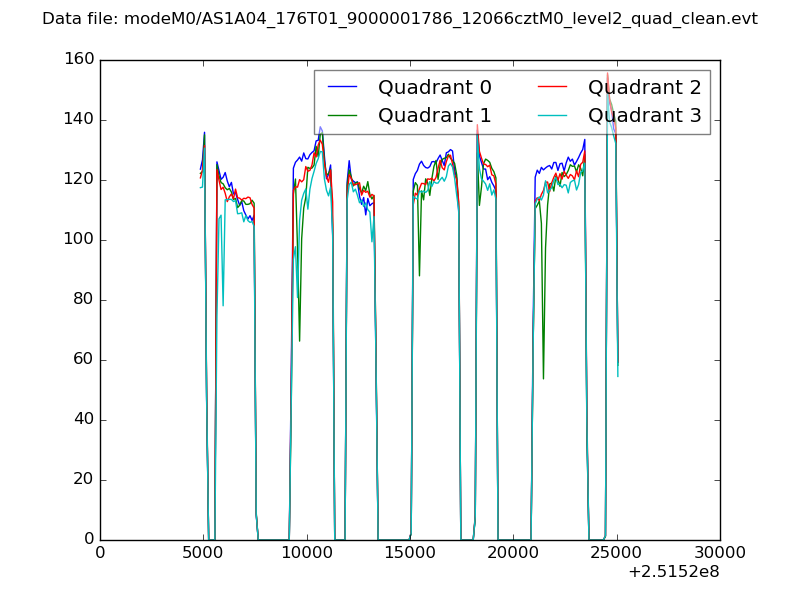
| Quadrant-wise count rates Data is divided into 100 sec bins |
 |
|
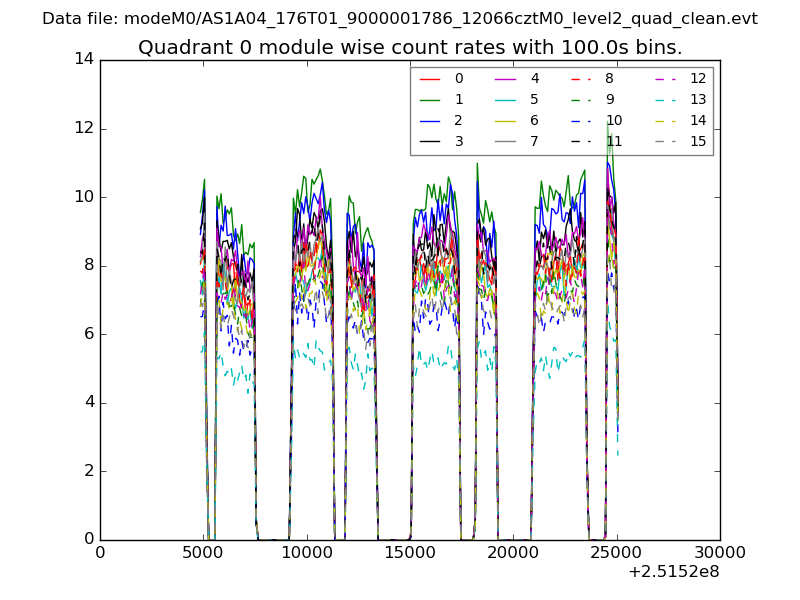
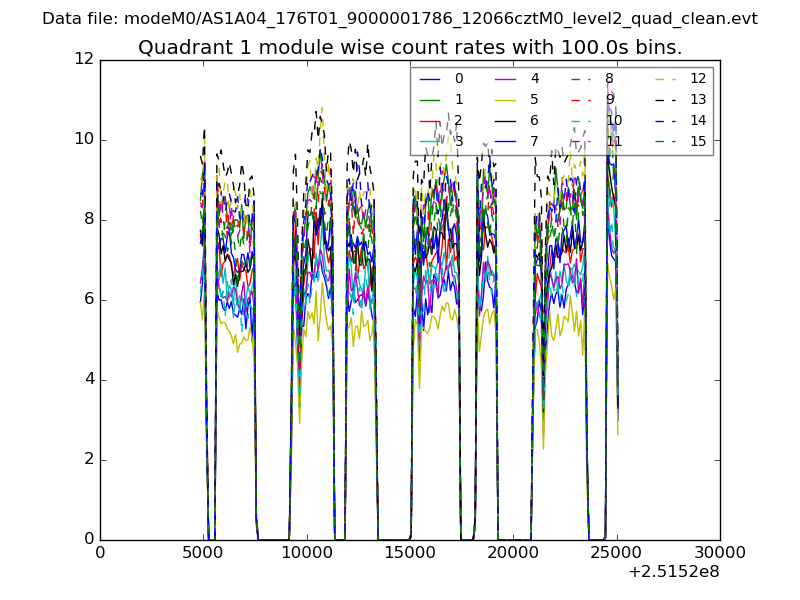
| Module-wise count rates for Quadrant A Data is divided into 100 sec bins |
 |
 |
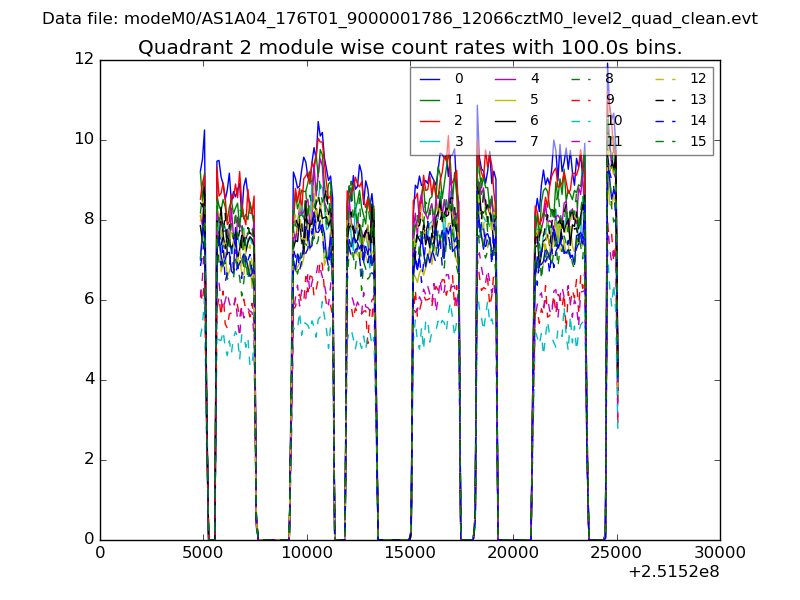
| Module-wise count rates for Quadrant B Data is divided into 100 sec bins |
 |
 |
| Module-wise count rates for Quadrant C Data is divided into 100 sec bins |
 |
 |
| Module-wise count rates for Quadrant D Data is divided into 100 sec bins |
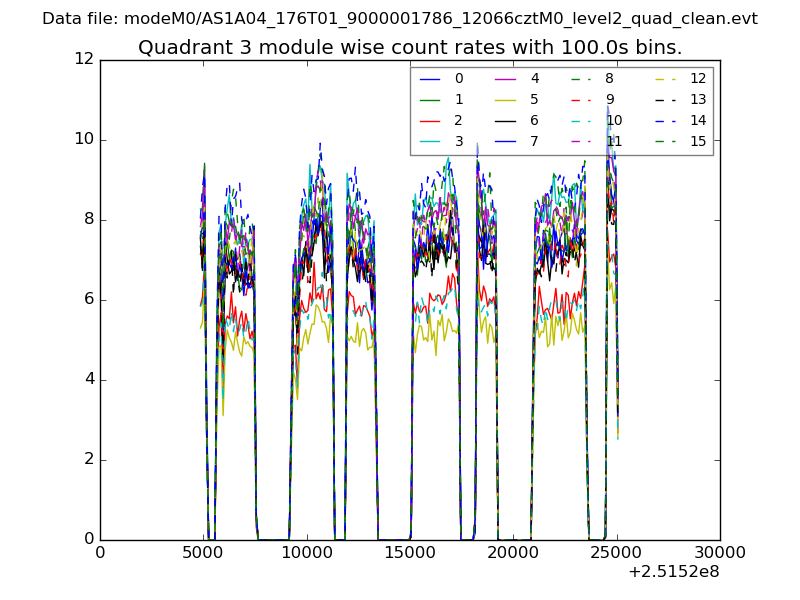 |
 |
| Parameter | Plot |
|---|---|
| CZT HV Monitor | 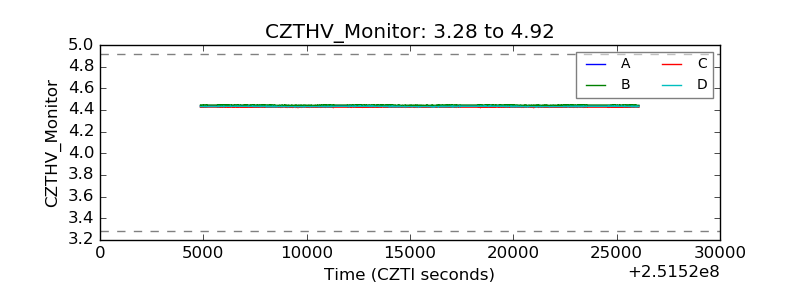 |
| D_VDD | 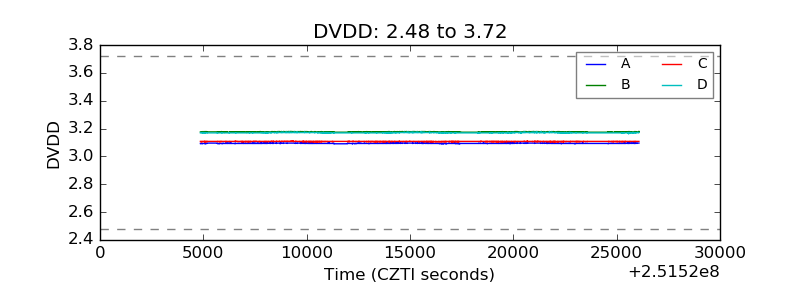 |
| Temperature 1 | 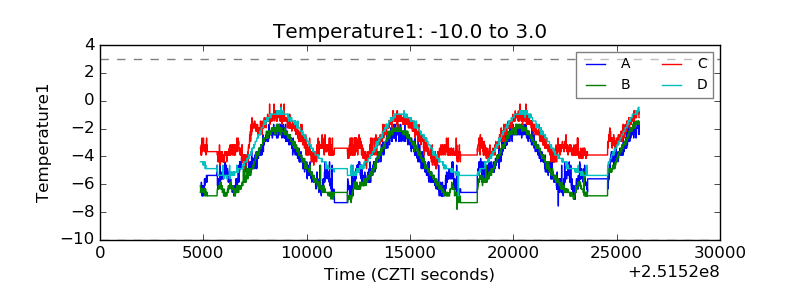 |
| Veto HV Monitor |  |
| Veto LLD | 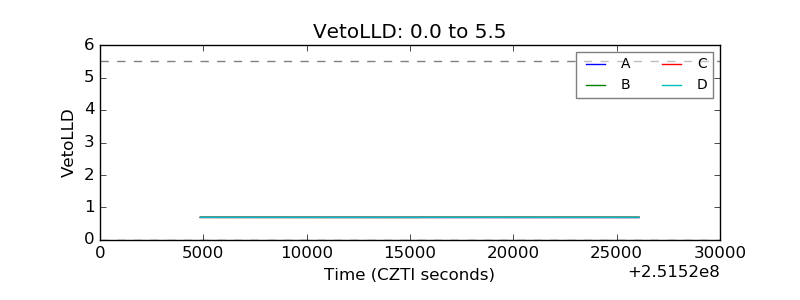 |
| Alpha Counter | 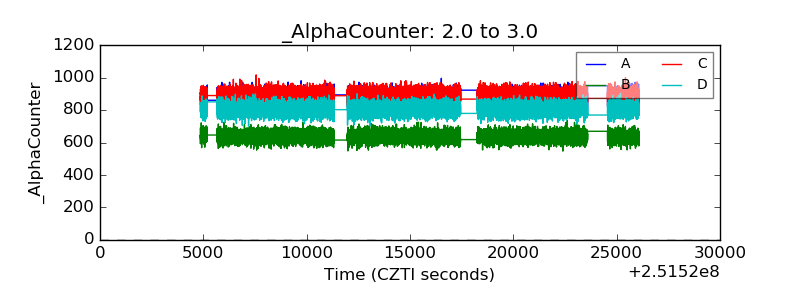 |
| _CPM_Rate | 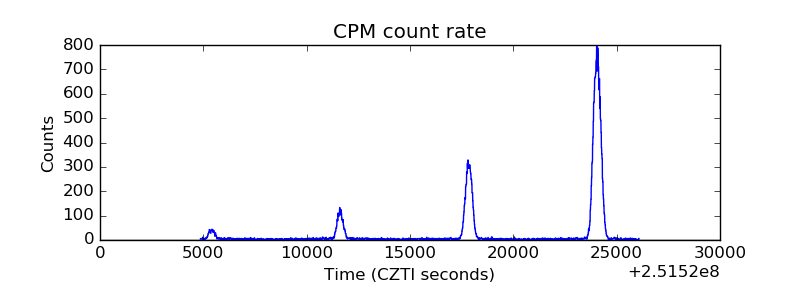 |
| CZT Counter | 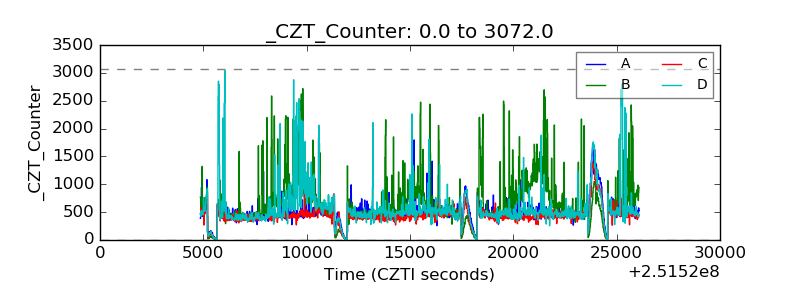 |
| +2.5 Volts monitor | 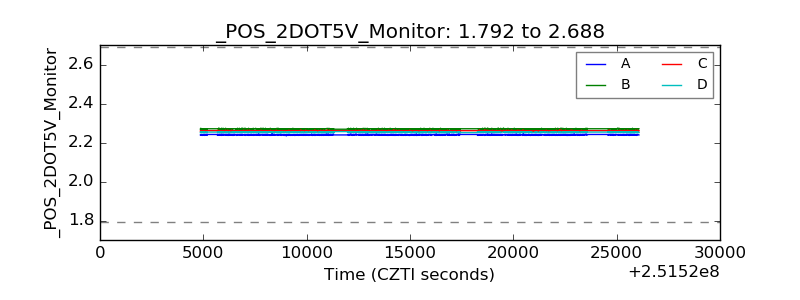 |
| +5 Volts monitor | 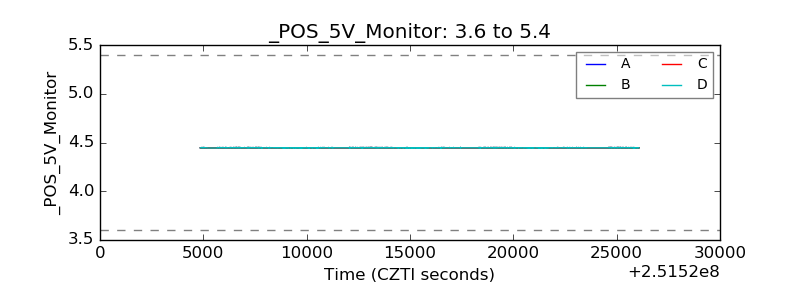 |
| _ROLL_ROT | 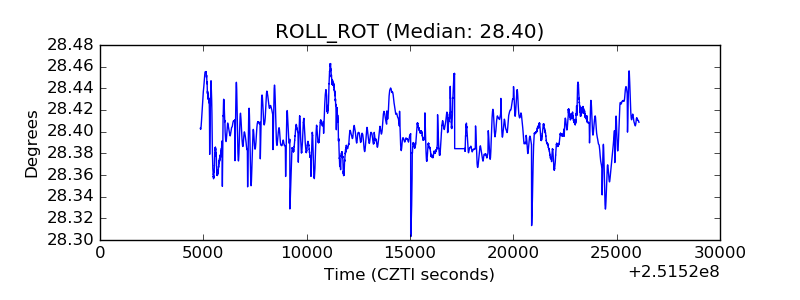 |
| _Roll_DEC | 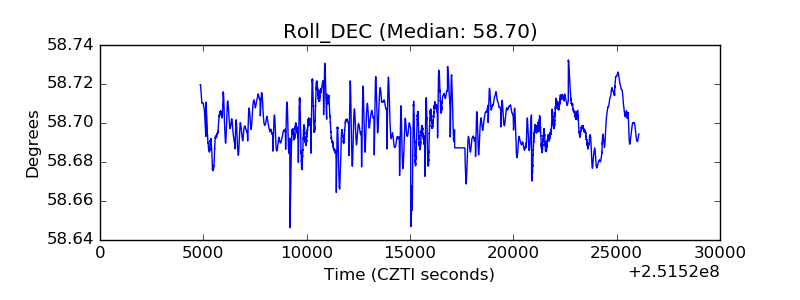 |
| _Roll_RA | 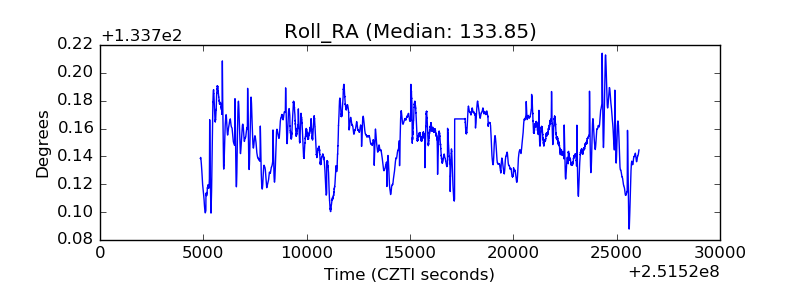 |
| Veto Counter | 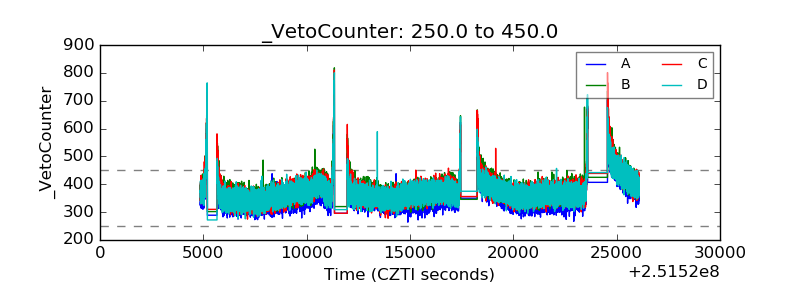 |