| Param | Original file | Final file |
|---|---|---|
| Filename | modeM0/AS1A04_176T01_9000001786_12068cztM0_level2.evt | modeM0/AS1A04_176T01_9000001786_12068cztM0_level2_quad_clean.evt |
| Size (bytes) | 597,147,840 | 75,375,360 |
| Size | 569.5 MB | 71.9 MB |
| Events in quadrant A | 3,660,791 | 471,244 |
| Events in quadrant B | 6,186,253 | 440,051 |
| Events in quadrant C | 3,141,439 | 458,382 |
| Events in quadrant D | 4,639,764 | 442,543 |
| Mode M0 | |||
|---|---|---|---|
| Quadrant | BADHDUFLAG | Total packets | Discarded packets |
| A | 0 | 14999 | 3 |
| B | 0 | 23078 | 2 |
| C | 0 | 13827 | 2 |
| D | 0 | 18225 | 2 |
| Mode SS | |||
|---|---|---|---|
| Quadrant | BADHDUFLAG | Total packets | Discarded packets |
| A | 0 | 136 | 0 |
| B | 0 | 136 | 0 |
| C | 0 | 136 | 0 |
| D | 0 | 136 | 0 |
| Mode M9 | |||
|---|---|---|---|
| Quadrant | BADHDUFLAG | Total packets | Discarded packets |
| A | 0 | 11 | 0 |
| B | 0 | 11 | 0 |
| C | 0 | 11 | 0 |
| D | 0 | 12 | 0 |
| Quadrant | Total seconds | Saturated seconds | Saturation percentage |
|---|---|---|---|
| A | 6745 | 105 | 1.556709% |
| B | 6745 | 600 | 8.895478% |
| C | 6745 | 54 | 0.800593% |
| D | 6745 | 296 | 4.388436% |
Noise dominated data is calculated using 1-second bins in cleaned event files. If a bin has >2000 counts, and if more than 50% of those come from <1% of pixels, then it is considered to be noise-dominated and hence unusable.
| Quadrant | # 1 sec bins | Bins with >0 counts | Bins with >2000 counts | High rate bins dominated by noise | Noise dominated (total time) | Noise dominated (detector-on time) | Marked lightcurve |
|---|---|---|---|---|---|---|---|
| A | 7821 | 6746 | 13 | 13 | 0.17% | 0.19% | 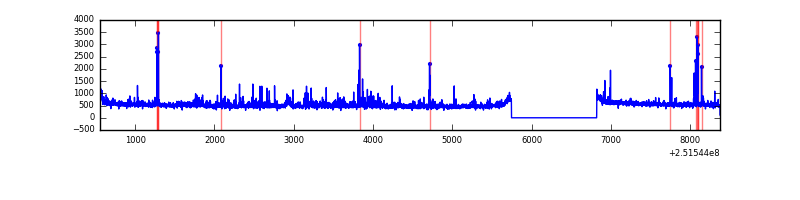 |
| B | 7821 | 6746 | 355 | 355 | 4.54% | 5.26% | 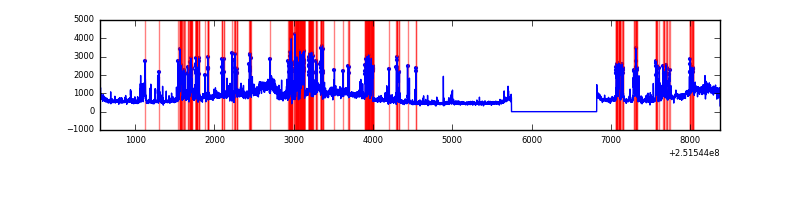 |
| C | 7821 | 6746 | 0 | 0 | 0.00% | 0.00% | 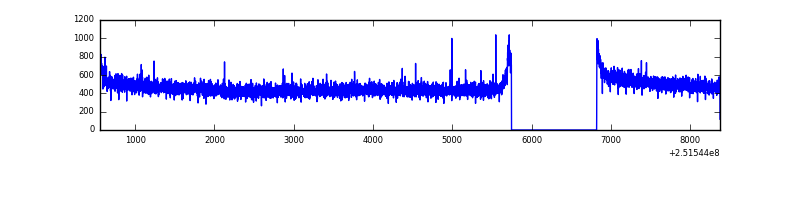 |
| D | 7821 | 6746 | 215 | 215 | 2.75% | 3.19% | 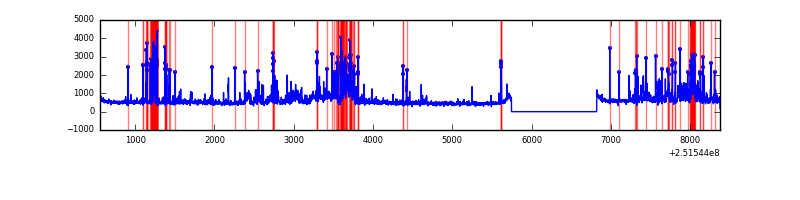 |
Top three noisy pixels from each quadrant. If the there are fewer than three noisy pixels in the level2.evt file, extra rows are filled as -1
| Pixel properties | Quadrant properties | ||||||
|---|---|---|---|---|---|---|---|
| Quadrant | DetID | PixID | Counts | Sigma | Mean | Median | Sigma |
| A | 13 | 251 | 128836 | 764.47 | 839 | 824 | 167.5 |
| A | 1 | 162 | 83088 | 491.27 | 839 | 824 | 167.5 |
| A | 15 | 239 | 70025 | 413.26 | 839 | 824 | 167.5 |
| B | 4 | 239 | 1407070 | 9193.12 | 807 | 790 | 153.0 |
| B | 4 | 206 | 1401285 | 9155.3 | 807 | 790 | 153.0 |
| B | 15 | 204 | 103849 | 673.72 | 807 | 790 | 153.0 |
| C | 0 | 207 | 7058 | 33.53 | 803 | 806 | 186.4 |
| C | 13 | 61 | 5887 | 27.25 | 803 | 806 | 186.4 |
| C | 14 | 234 | 3041 | 11.99 | 803 | 806 | 186.4 |
| D | 1 | 52 | 1253045 | 6530.39 | 793 | 769 | 191.8 |
| D | 8 | 195 | 197024 | 1023.43 | 793 | 769 | 191.8 |
| D | 13 | 104 | 58672 | 301.95 | 793 | 769 | 191.8 |
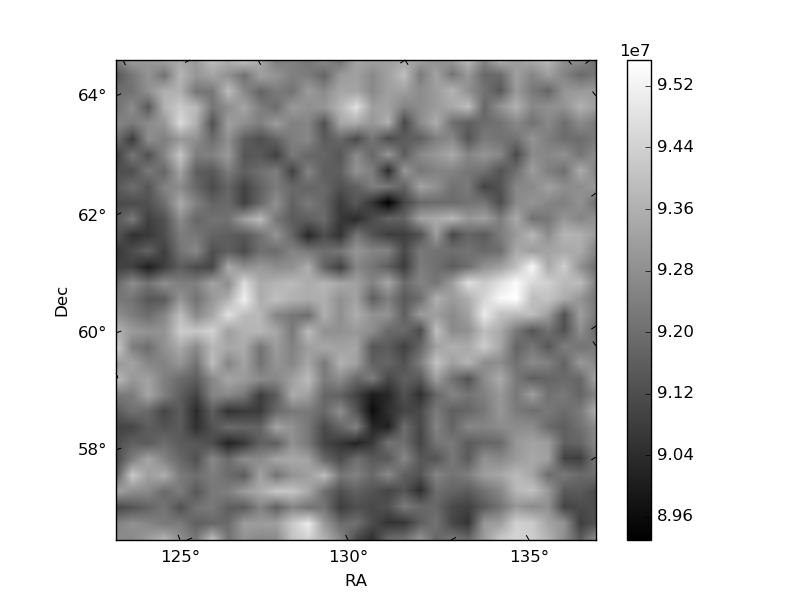
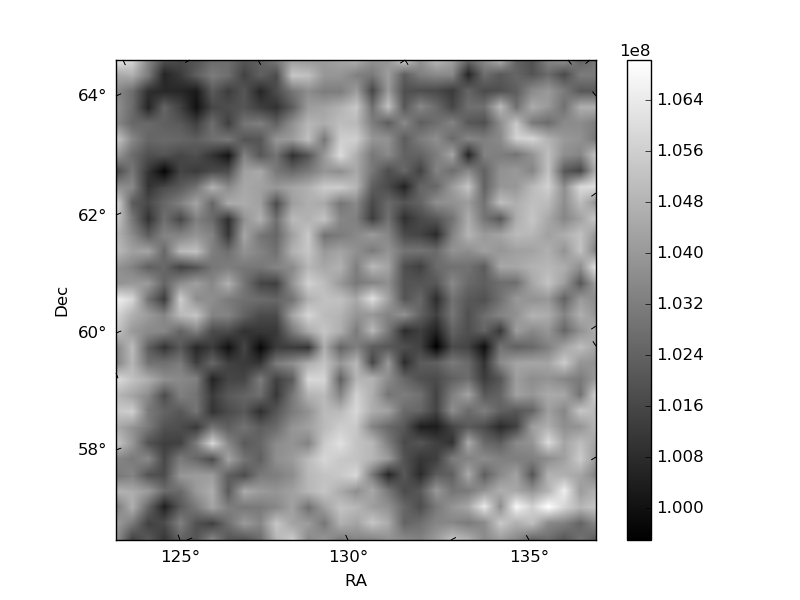
Histogram calculated using DETX and DETY for each event in the final _common_clean file
| Quadrant A | 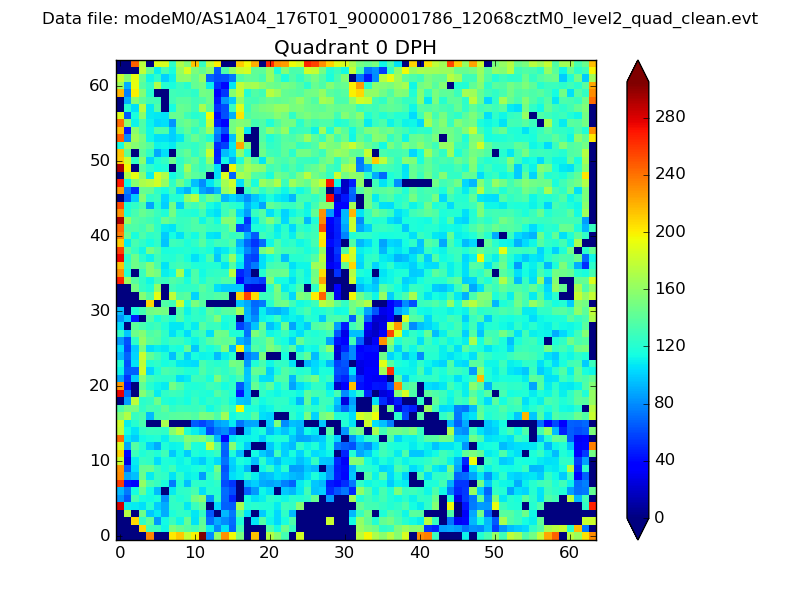 |
 |
Quadrant B |
|---|---|---|---|
| Quadrant D |  |
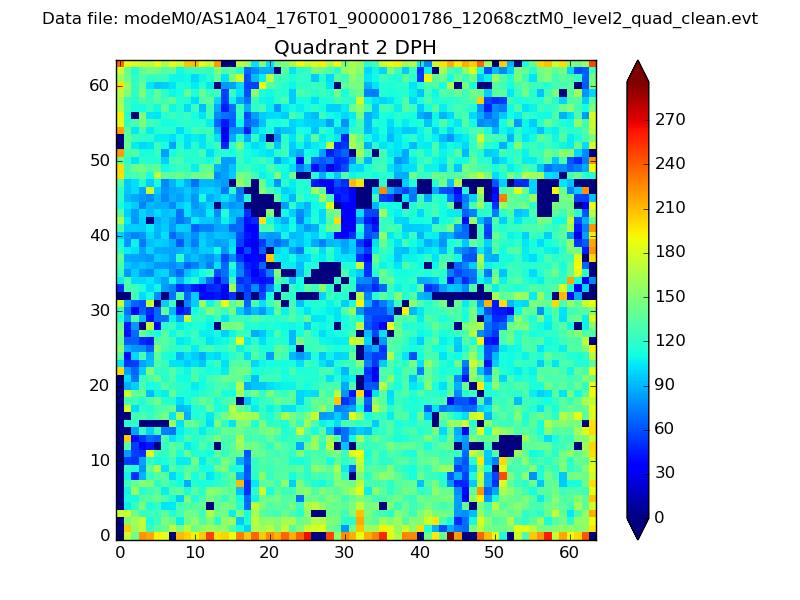 |
Quadrant C |
| Plot type | Count rate plots | Images |
|---|---|---|
| Comparison with Poisson distribution Blue bars denote a histogram of data divided into 1 sec bins. Red curve is a Poisson curve with rate = median count rate of data. |
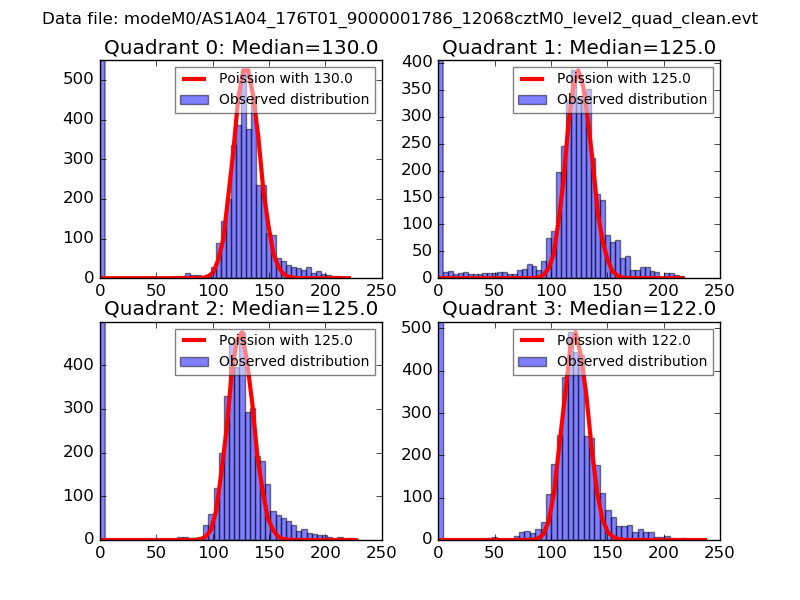 |
 |
| Quadrant-wise count rates Data is divided into 100 sec bins |
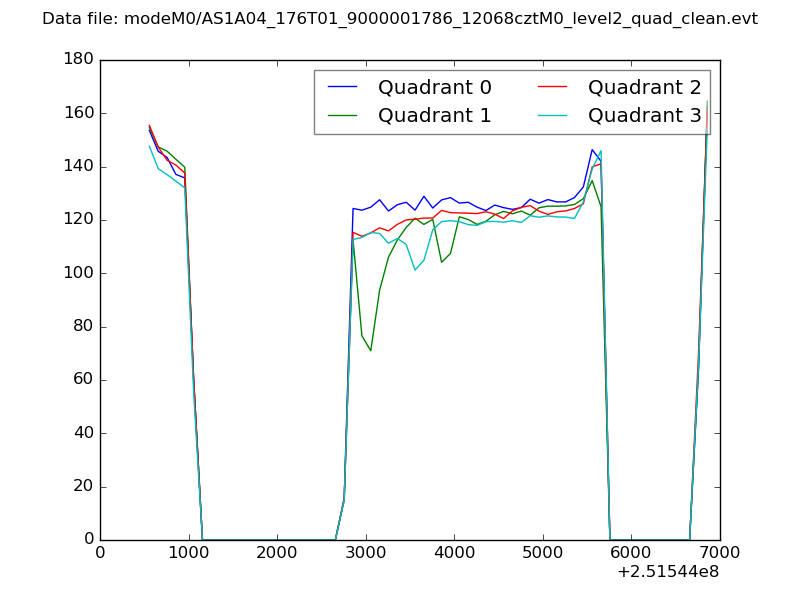 |
|
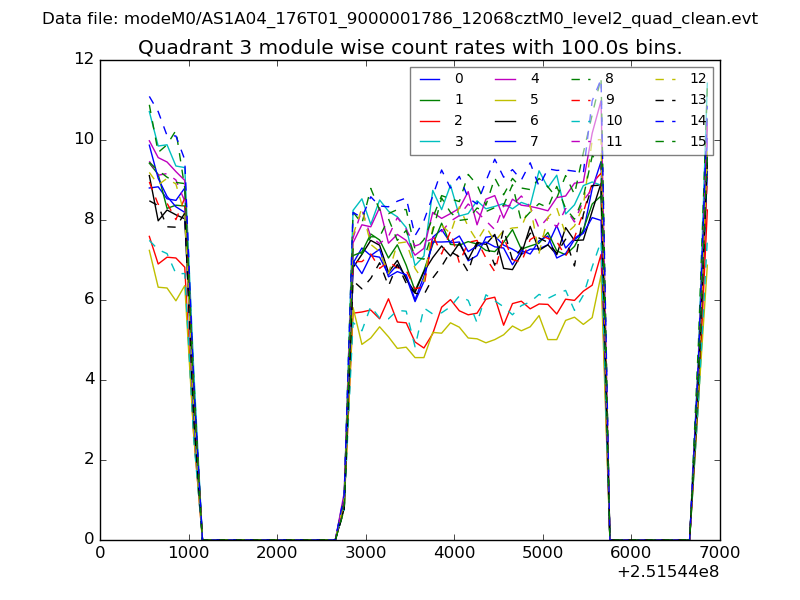
| Module-wise count rates for Quadrant A Data is divided into 100 sec bins |
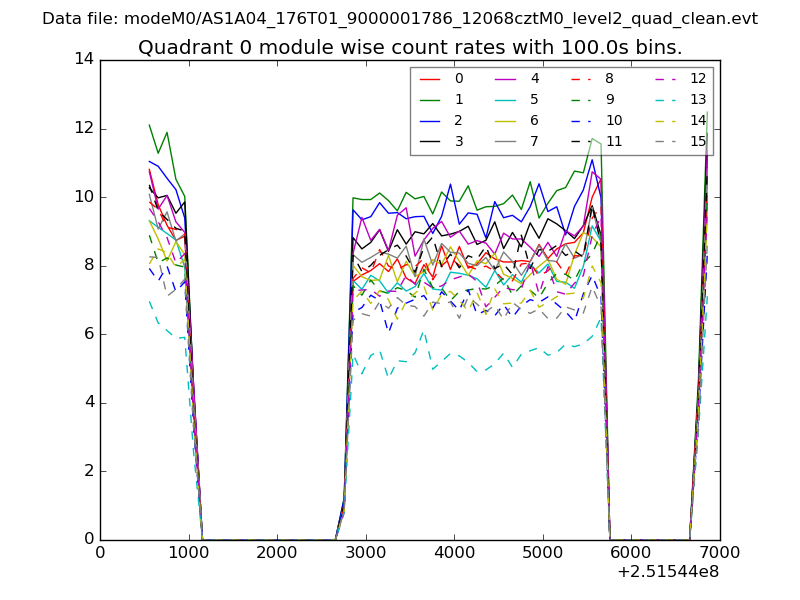 |
 |
| Module-wise count rates for Quadrant B Data is divided into 100 sec bins |
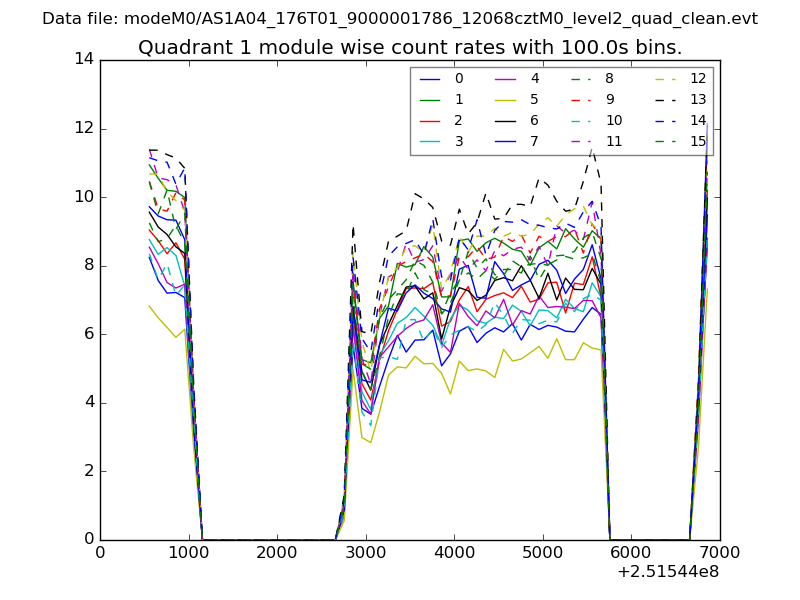 |
 |
| Module-wise count rates for Quadrant C Data is divided into 100 sec bins |
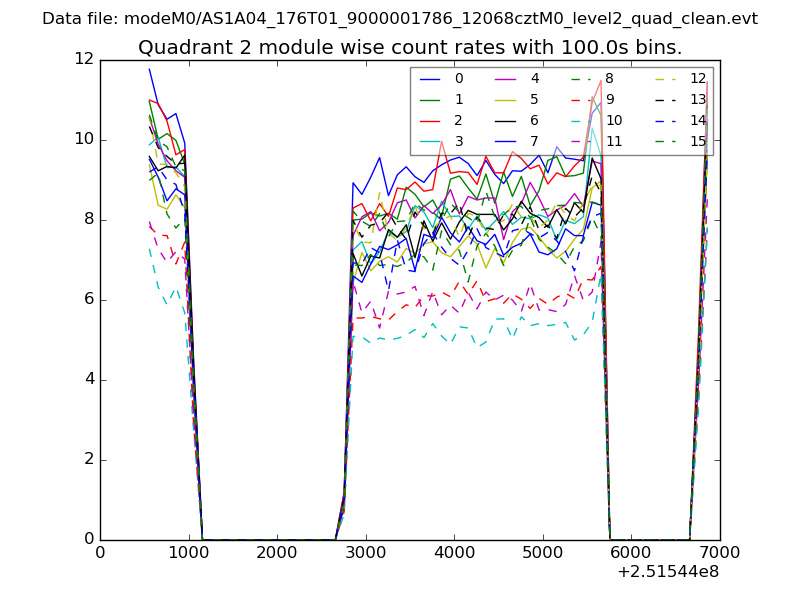 |
 |
| Module-wise count rates for Quadrant D Data is divided into 100 sec bins |
 |
 |
| Parameter | Plot |
|---|---|
| CZT HV Monitor | 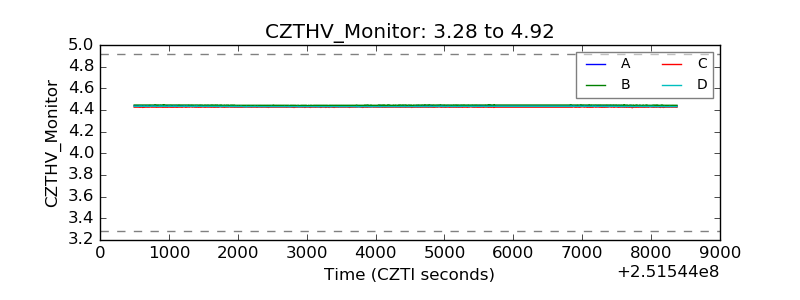 |
| D_VDD | 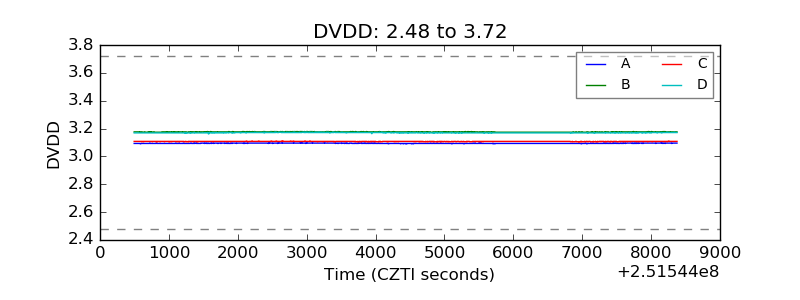 |
| Temperature 1 | 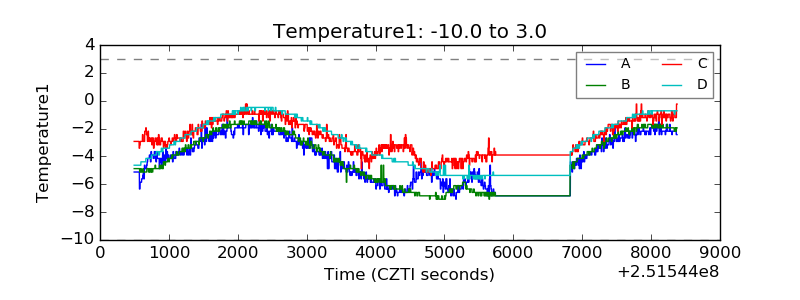 |
| Veto HV Monitor | 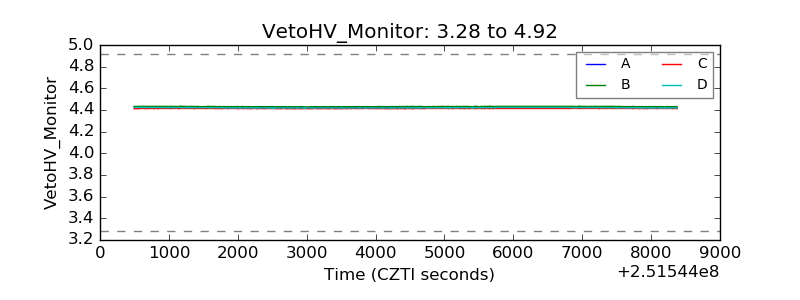 |
| Veto LLD | 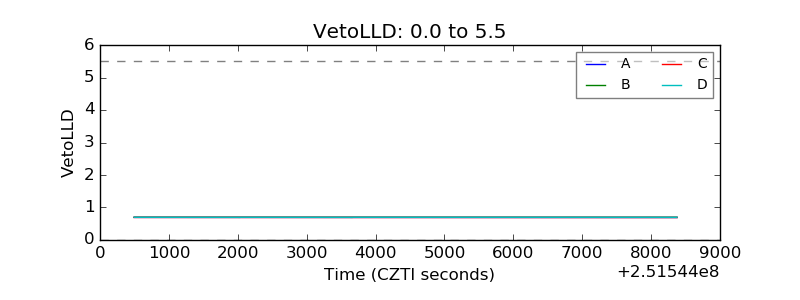 |
| Alpha Counter | 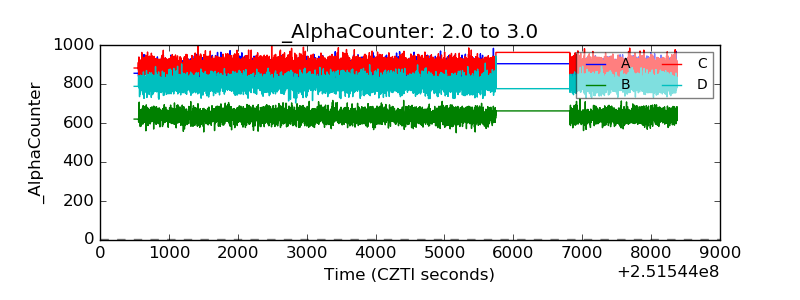 |
| _CPM_Rate | 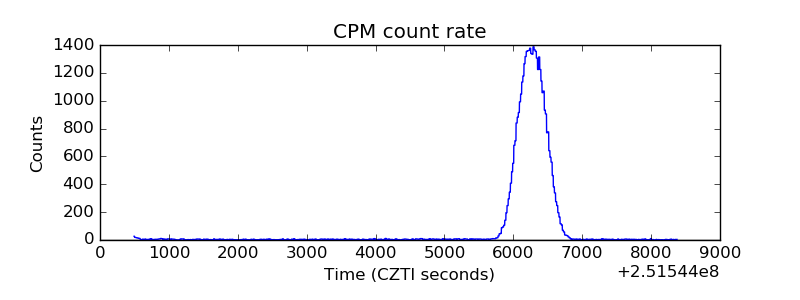 |
| CZT Counter |  |
| +2.5 Volts monitor |  |
| +5 Volts monitor |  |
| _ROLL_ROT | 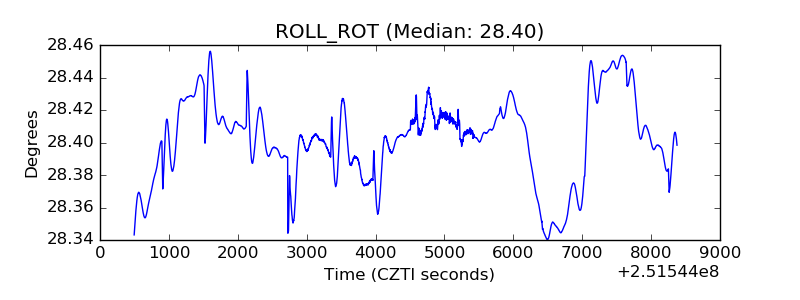 |
| _Roll_DEC | 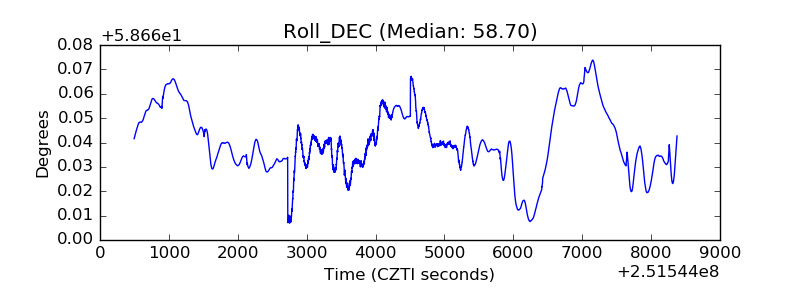 |
| _Roll_RA | 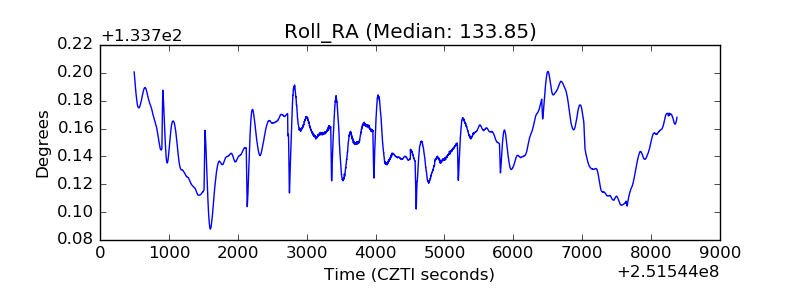 |
| Veto Counter | 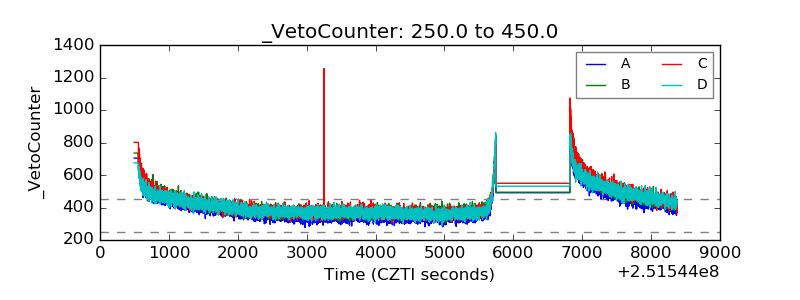 |