| Param | Original file | Final file |
|---|---|---|
| Filename | modeM0/AS1A04_176T01_9000001786_12069cztM0_level2.evt | modeM0/AS1A04_176T01_9000001786_12069cztM0_level2_quad_clean.evt |
| Size (bytes) | 937,042,560 | 130,014,720 |
| Size | 893.6 MB | 124.0 MB |
| Events in quadrant A | 5,908,631 | 825,034 |
| Events in quadrant B | 9,206,652 | 777,338 |
| Events in quadrant C | 5,196,965 | 795,206 |
| Events in quadrant D | 7,317,554 | 772,323 |
| Mode M0 | |||
|---|---|---|---|
| Quadrant | BADHDUFLAG | Total packets | Discarded packets |
| A | 0 | 24572 | 3 |
| B | 0 | 34959 | 2 |
| C | 0 | 22947 | 2 |
| D | 0 | 29143 | 2 |
| Mode SS | |||
|---|---|---|---|
| Quadrant | BADHDUFLAG | Total packets | Discarded packets |
| A | 0 | 226 | 0 |
| B | 0 | 226 | 0 |
| C | 0 | 226 | 0 |
| D | 0 | 226 | 0 |
| Mode M9 | |||
|---|---|---|---|
| Quadrant | BADHDUFLAG | Total packets | Discarded packets |
| A | 0 | 23 | 0 |
| B | 0 | 23 | 0 |
| C | 0 | 23 | 0 |
| D | 0 | 23 | 0 |
| Quadrant | Total seconds | Saturated seconds | Saturation percentage |
|---|---|---|---|
| A | 11084 | 184 | 1.660051% |
| B | 11084 | 801 | 7.226633% |
| C | 11084 | 104 | 0.938289% |
| D | 11084 | 363 | 3.274991% |
Noise dominated data is calculated using 1-second bins in cleaned event files. If a bin has >2000 counts, and if more than 50% of those come from <1% of pixels, then it is considered to be noise-dominated and hence unusable.
| Quadrant | # 1 sec bins | Bins with >0 counts | Bins with >2000 counts | High rate bins dominated by noise | Noise dominated (total time) | Noise dominated (detector-on time) | Marked lightcurve |
|---|---|---|---|---|---|---|---|
| A | 13360 | 11085 | 14 | 14 | 0.10% | 0.13% | 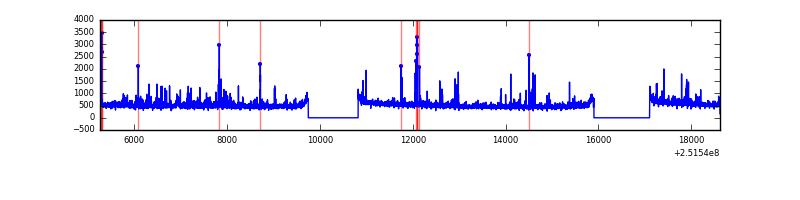 |
| B | 13360 | 11085 | 447 | 447 | 3.35% | 4.03% | 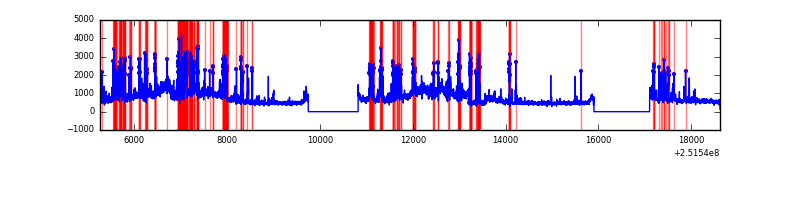 |
| C | 13360 | 11085 | 0 | 0 | 0.00% | 0.00% | 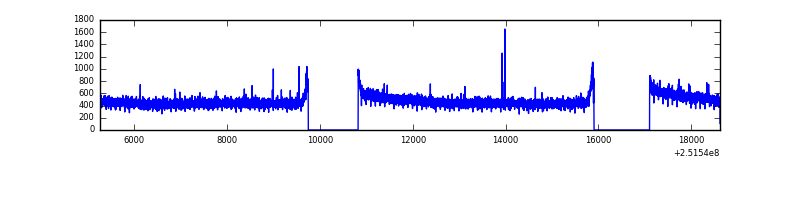 |
| D | 13360 | 11085 | 233 | 233 | 1.74% | 2.10% | 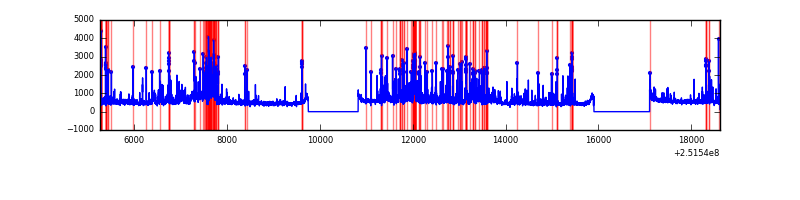 |
Top three noisy pixels from each quadrant. If the there are fewer than three noisy pixels in the level2.evt file, extra rows are filled as -1
| Pixel properties | Quadrant properties | ||||||
|---|---|---|---|---|---|---|---|
| Quadrant | DetID | PixID | Counts | Sigma | Mean | Median | Sigma |
| A | 13 | 251 | 175333 | 635.51 | 1375 | 1350 | 273.8 |
| A | 1 | 162 | 127105 | 459.35 | 1375 | 1350 | 273.8 |
| A | 15 | 239 | 104552 | 376.97 | 1375 | 1350 | 273.8 |
| B | 4 | 206 | 1890114 | 7576.44 | 1335 | 1304 | 249.3 |
| B | 4 | 239 | 1774997 | 7114.68 | 1335 | 1304 | 249.3 |
| B | 15 | 204 | 168232 | 669.59 | 1335 | 1304 | 249.3 |
| C | 0 | 207 | 15583 | 46.8 | 1327 | 1332 | 304.5 |
| C | 14 | 234 | 10541 | 30.24 | 1327 | 1332 | 304.5 |
| C | 13 | 61 | 9749 | 27.64 | 1327 | 1332 | 304.5 |
| D | 1 | 52 | 1690264 | 5346.35 | 1318 | 1278 | 315.9 |
| D | 8 | 195 | 242349 | 763.09 | 1318 | 1278 | 315.9 |
| D | 10 | 199 | 109859 | 343.7 | 1318 | 1278 | 315.9 |
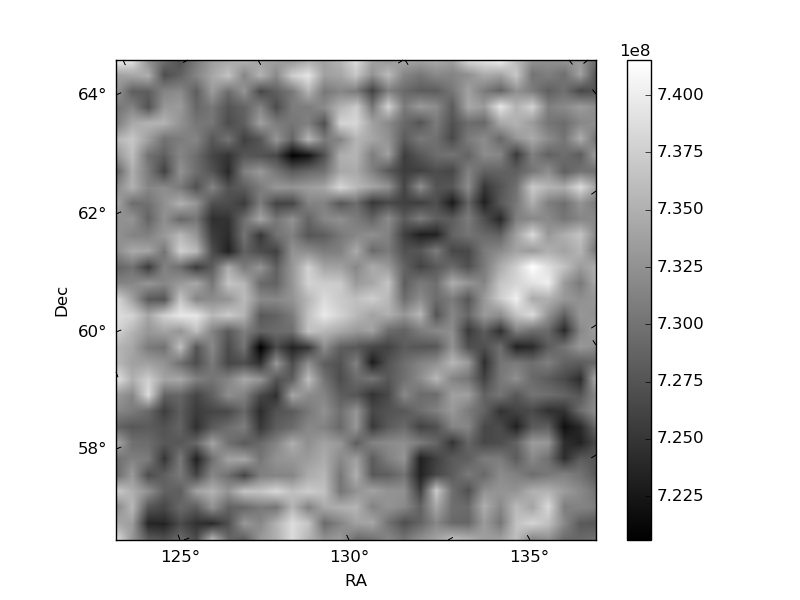
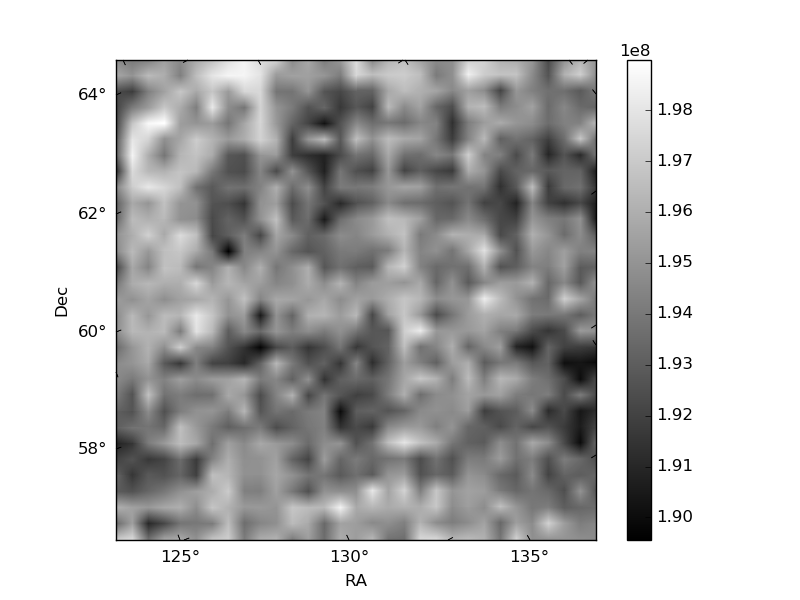
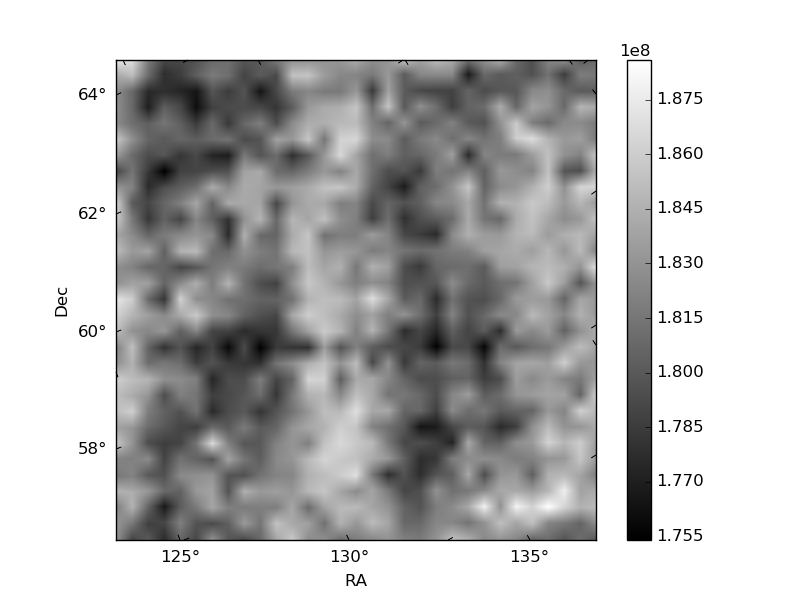
Histogram calculated using DETX and DETY for each event in the final _common_clean file
| Quadrant A |  |
 |
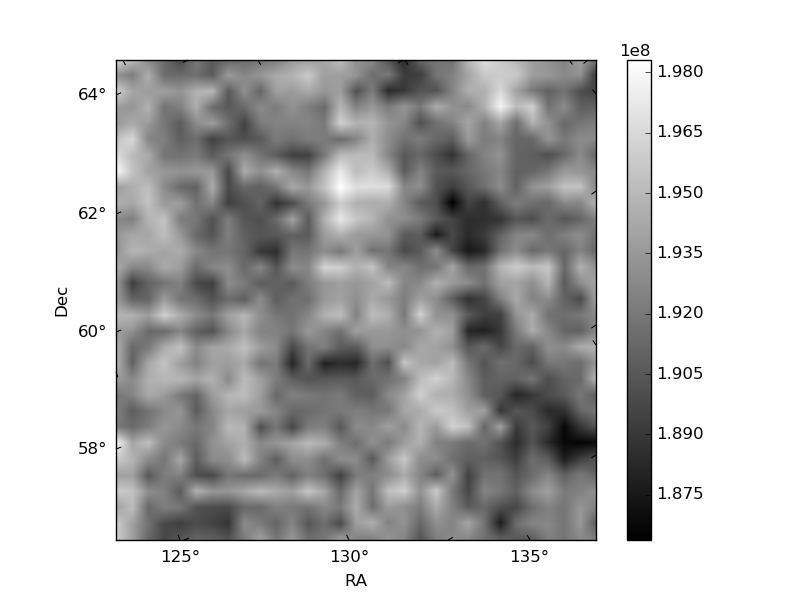
Quadrant B |
|---|---|---|---|
| Quadrant D |  |
 |
Quadrant C |
| Plot type | Count rate plots | Images |
|---|---|---|
| Comparison with Poisson distribution Blue bars denote a histogram of data divided into 1 sec bins. Red curve is a Poisson curve with rate = median count rate of data. |
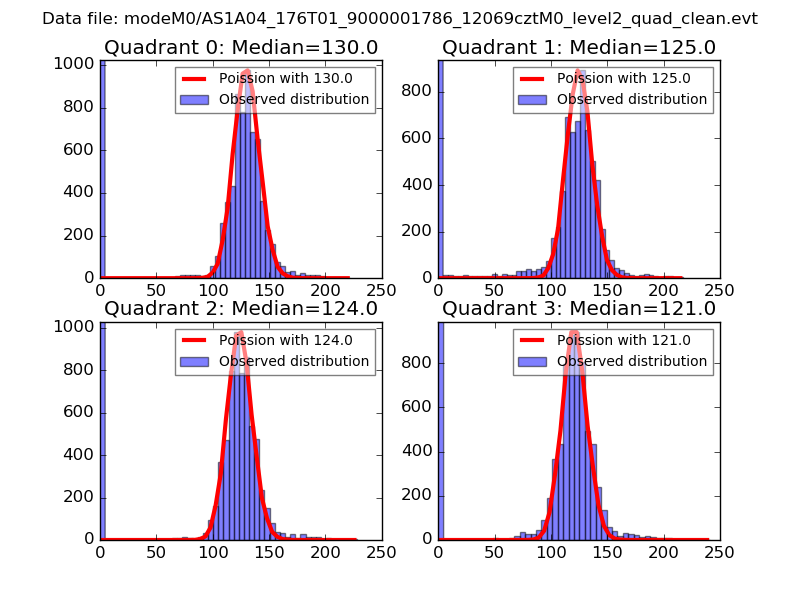 |
 |
| Quadrant-wise count rates Data is divided into 100 sec bins |
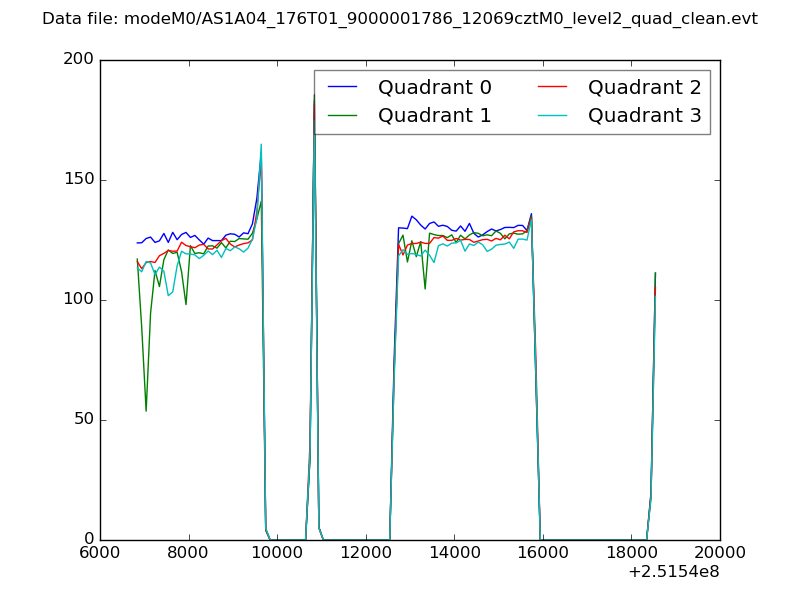 |
|
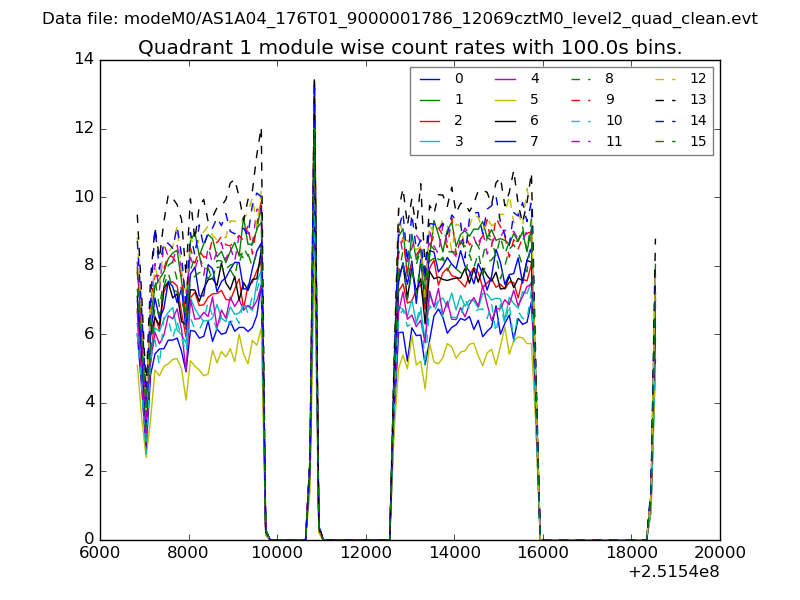
| Module-wise count rates for Quadrant A Data is divided into 100 sec bins |
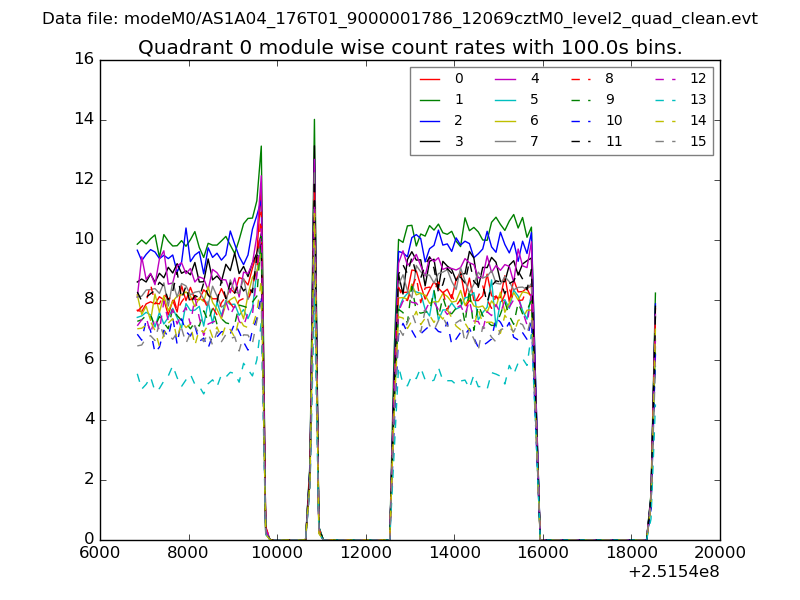 |
 |
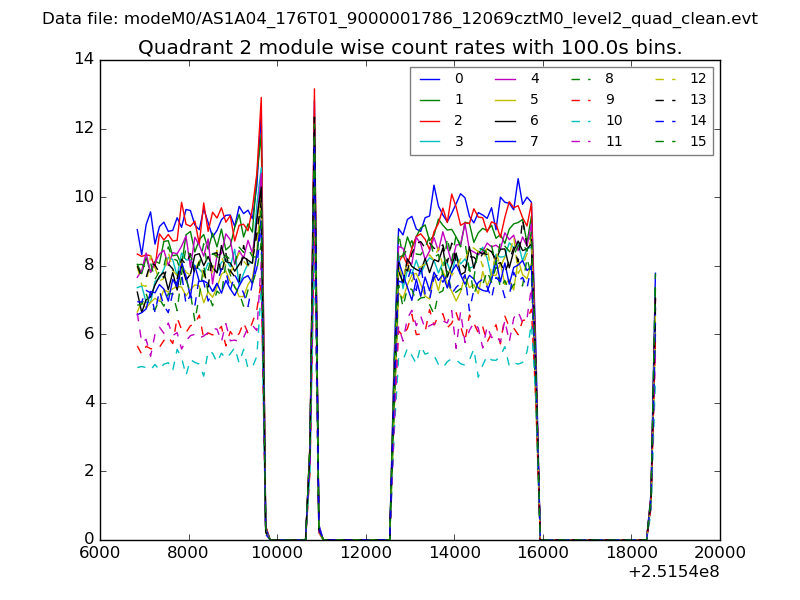
| Module-wise count rates for Quadrant B Data is divided into 100 sec bins |
 |
 |
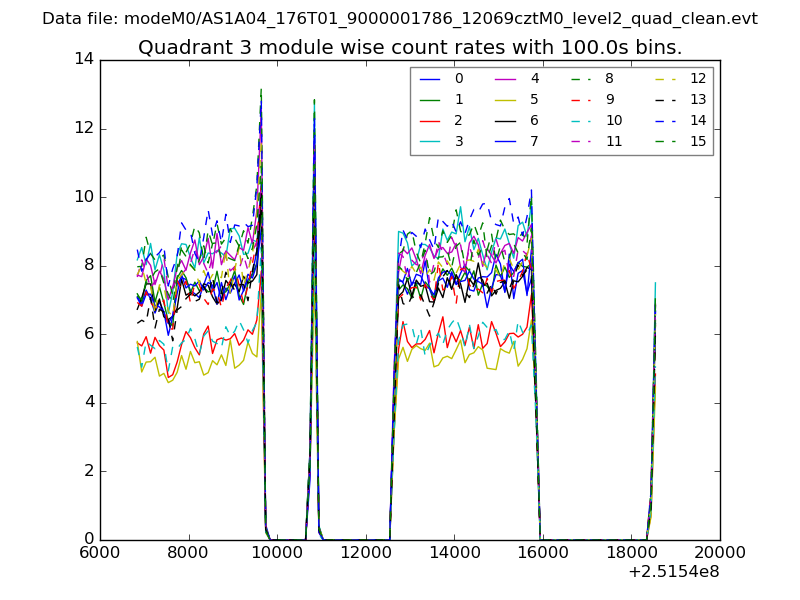
| Module-wise count rates for Quadrant C Data is divided into 100 sec bins |
 |
 |
| Module-wise count rates for Quadrant D Data is divided into 100 sec bins |
 |
 |
| Parameter | Plot |
|---|---|
| CZT HV Monitor | 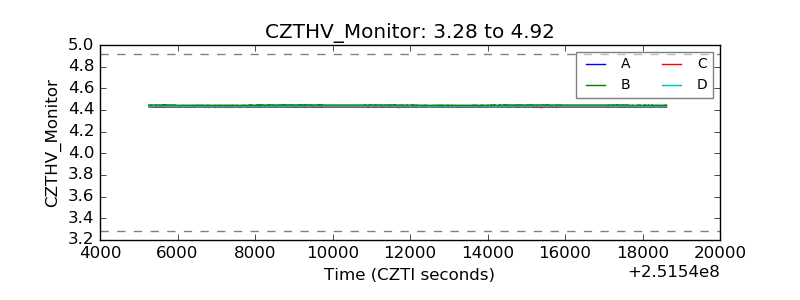 |
| D_VDD | 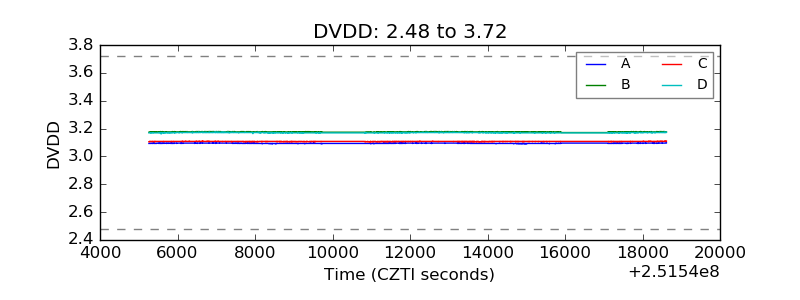 |
| Temperature 1 | 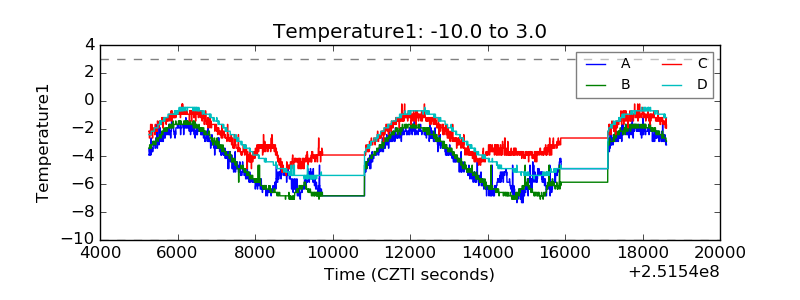 |
| Veto HV Monitor | 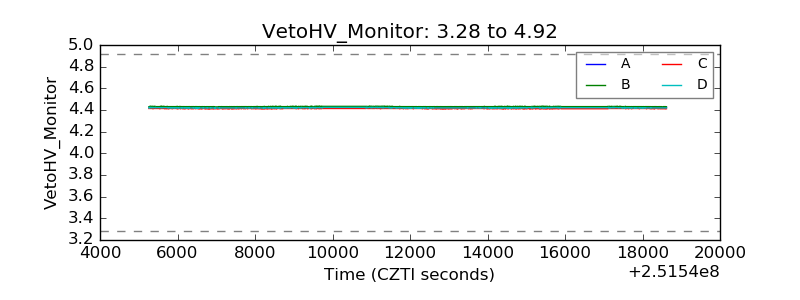 |
| Veto LLD | 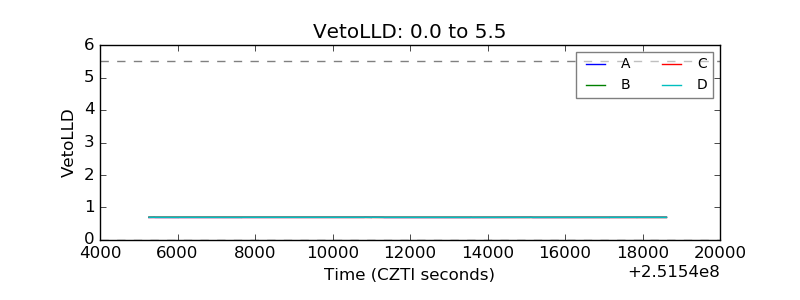 |
| Alpha Counter | 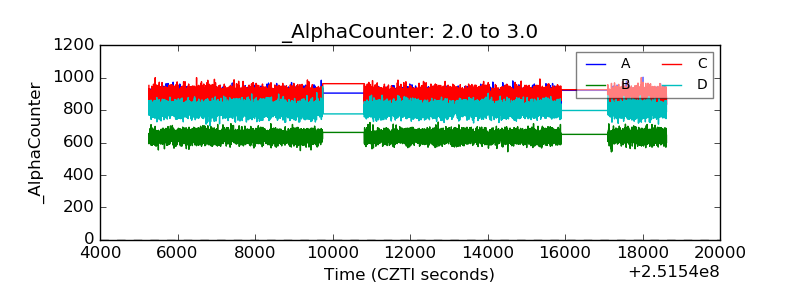 |
| _CPM_Rate | 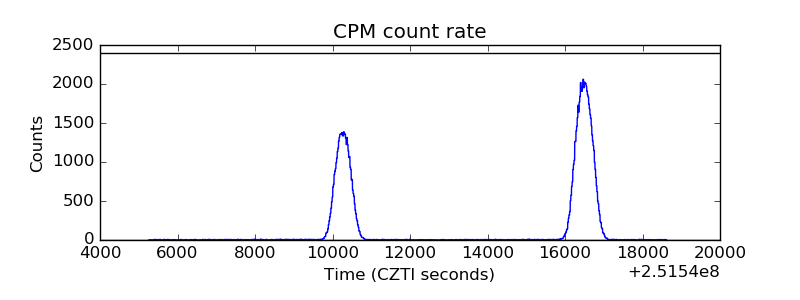 |
| CZT Counter | 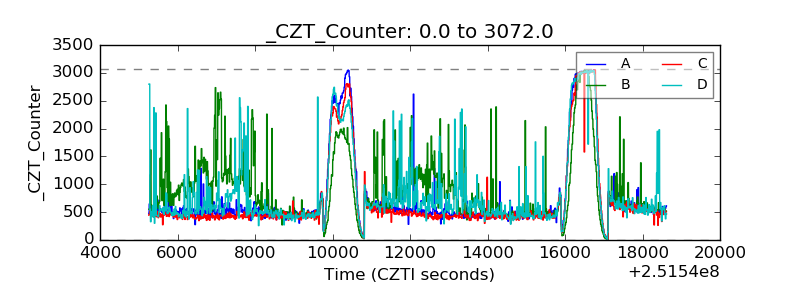 |
| +2.5 Volts monitor |  |
| +5 Volts monitor |  |
| _ROLL_ROT | 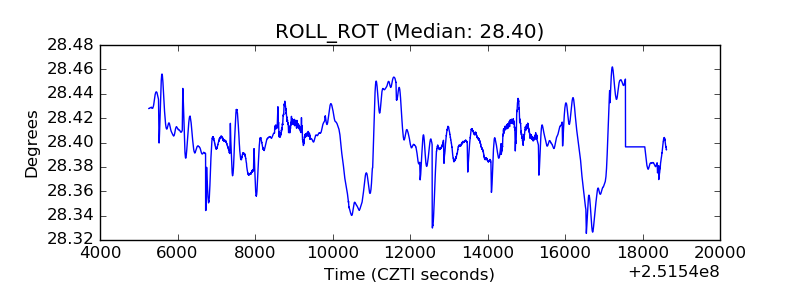 |
| _Roll_DEC | 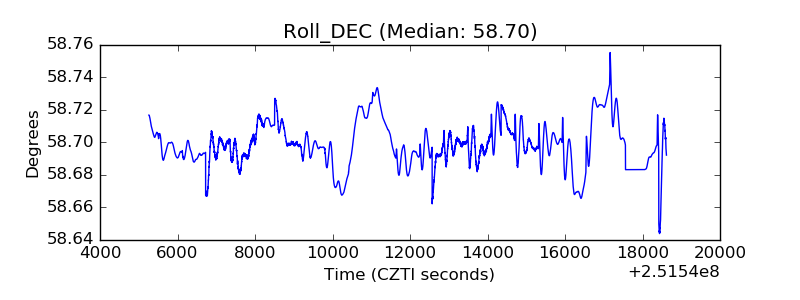 |
| _Roll_RA | 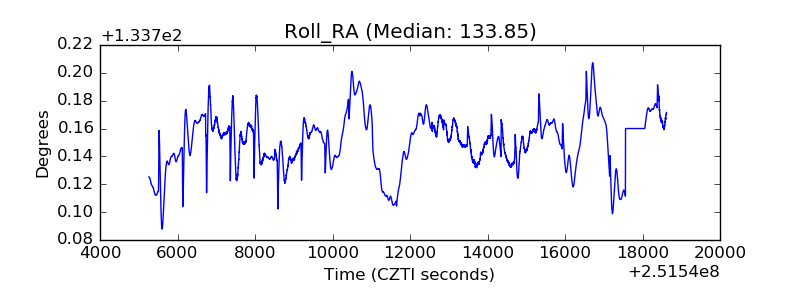 |
| Veto Counter | 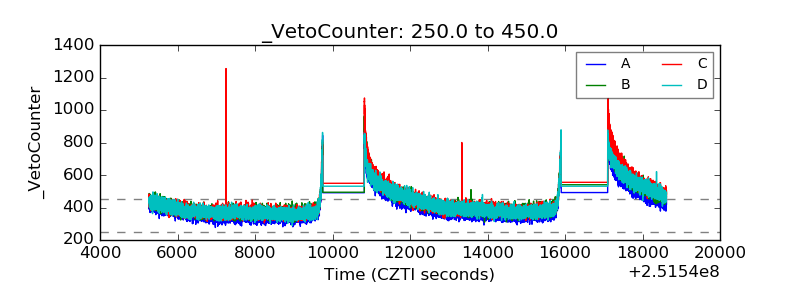 |