| Param | Original file | Final file |
|---|---|---|
| Filename | modeM0/AS1A04_176T01_9000001786_12070cztM0_level2.evt | modeM0/AS1A04_176T01_9000001786_12070cztM0_level2_quad_clean.evt |
| Size (bytes) | 200,327,040 | 28,843,200 |
| Size | 191.0 MB | 27.5 MB |
| Events in quadrant A | 1,377,873 | 179,717 |
| Events in quadrant B | 1,809,427 | 173,714 |
| Events in quadrant C | 1,248,259 | 171,923 |
| Events in quadrant D | 1,459,911 | 168,349 |
| Mode M0 | |||
|---|---|---|---|
| Quadrant | BADHDUFLAG | Total packets | Discarded packets |
| A | 0 | 5654 | 0 |
| B | 0 | 7074 | 0 |
| C | 0 | 5201 | 0 |
| D | 0 | 5837 | 0 |
| Mode SS | |||
|---|---|---|---|
| Quadrant | BADHDUFLAG | Total packets | Discarded packets |
| A | 0 | 50 | 0 |
| B | 0 | 50 | 0 |
| C | 0 | 50 | 0 |
| D | 0 | 50 | 0 |
| Quadrant | Total seconds | Saturated seconds | Saturation percentage |
|---|---|---|---|
| A | 2494 | 11 | 0.441059% |
| B | 2494 | 60 | 2.405774% |
| C | 2494 | 1 | 0.040096% |
| D | 2494 | 27 | 1.082598% |
Noise dominated data is calculated using 1-second bins in cleaned event files. If a bin has >2000 counts, and if more than 50% of those come from <1% of pixels, then it is considered to be noise-dominated and hence unusable.
| Quadrant | # 1 sec bins | Bins with >0 counts | Bins with >2000 counts | High rate bins dominated by noise | Noise dominated (total time) | Noise dominated (detector-on time) | Marked lightcurve |
|---|---|---|---|---|---|---|---|
| A | 2495 | 2495 | 0 | 0 | 0.00% | 0.00% | 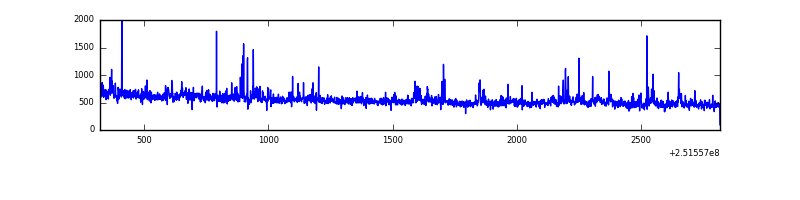 |
| B | 2495 | 2495 | 36 | 36 | 1.44% | 1.44% | 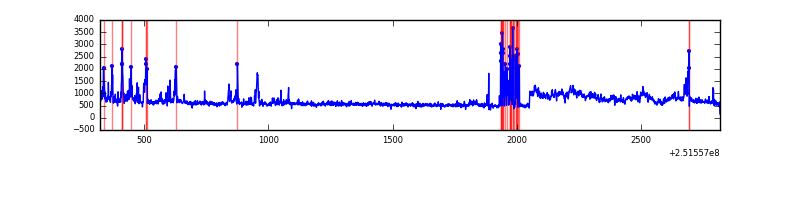 |
| C | 2495 | 2495 | 0 | 0 | 0.00% | 0.00% |  |
| D | 2495 | 2495 | 19 | 19 | 0.76% | 0.76% | 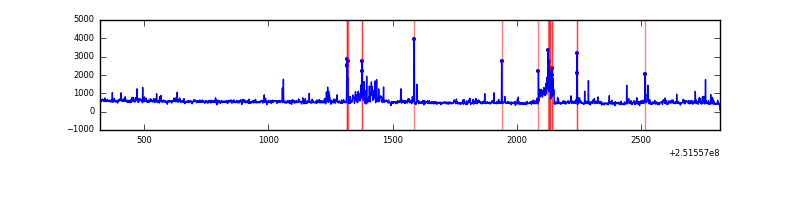 |
Top three noisy pixels from each quadrant. If the there are fewer than three noisy pixels in the level2.evt file, extra rows are filled as -1
| Pixel properties | Quadrant properties | ||||||
|---|---|---|---|---|---|---|---|
| Quadrant | DetID | PixID | Counts | Sigma | Mean | Median | Sigma |
| A | 13 | 251 | 42970 | 630.07 | 328 | 322 | 67.7 |
| A | 1 | 162 | 20601 | 299.6 | 328 | 322 | 67.7 |
| A | 14 | 63 | 14739 | 212.99 | 328 | 322 | 67.7 |
| B | 4 | 206 | 261682 | 4275.98 | 320 | 313 | 61.1 |
| B | 4 | 239 | 229913 | 3756.24 | 320 | 313 | 61.1 |
| B | 15 | 204 | 54042 | 879.0 | 320 | 313 | 61.1 |
| C | 0 | 207 | 10220 | 134.47 | 317 | 320 | 73.6 |
| C | 13 | 61 | 2350 | 27.57 | 317 | 320 | 73.6 |
| C | 14 | 234 | 1305 | 13.38 | 317 | 320 | 73.6 |
| D | 1 | 52 | 106589 | 1401.06 | 317 | 309 | 75.9 |
| D | 10 | 199 | 73693 | 967.4 | 317 | 309 | 75.9 |
| D | 8 | 195 | 31241 | 407.77 | 317 | 309 | 75.9 |
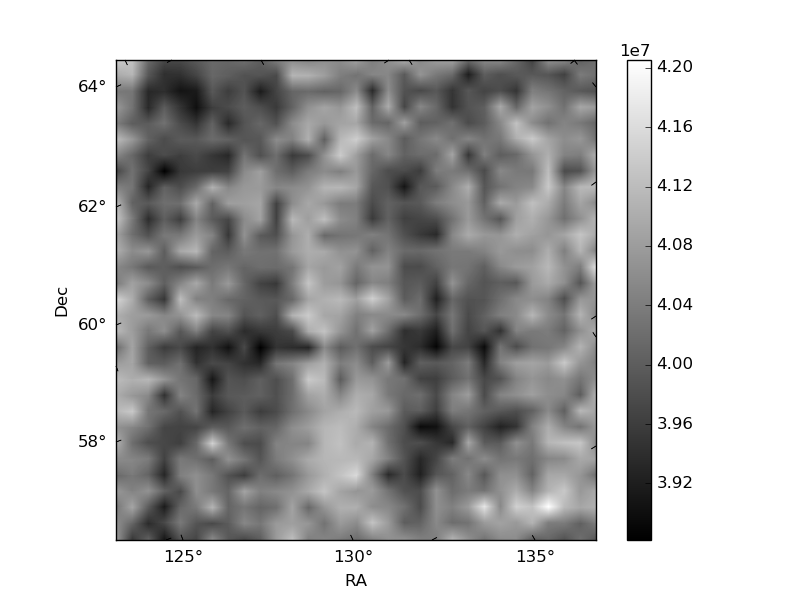
Histogram calculated using DETX and DETY for each event in the final _common_clean file
| Quadrant A | 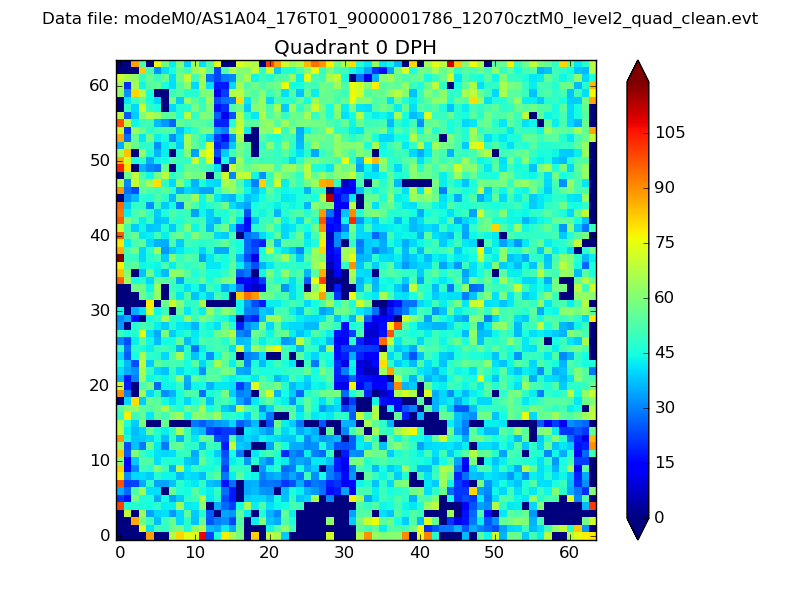 |
 |
Quadrant B |
|---|---|---|---|
| Quadrant D |  |
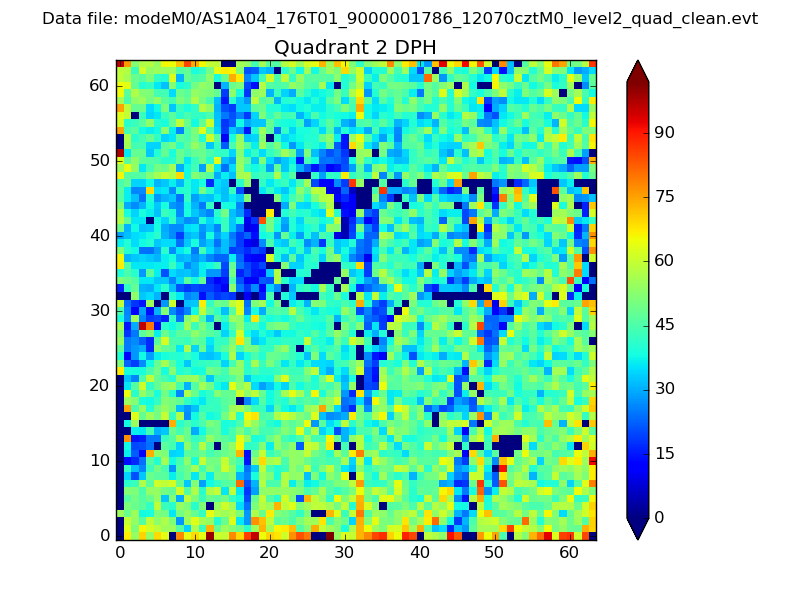 |
Quadrant C |
| Plot type | Count rate plots | Images |
|---|---|---|
| Comparison with Poisson distribution Blue bars denote a histogram of data divided into 1 sec bins. Red curve is a Poisson curve with rate = median count rate of data. |
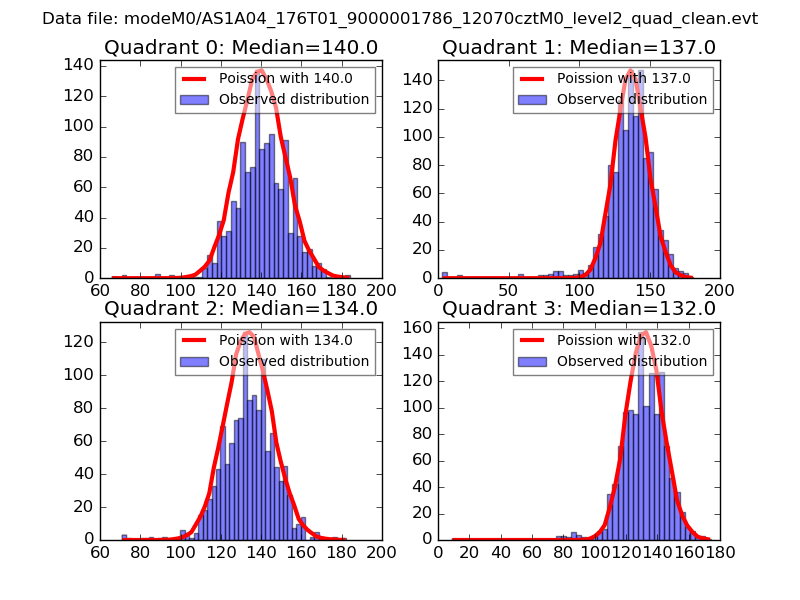 |
 |
| Quadrant-wise count rates Data is divided into 100 sec bins |
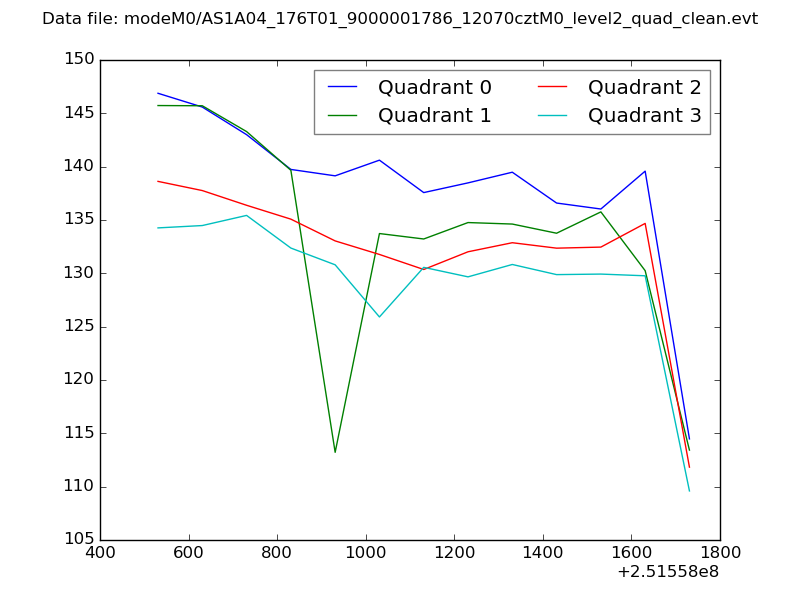 |
|
| Module-wise count rates for Quadrant A Data is divided into 100 sec bins |
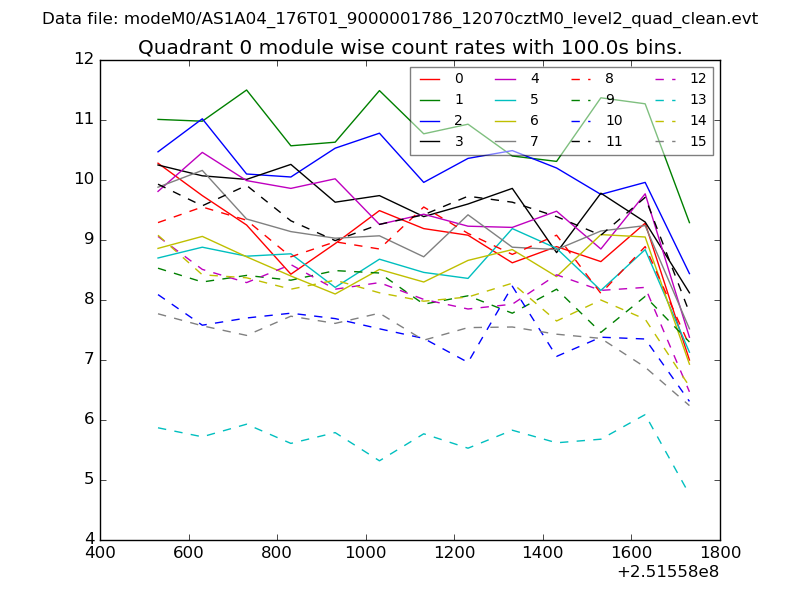 |
 |
| Module-wise count rates for Quadrant B Data is divided into 100 sec bins |
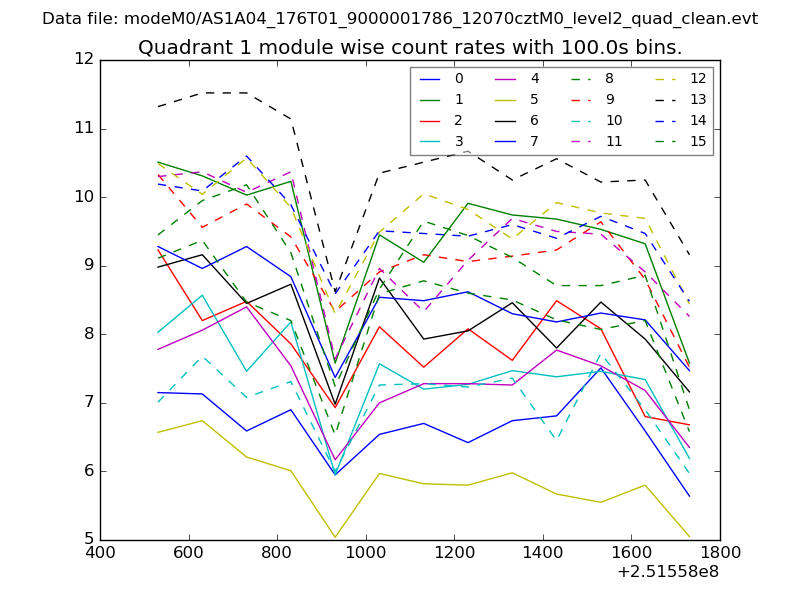 |
 |
| Module-wise count rates for Quadrant C Data is divided into 100 sec bins |
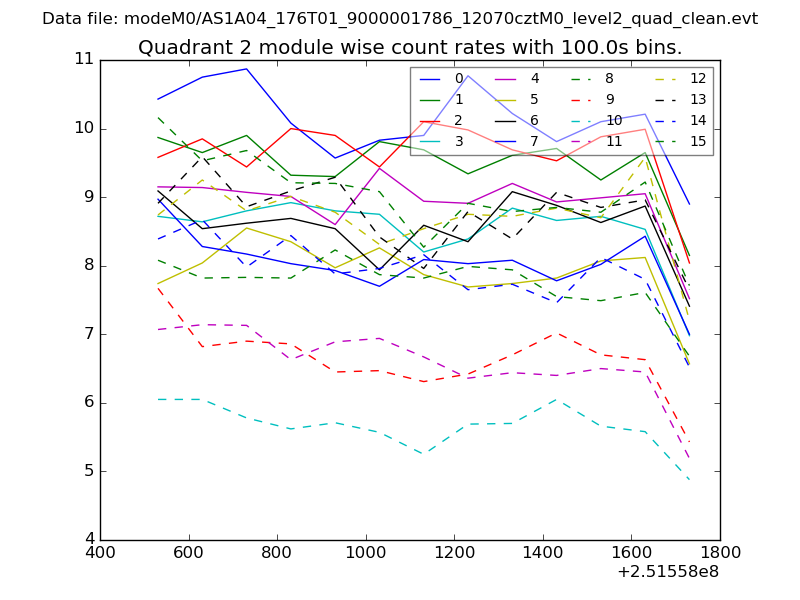 |
 |
| Module-wise count rates for Quadrant D Data is divided into 100 sec bins |
 |
 |
| Parameter | Plot |
|---|---|
| CZT HV Monitor | 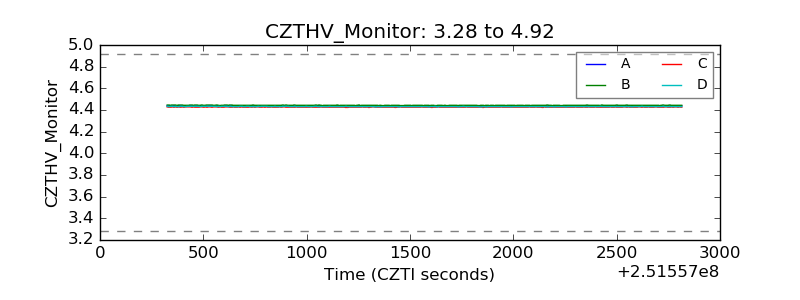 |
| D_VDD | 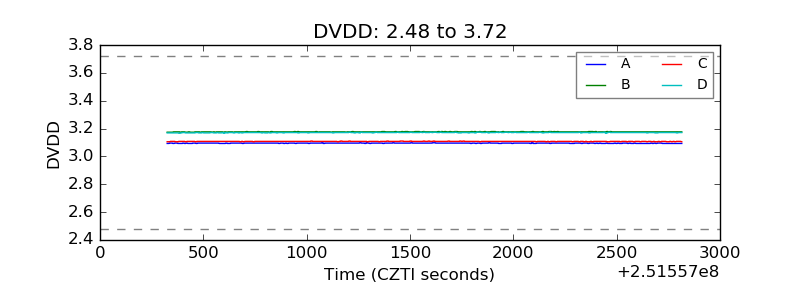 |
| Temperature 1 | 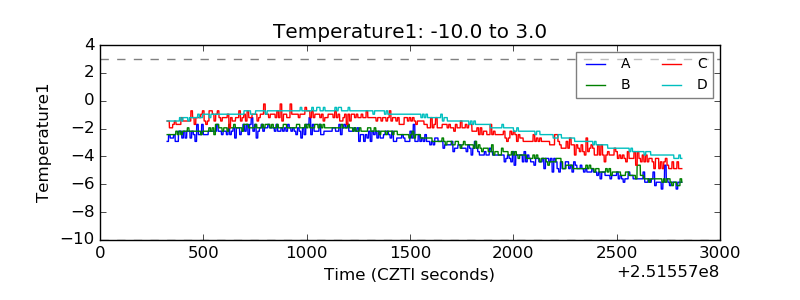 |
| Veto HV Monitor | 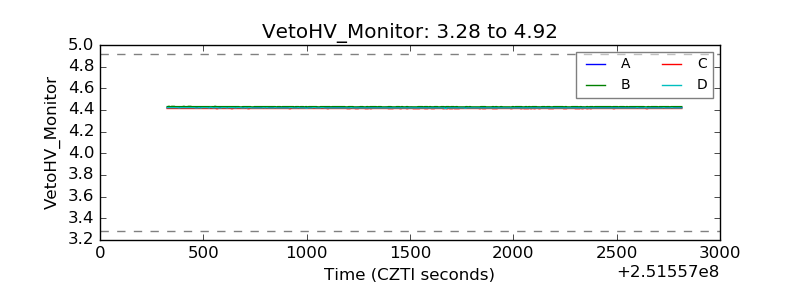 |
| Veto LLD | 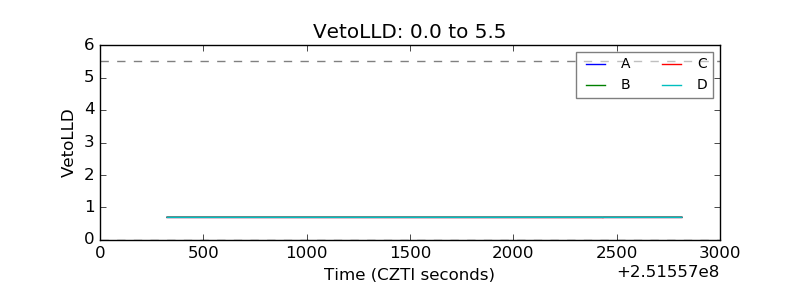 |
| Alpha Counter | 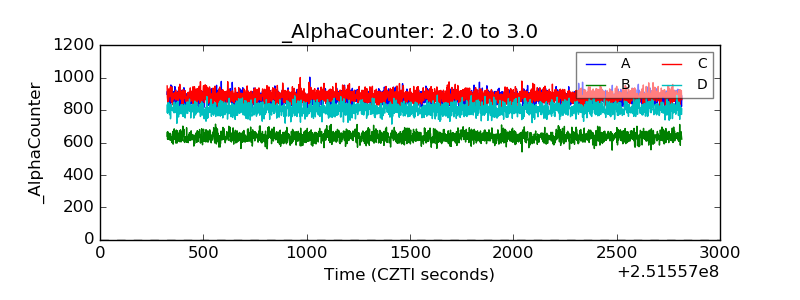 |
| _CPM_Rate | 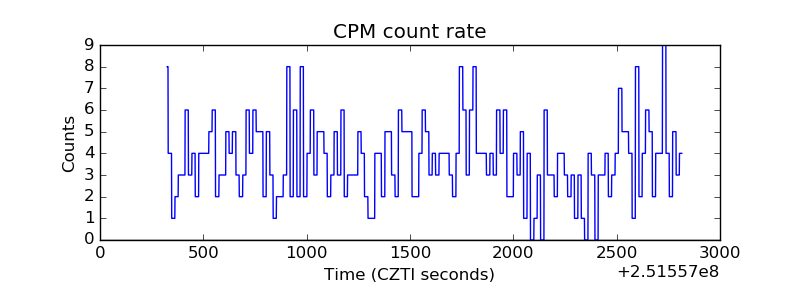 |
| CZT Counter | 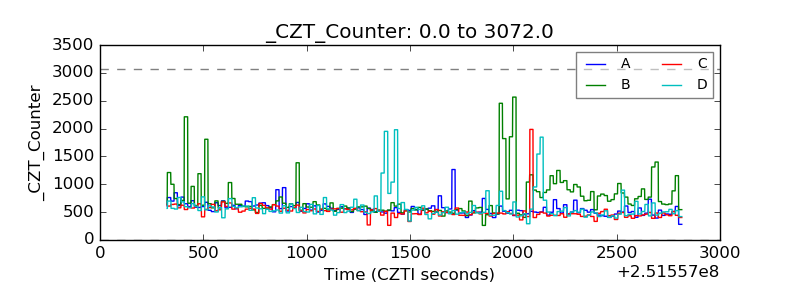 |
| +2.5 Volts monitor |  |
| +5 Volts monitor |  |
| _ROLL_ROT | 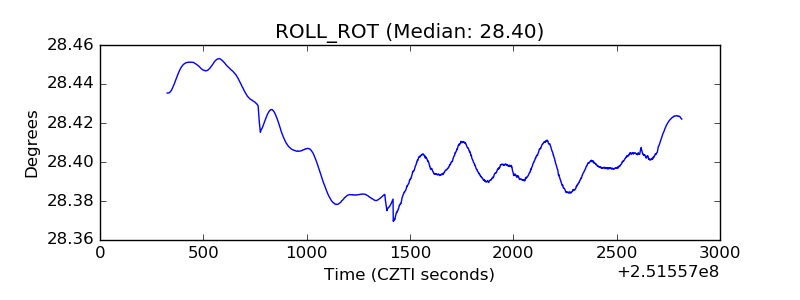 |
| _Roll_DEC | 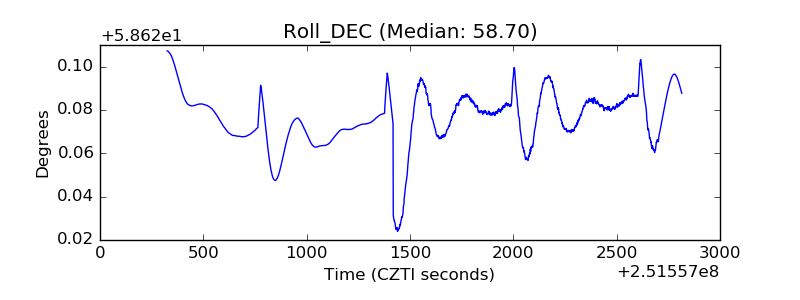 |
| _Roll_RA |  |
| Veto Counter | 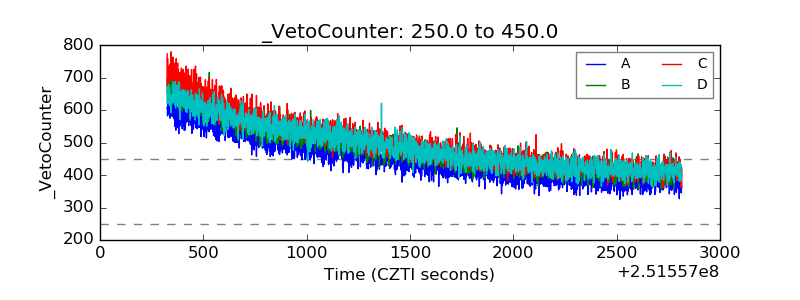 |