| Param | Original file | Final file |
|---|---|---|
| Filename | modeM0/AS1C03_015T01_9000001788_12070cztM0_level2.evt | modeM0/AS1C03_015T01_9000001788_12070cztM0_level2_quad_clean.evt |
| Size (bytes) | 239,218,560 | 68,572,800 |
| Size | 228.1 MB | 65.4 MB |
| Events in quadrant A | 1,738,326 | 466,191 |
| Events in quadrant B | 1,983,571 | 466,820 |
| Events in quadrant C | 1,596,774 | 468,497 |
| Events in quadrant D | 1,705,455 | 446,283 |
| Mode M0 | |||
|---|---|---|---|
| Quadrant | BADHDUFLAG | Total packets | Discarded packets |
| A | 0 | 7308 | 2 |
| B | 0 | 7982 | 1 |
| C | 0 | 6806 | 1 |
| D | 0 | 7292 | 1 |
| Mode M9 | |||
|---|---|---|---|
| Quadrant | BADHDUFLAG | Total packets | Discarded packets |
| A | 0 | 13 | 0 |
| B | 0 | 13 | 0 |
| C | 0 | 13 | 0 |
| D | 0 | 13 | 0 |
| Mode SS | |||
|---|---|---|---|
| Quadrant | BADHDUFLAG | Total packets | Discarded packets |
| A | 0 | 64 | 0 |
| B | 0 | 64 | 0 |
| C | 0 | 64 | 0 |
| D | 0 | 64 | 0 |
| Quadrant | Total seconds | Saturated seconds | Saturation percentage |
|---|---|---|---|
| A | 3228 | 93 | 2.881041% |
| B | 3228 | 173 | 5.359356% |
| C | 3228 | 52 | 1.610905% |
| D | 3228 | 67 | 2.075589% |
Noise dominated data is calculated using 1-second bins in cleaned event files. If a bin has >2000 counts, and if more than 50% of those come from <1% of pixels, then it is considered to be noise-dominated and hence unusable.
| Quadrant | # 1 sec bins | Bins with >0 counts | Bins with >2000 counts | High rate bins dominated by noise | Noise dominated (total time) | Noise dominated (detector-on time) | Marked lightcurve |
|---|---|---|---|---|---|---|---|
| A | 4489 | 3229 | 3 | 3 | 0.07% | 0.09% | 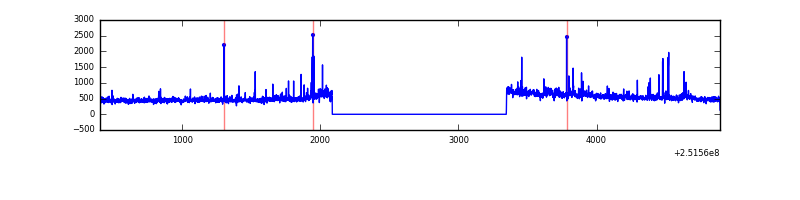 |
| B | 4489 | 3229 | 52 | 52 | 1.16% | 1.61% | 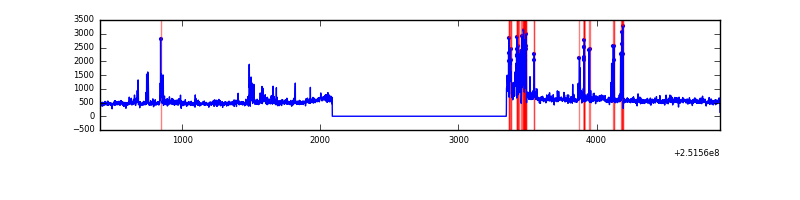 |
| C | 4489 | 3229 | 0 | 0 | 0.00% | 0.00% | 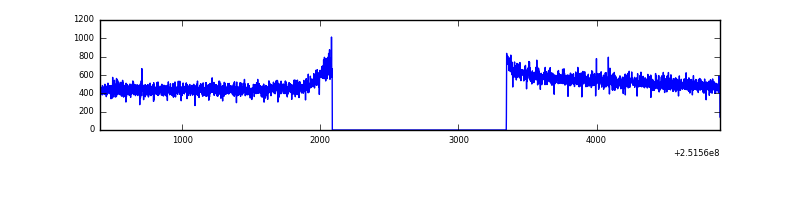 |
| D | 4489 | 3229 | 6 | 6 | 0.13% | 0.19% | 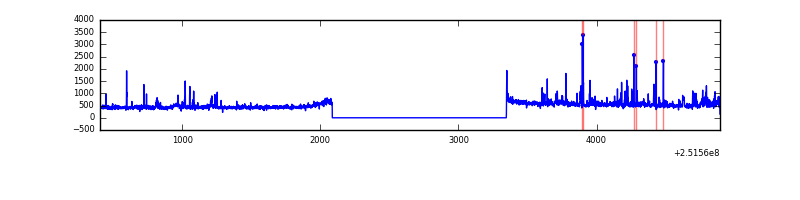 |
Top three noisy pixels from each quadrant. If the there are fewer than three noisy pixels in the level2.evt file, extra rows are filled as -1
| Pixel properties | Quadrant properties | ||||||
|---|---|---|---|---|---|---|---|
| Quadrant | DetID | PixID | Counts | Sigma | Mean | Median | Sigma |
| A | 13 | 251 | 45336 | 530.34 | 414 | 406 | 84.7 |
| A | 1 | 162 | 31641 | 368.69 | 414 | 406 | 84.7 |
| A | 14 | 63 | 20238 | 234.09 | 414 | 406 | 84.7 |
| B | 4 | 239 | 248942 | 3200.32 | 410 | 399 | 77.7 |
| B | 15 | 204 | 72261 | 925.32 | 410 | 399 | 77.7 |
| B | 11 | 51 | 20127 | 254.02 | 410 | 399 | 77.7 |
| C | 0 | 207 | 8180 | 82.88 | 407 | 409 | 93.8 |
| C | 13 | 61 | 3009 | 27.73 | 407 | 409 | 93.8 |
| C | 14 | 234 | 1511 | 11.75 | 407 | 409 | 93.8 |
| D | 1 | 52 | 104257 | 1101.56 | 402 | 391 | 94.3 |
| D | 13 | 249 | 24707 | 257.88 | 402 | 391 | 94.3 |
| D | 7 | 71 | 18478 | 191.82 | 402 | 391 | 94.3 |
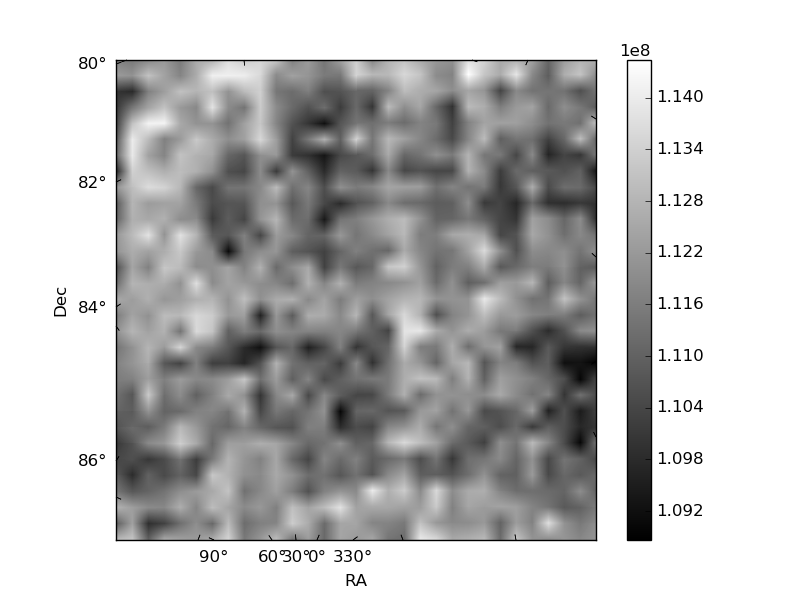
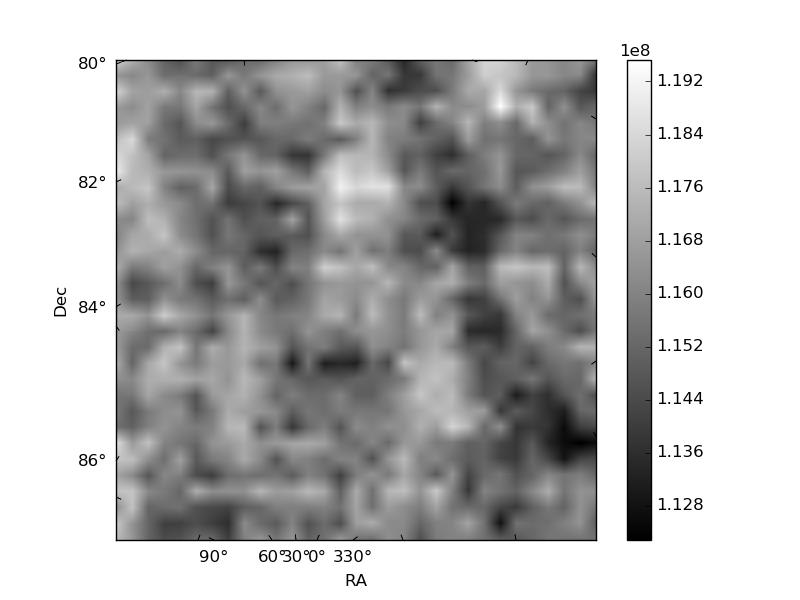
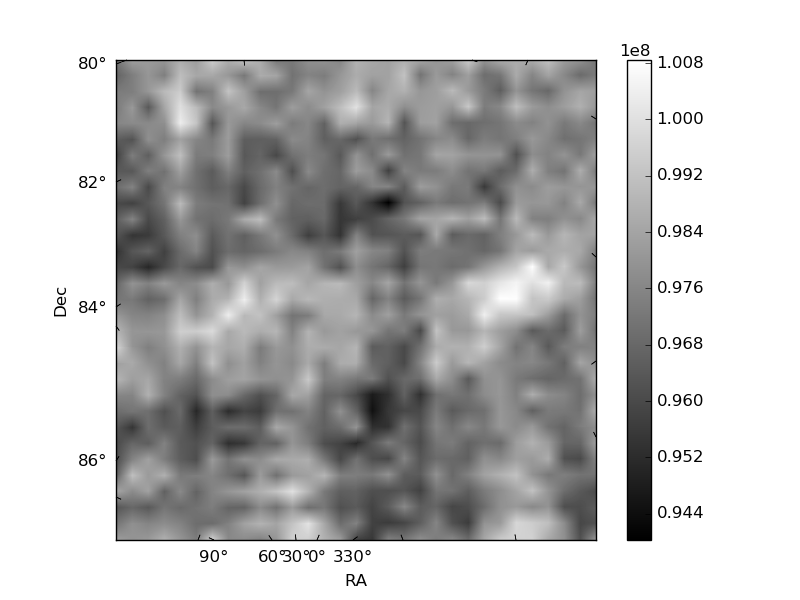
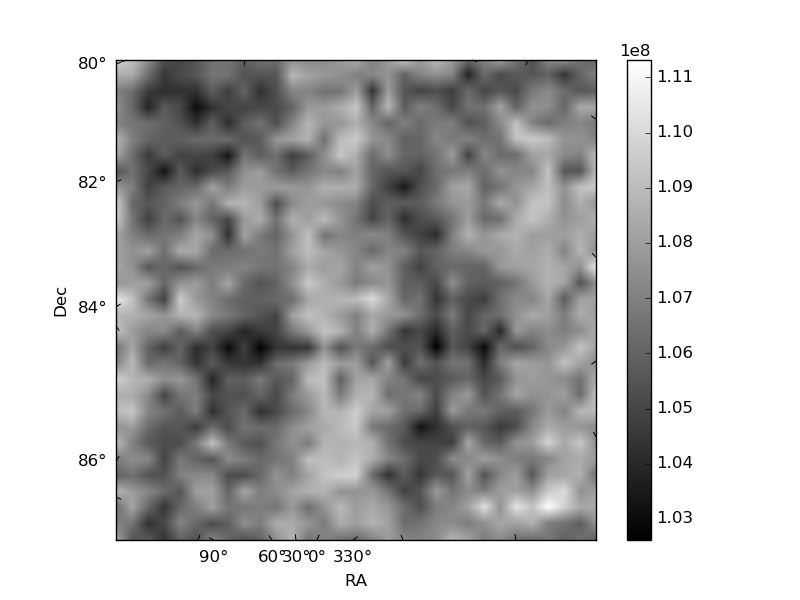
Histogram calculated using DETX and DETY for each event in the final _common_clean file
| Quadrant A | 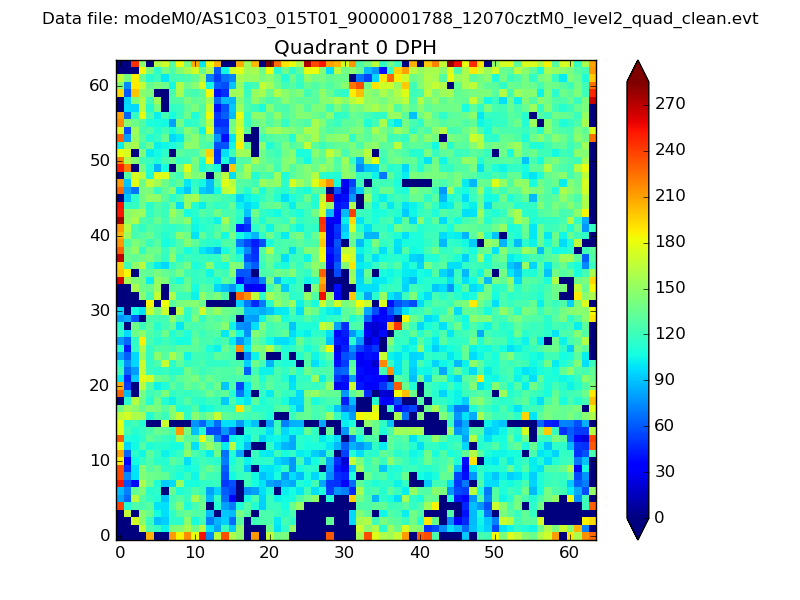 |
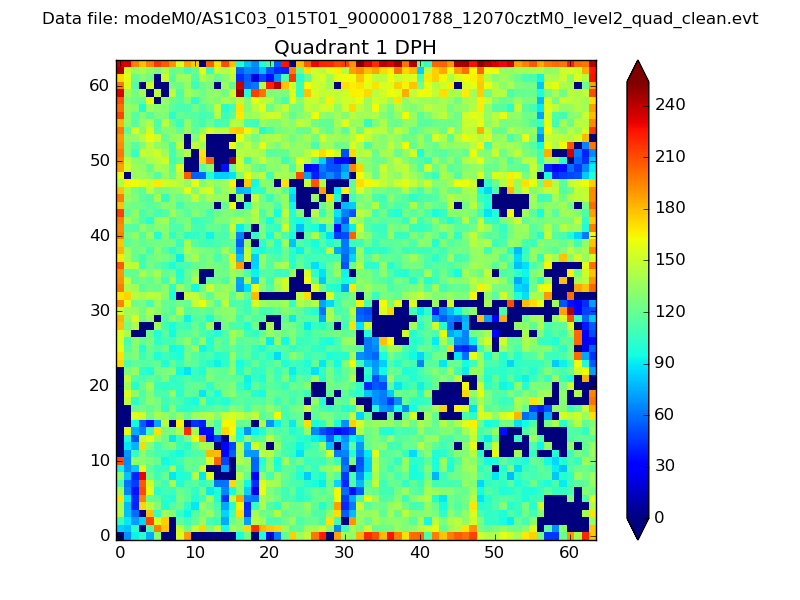 |
Quadrant B |
|---|---|---|---|
| Quadrant D | 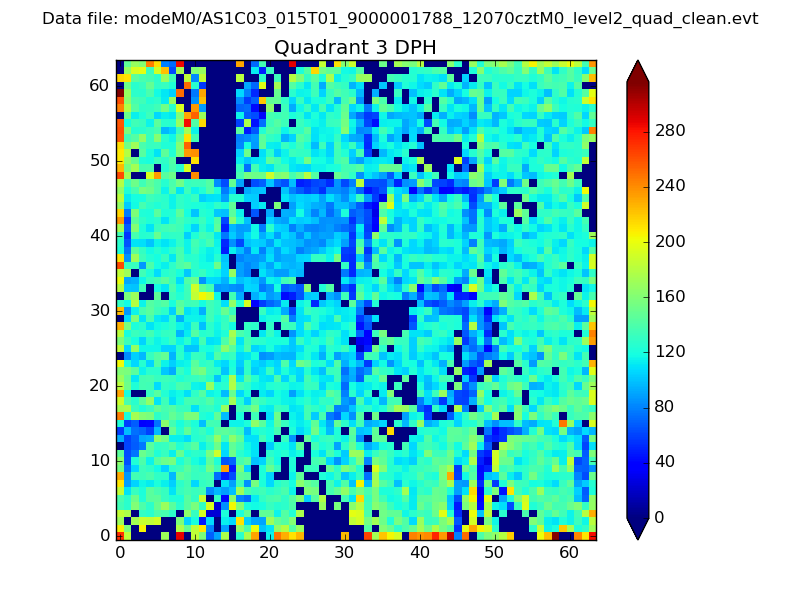 |
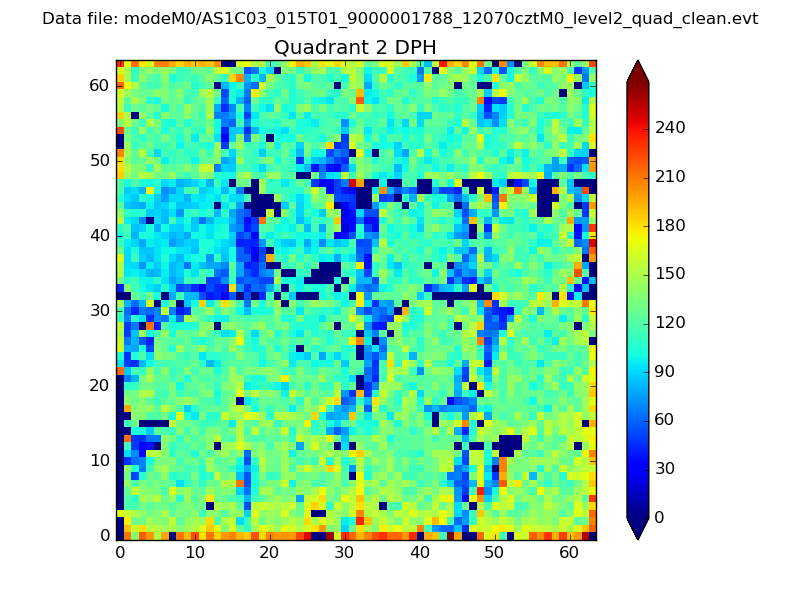 |
Quadrant C |
| Plot type | Count rate plots | Images |
|---|---|---|
| Comparison with Poisson distribution Blue bars denote a histogram of data divided into 1 sec bins. Red curve is a Poisson curve with rate = median count rate of data. |
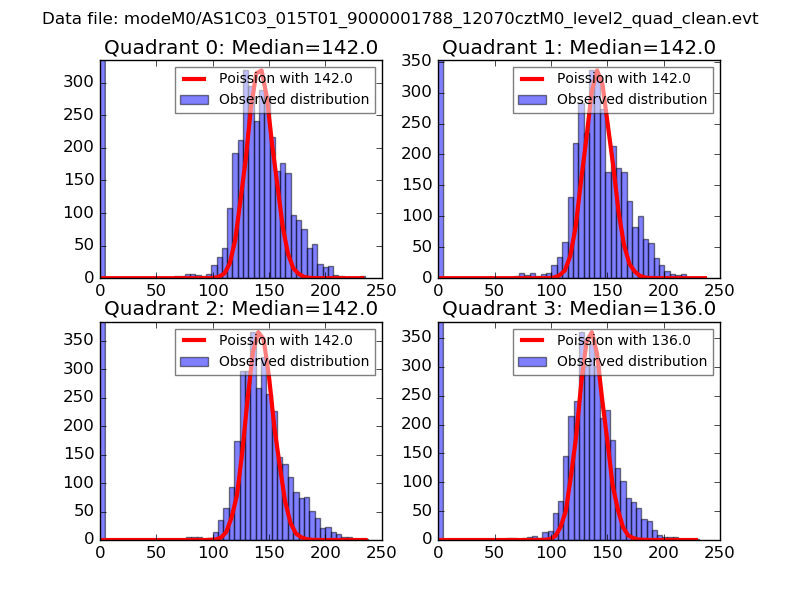 |
 |
| Quadrant-wise count rates Data is divided into 100 sec bins |
 |
|
| Module-wise count rates for Quadrant A Data is divided into 100 sec bins |
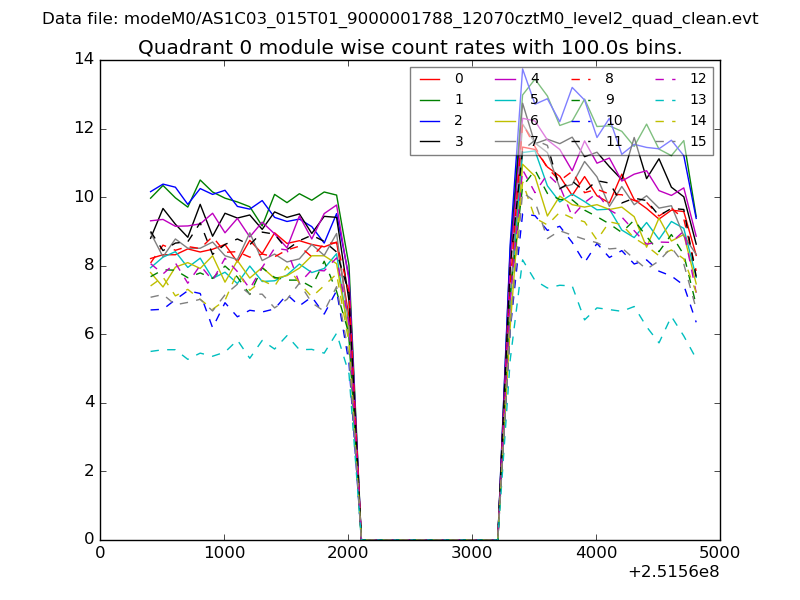 |
 |
| Module-wise count rates for Quadrant B Data is divided into 100 sec bins |
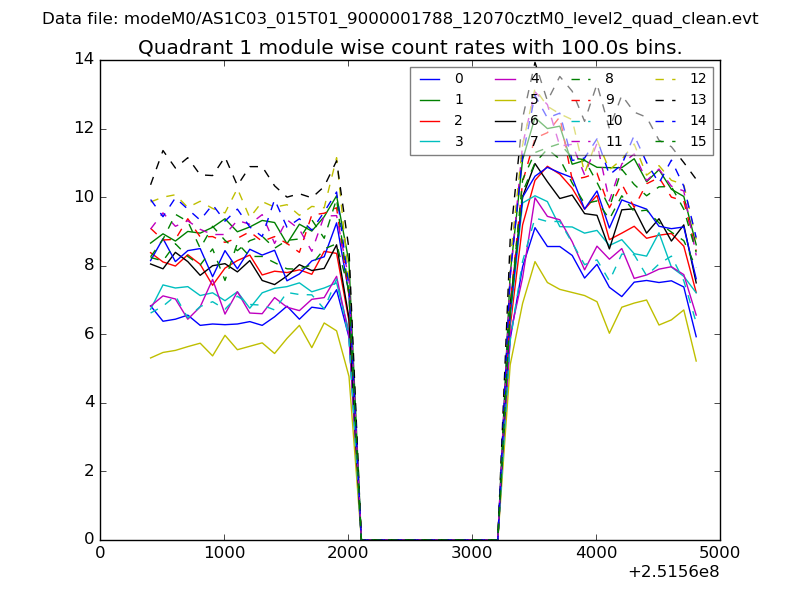 |
 |
| Module-wise count rates for Quadrant C Data is divided into 100 sec bins |
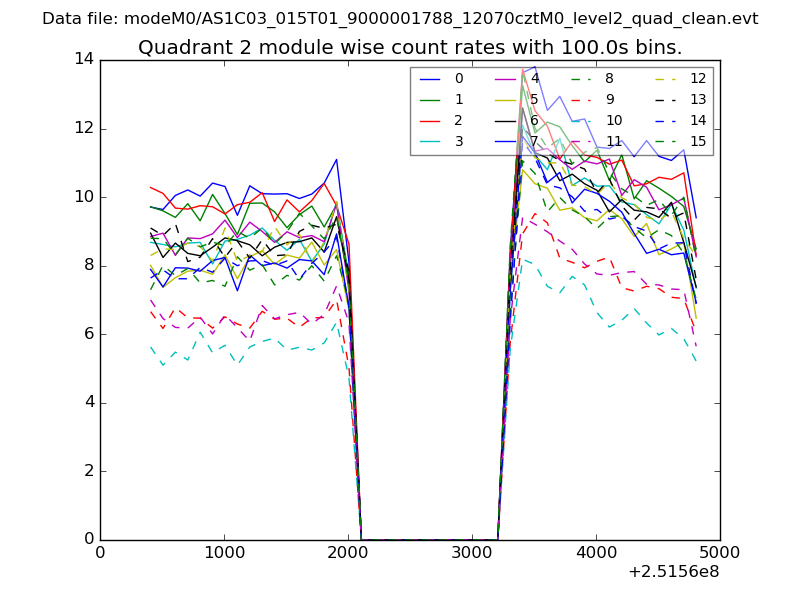 |
 |
| Module-wise count rates for Quadrant D Data is divided into 100 sec bins |
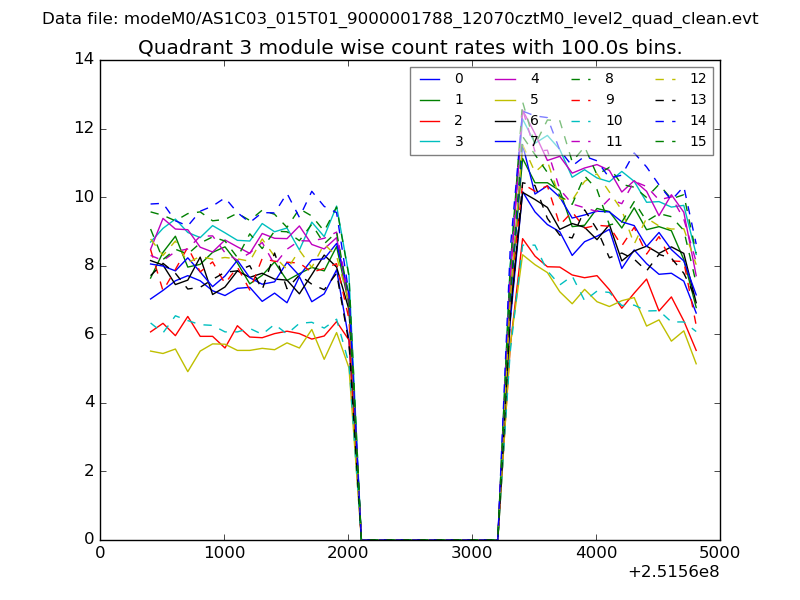 |
 |
| Parameter | Plot |
|---|---|
| CZT HV Monitor | 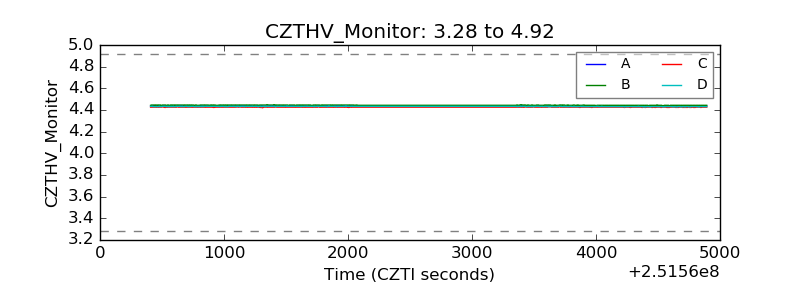 |
| D_VDD | 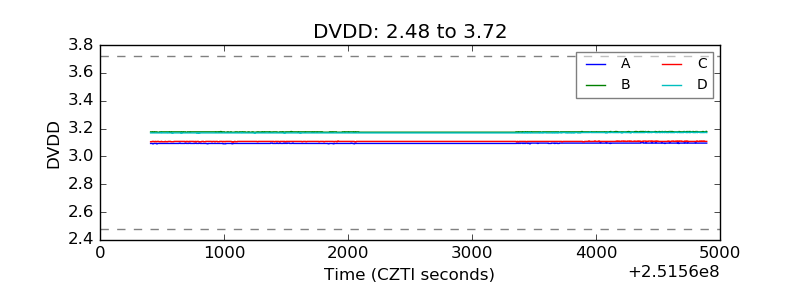 |
| Temperature 1 |  |
| Veto HV Monitor | 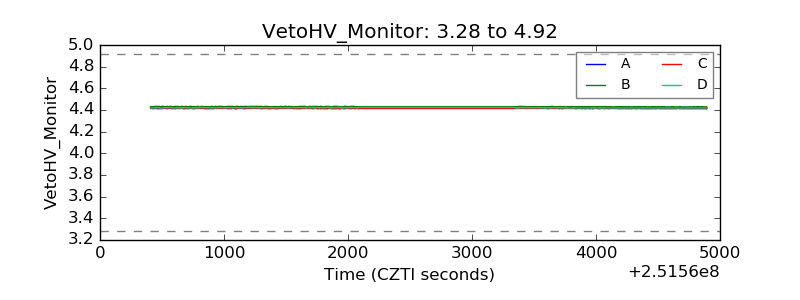 |
| Veto LLD | 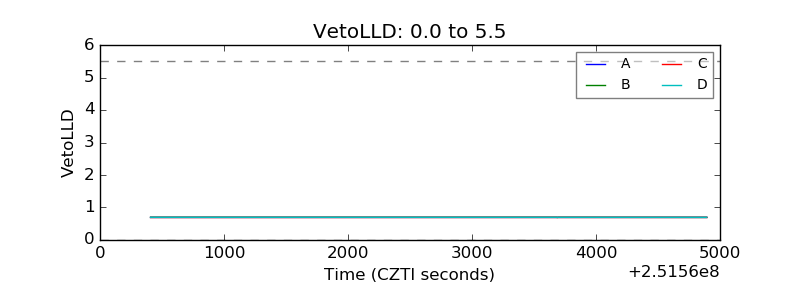 |
| Alpha Counter | 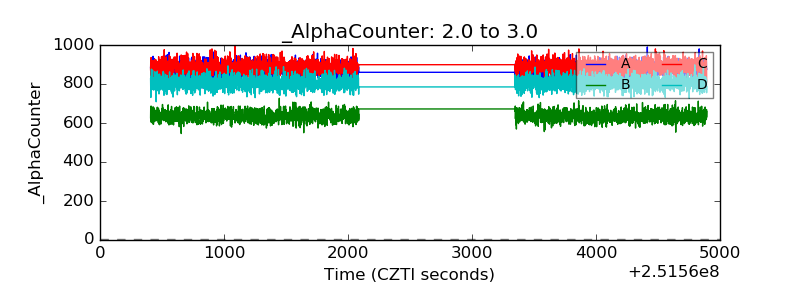 |
| _CPM_Rate | 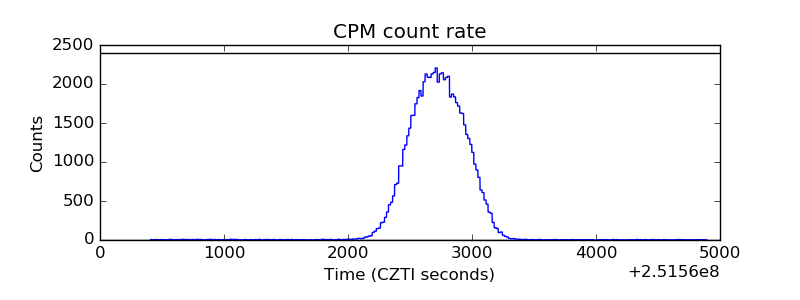 |
| CZT Counter |  |
| +2.5 Volts monitor |  |
| +5 Volts monitor |  |
| _ROLL_ROT | 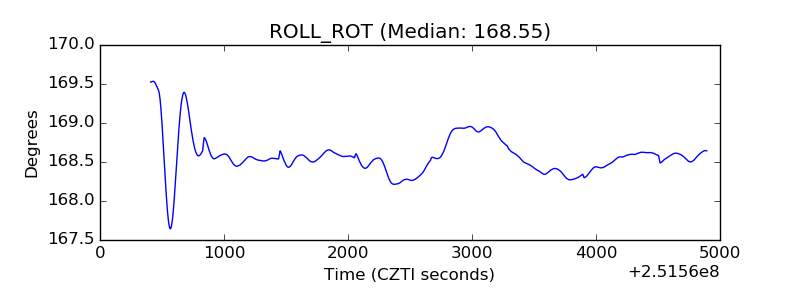 |
| _Roll_DEC | 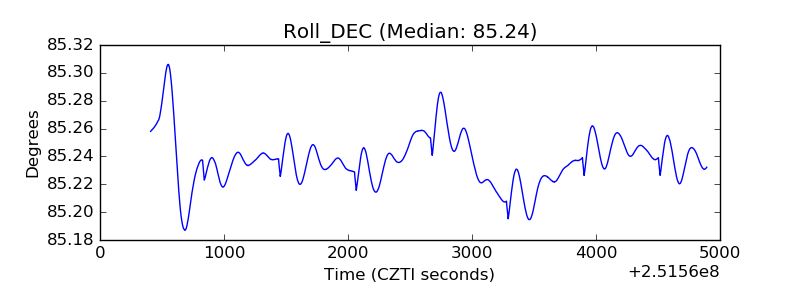 |
| _Roll_RA |  |
| Veto Counter | 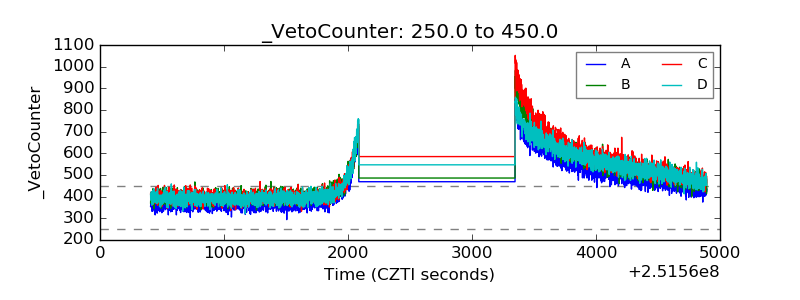 |