| Param | Original file | Final file |
|---|---|---|
| Filename | modeM0/AS1C03_015T01_9000001788_12071cztM0_level2.evt | modeM0/AS1C03_015T01_9000001788_12071cztM0_level2_quad_clean.evt |
| Size (bytes) | 342,984,960 | 97,608,960 |
| Size | 327.1 MB | 93.1 MB |
| Events in quadrant A | 2,374,108 | 663,990 |
| Events in quadrant B | 2,838,006 | 662,348 |
| Events in quadrant C | 2,220,301 | 663,656 |
| Events in quadrant D | 2,632,540 | 633,927 |
| Mode M0 | |||
|---|---|---|---|
| Quadrant | BADHDUFLAG | Total packets | Discarded packets |
| A | 0 | 10233 | 0 |
| B | 0 | 11482 | 0 |
| C | 0 | 9677 | 0 |
| D | 0 | 10838 | 0 |
| Mode SS | |||
|---|---|---|---|
| Quadrant | BADHDUFLAG | Total packets | Discarded packets |
| A | 0 | 94 | 0 |
| B | 0 | 94 | 0 |
| C | 0 | 94 | 0 |
| D | 0 | 94 | 0 |
| Quadrant | Total seconds | Saturated seconds | Saturation percentage |
|---|---|---|---|
| A | 4734 | 23 | 0.485847% |
| B | 4734 | 130 | 2.746092% |
| C | 4734 | 2 | 0.042248% |
| D | 4734 | 42 | 0.887199% |
Noise dominated data is calculated using 1-second bins in cleaned event files. If a bin has >2000 counts, and if more than 50% of those come from <1% of pixels, then it is considered to be noise-dominated and hence unusable.
| Quadrant | # 1 sec bins | Bins with >0 counts | Bins with >2000 counts | High rate bins dominated by noise | Noise dominated (total time) | Noise dominated (detector-on time) | Marked lightcurve |
|---|---|---|---|---|---|---|---|
| A | 4735 | 4735 | 8 | 8 | 0.17% | 0.17% | 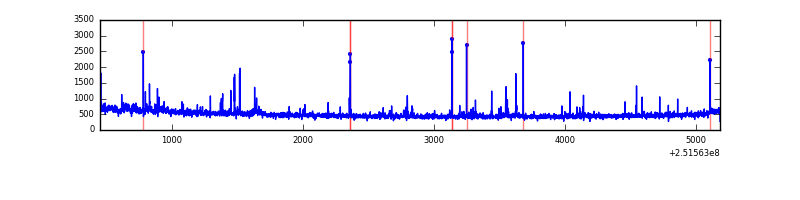 |
| B | 4735 | 4735 | 76 | 76 | 1.61% | 1.61% | 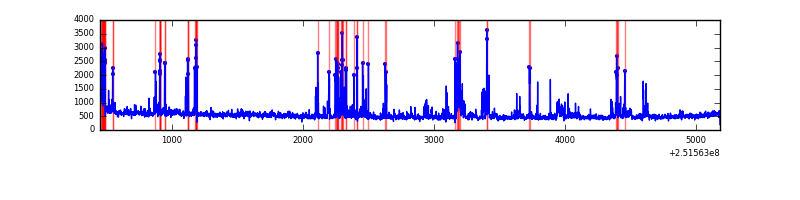 |
| C | 4735 | 4735 | 0 | 0 | 0.00% | 0.00% | 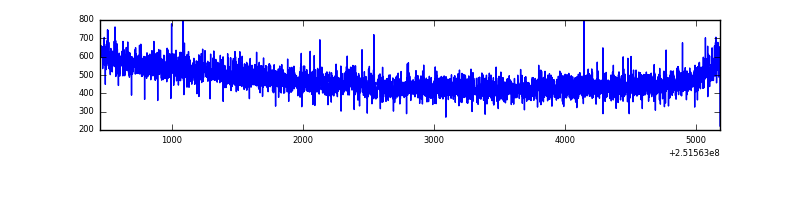 |
| D | 4735 | 4735 | 39 | 39 | 0.82% | 0.82% | 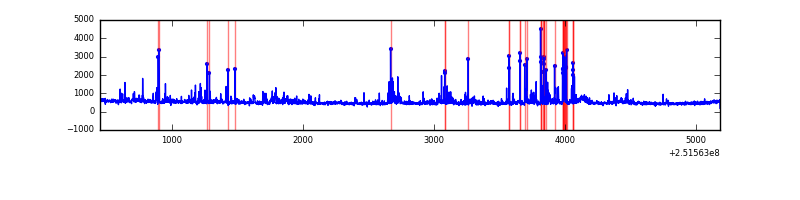 |
Top three noisy pixels from each quadrant. If the there are fewer than three noisy pixels in the level2.evt file, extra rows are filled as -1
| Pixel properties | Quadrant properties | ||||||
|---|---|---|---|---|---|---|---|
| Quadrant | DetID | PixID | Counts | Sigma | Mean | Median | Sigma |
| A | 13 | 251 | 66512 | 566.74 | 573 | 561 | 116.4 |
| A | 1 | 162 | 29351 | 247.4 | 573 | 561 | 116.4 |
| A | 14 | 63 | 15787 | 130.84 | 573 | 561 | 116.4 |
| B | 4 | 239 | 462000 | 4368.36 | 568 | 554 | 105.6 |
| B | 15 | 204 | 108167 | 1018.74 | 568 | 554 | 105.6 |
| B | 0 | 219 | 22791 | 210.51 | 568 | 554 | 105.6 |
| C | 0 | 207 | 15925 | 118.77 | 565 | 567 | 129.3 |
| C | 13 | 61 | 4203 | 28.12 | 565 | 567 | 129.3 |
| C | 14 | 234 | 1570 | 7.75 | 565 | 567 | 129.3 |
| D | 1 | 52 | 321025 | 2440.09 | 559 | 545 | 131.3 |
| D | 8 | 195 | 77351 | 584.79 | 559 | 545 | 131.3 |
| D | 7 | 71 | 35340 | 264.92 | 559 | 545 | 131.3 |
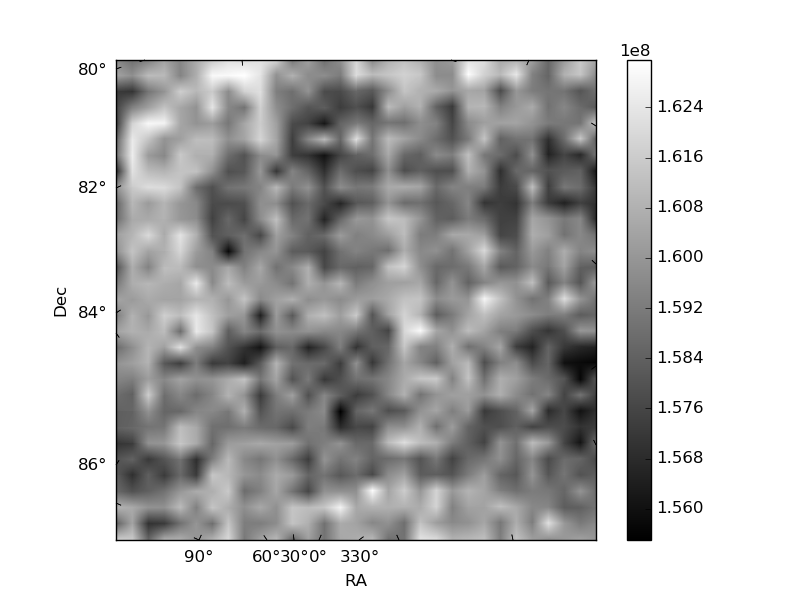
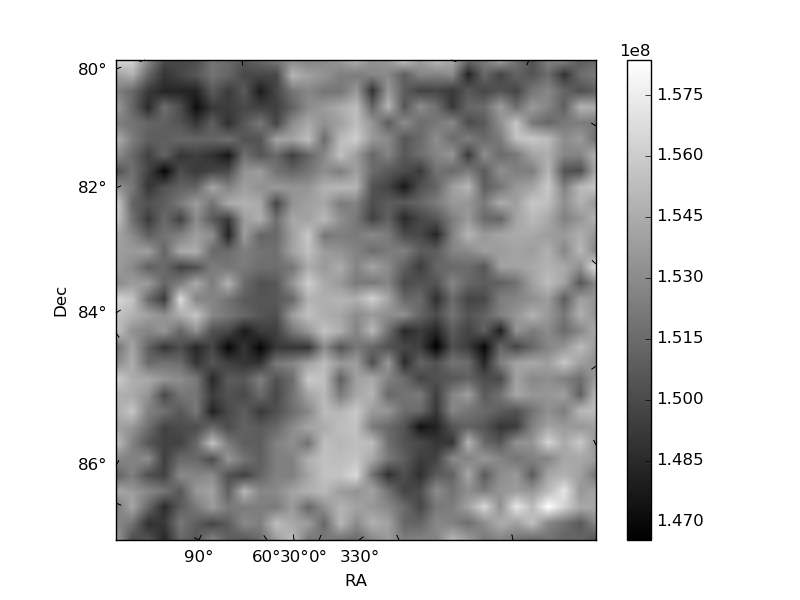
Histogram calculated using DETX and DETY for each event in the final _common_clean file
| Quadrant A | 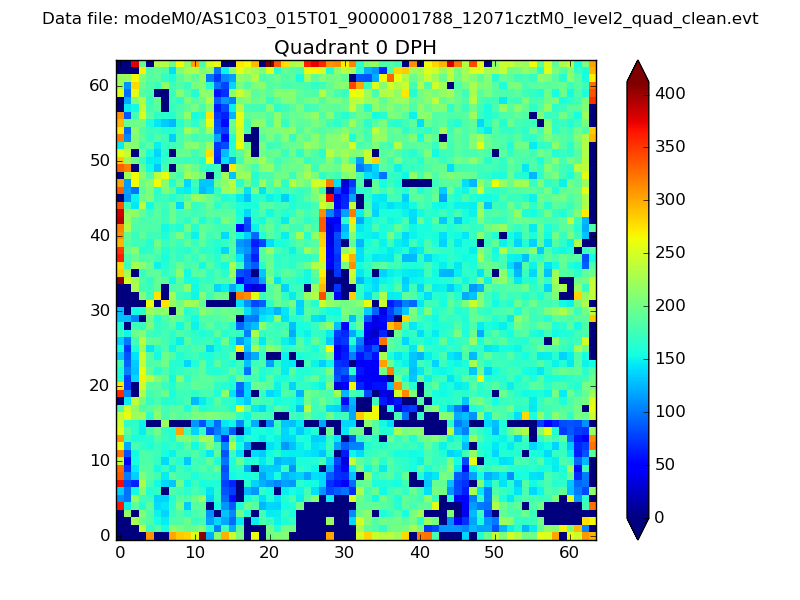 |
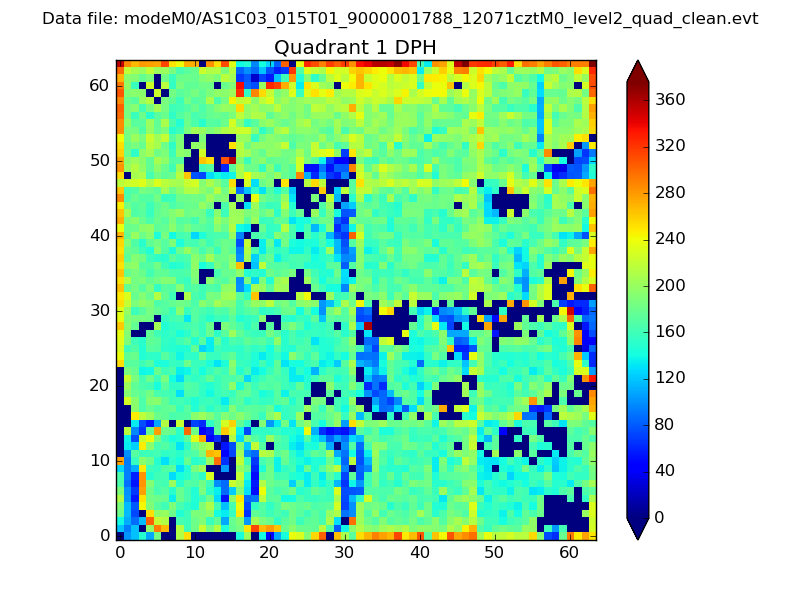 |
Quadrant B |
|---|---|---|---|
| Quadrant D | 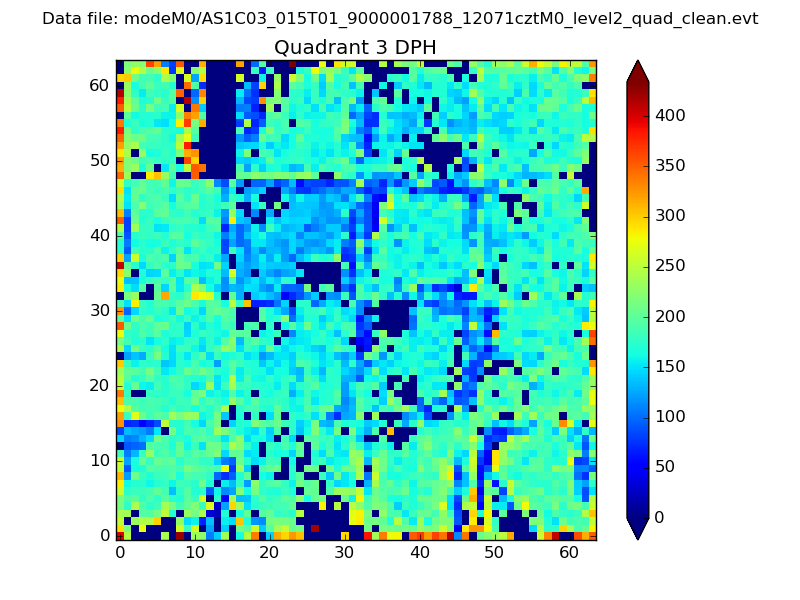 |
 |
Quadrant C |
| Plot type | Count rate plots | Images |
|---|---|---|
| Comparison with Poisson distribution Blue bars denote a histogram of data divided into 1 sec bins. Red curve is a Poisson curve with rate = median count rate of data. |
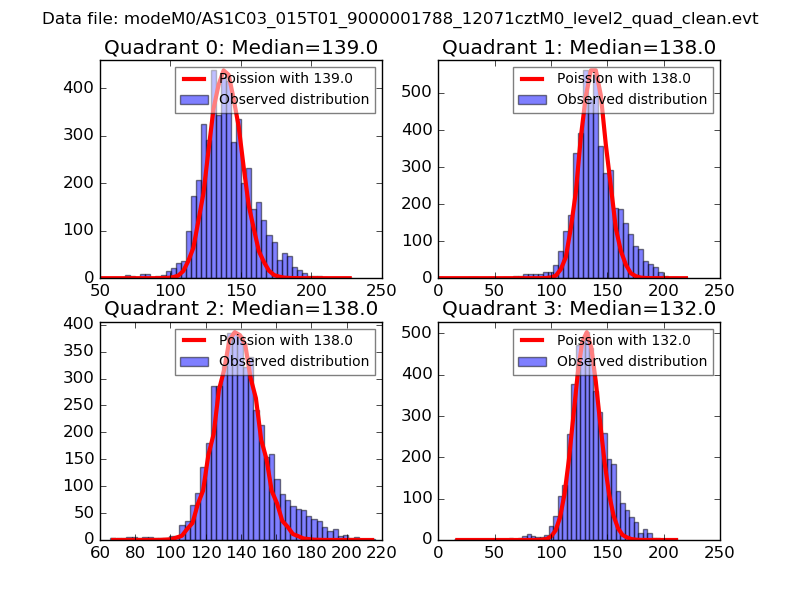 |
 |
| Quadrant-wise count rates Data is divided into 100 sec bins |
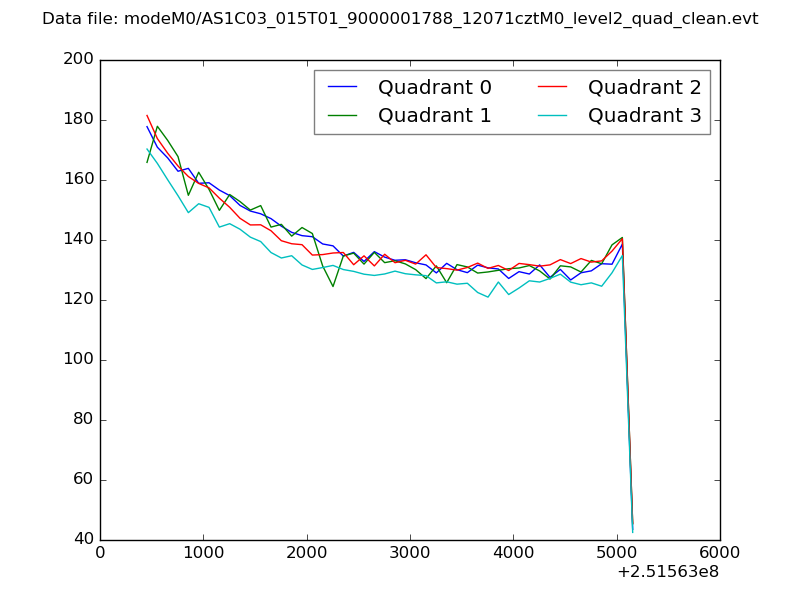 |
|
| Module-wise count rates for Quadrant A Data is divided into 100 sec bins |
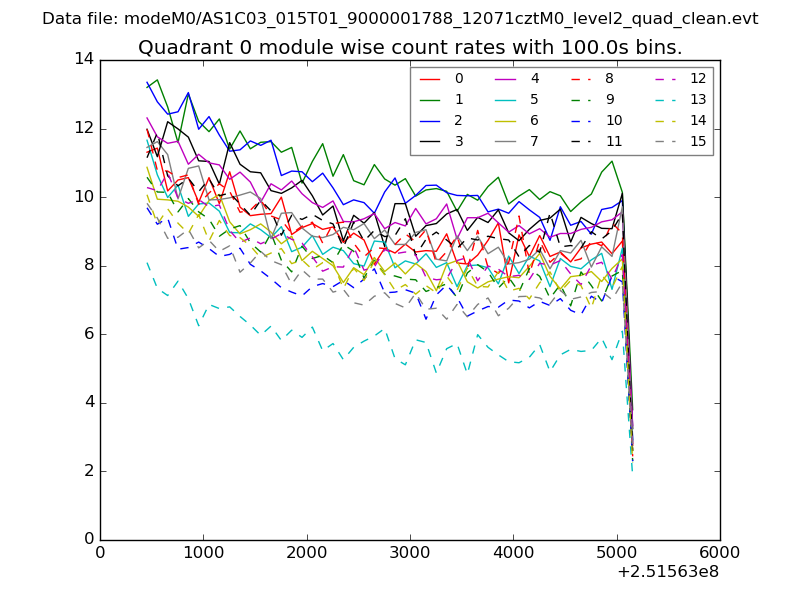 |
 |
| Module-wise count rates for Quadrant B Data is divided into 100 sec bins |
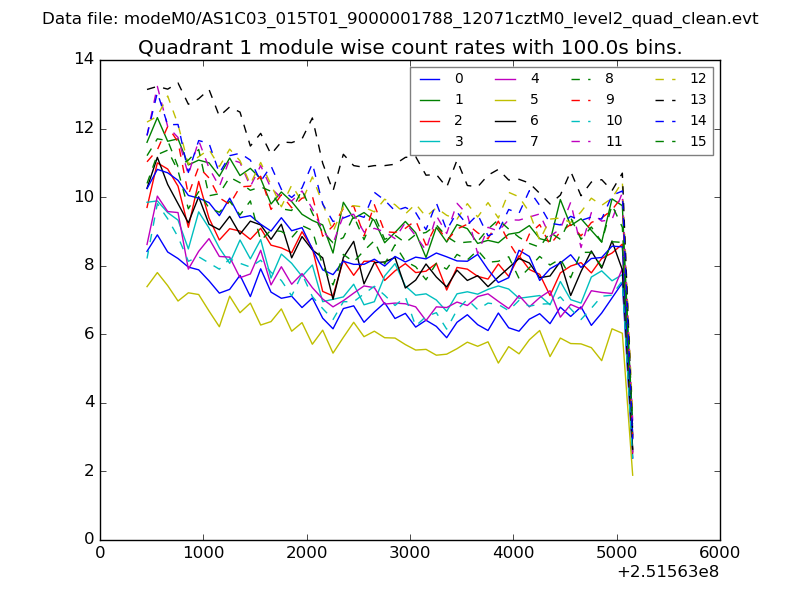 |
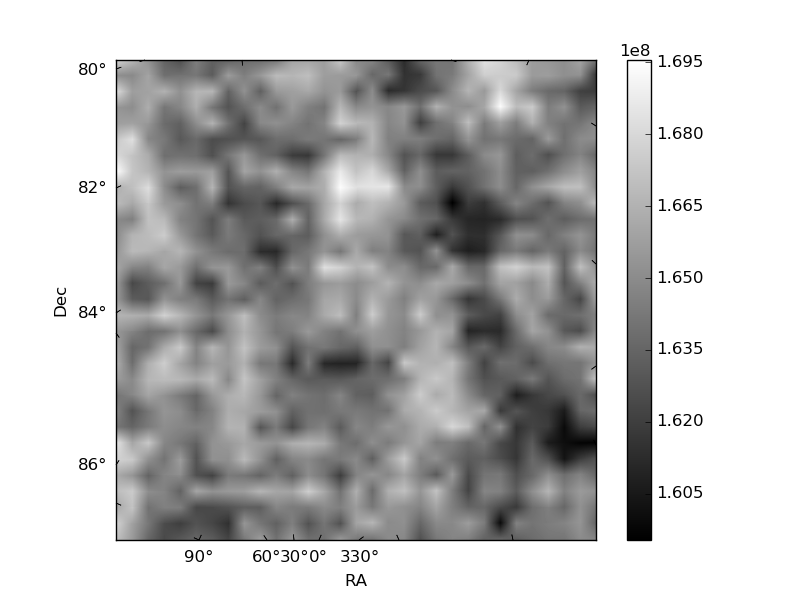 |
| Module-wise count rates for Quadrant C Data is divided into 100 sec bins |
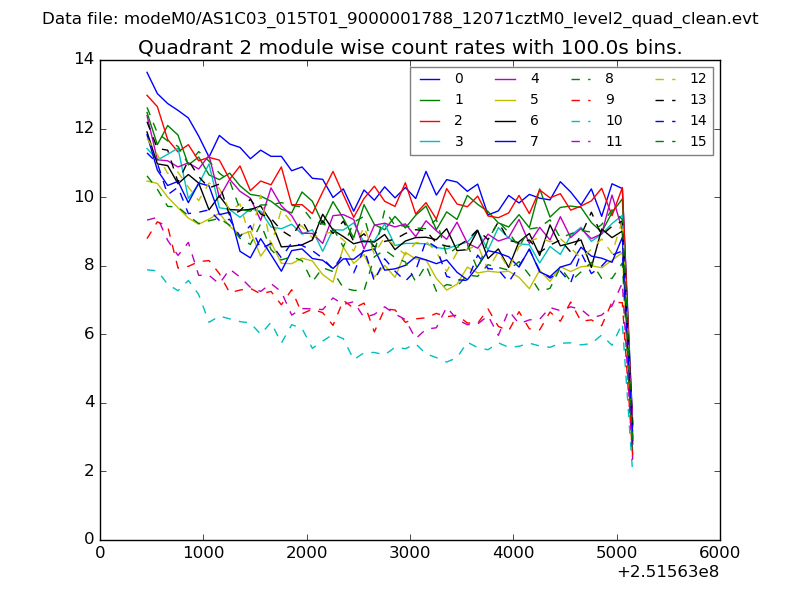 |
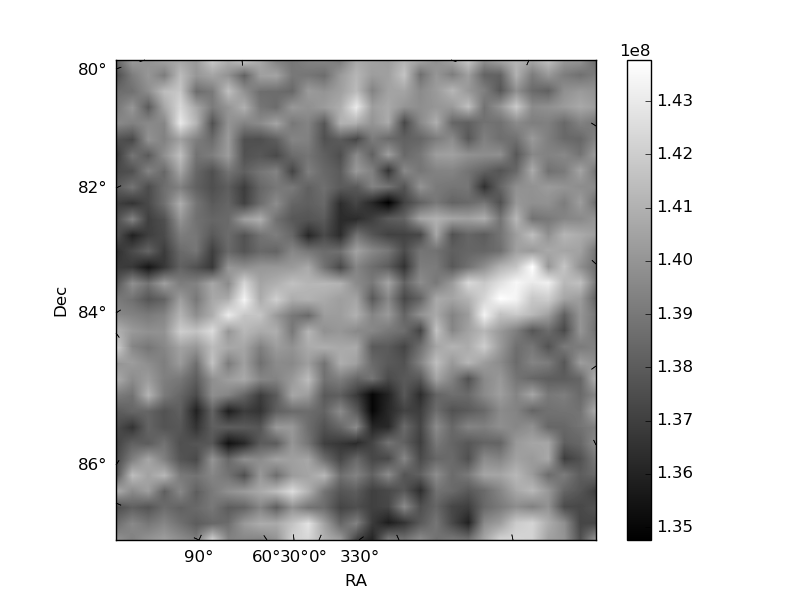 |
| Module-wise count rates for Quadrant D Data is divided into 100 sec bins |
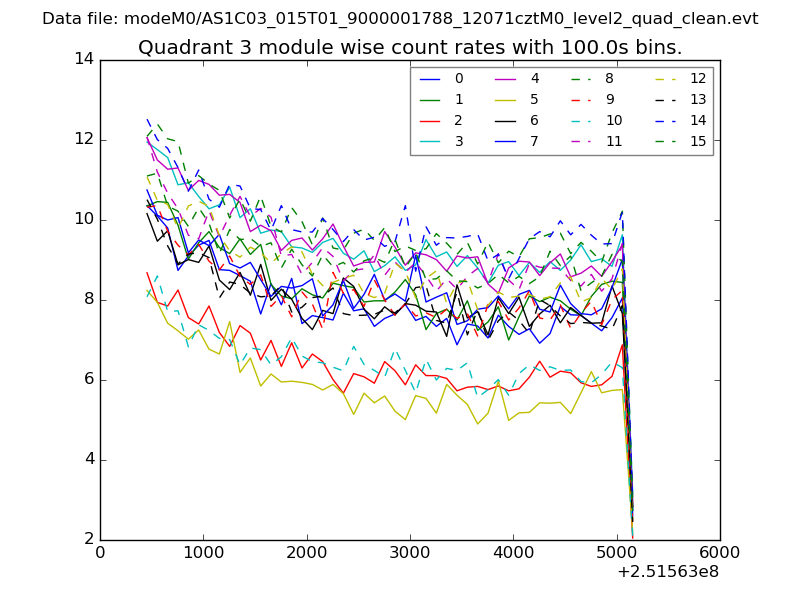 |
 |
| Parameter | Plot |
|---|---|
| CZT HV Monitor | 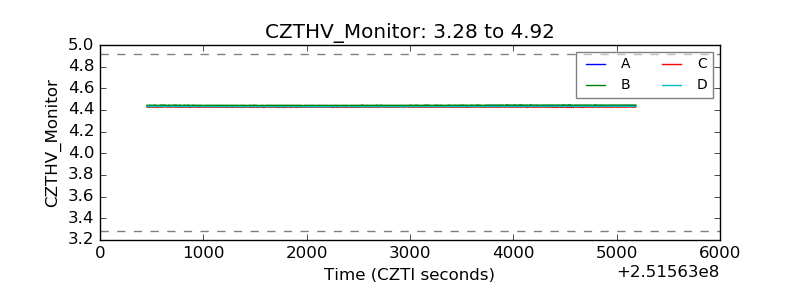 |
| D_VDD | 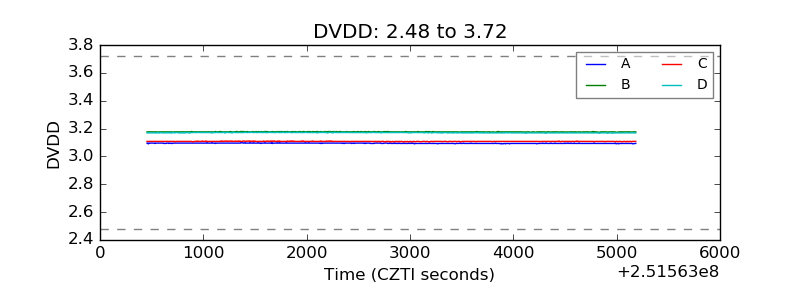 |
| Temperature 1 |  |
| Veto HV Monitor | 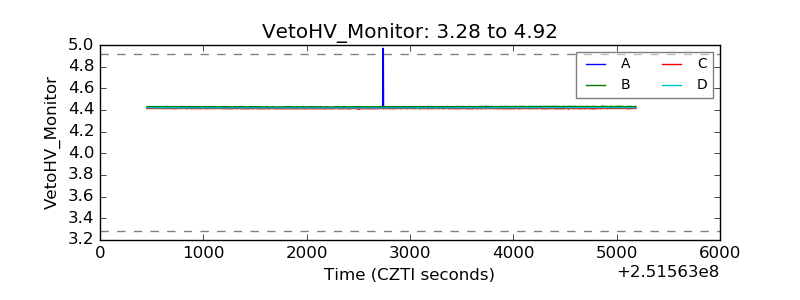 |
| Veto LLD | 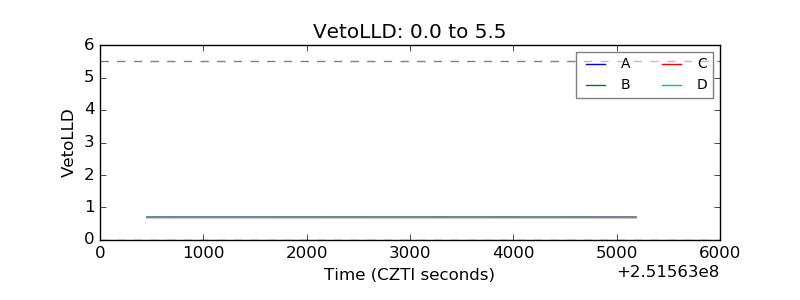 |
| Alpha Counter | 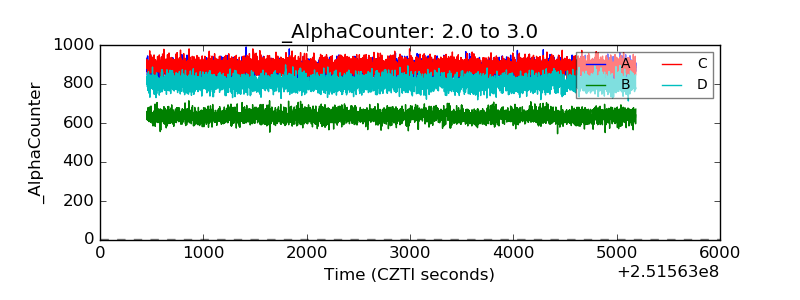 |
| _CPM_Rate | 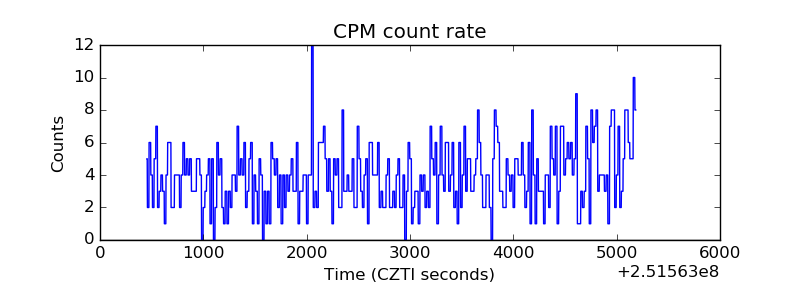 |
| CZT Counter | 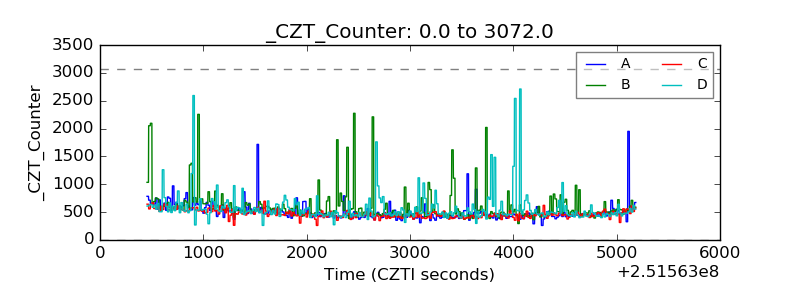 |
| +2.5 Volts monitor |  |
| +5 Volts monitor |  |
| _ROLL_ROT | 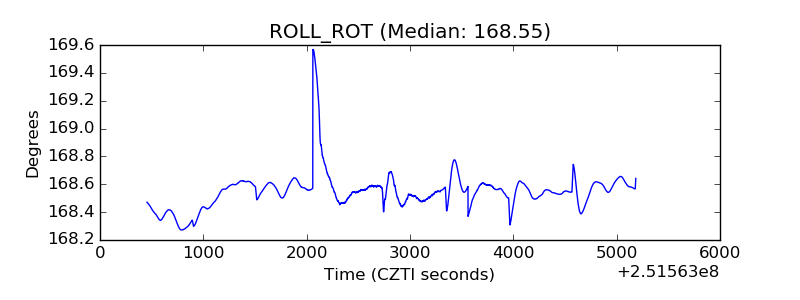 |
| _Roll_DEC | 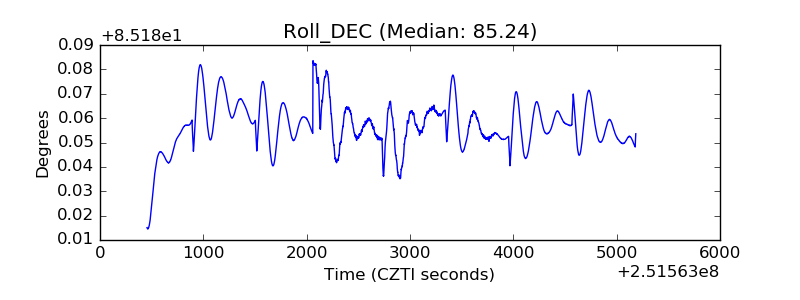 |
| _Roll_RA |  |
| Veto Counter | 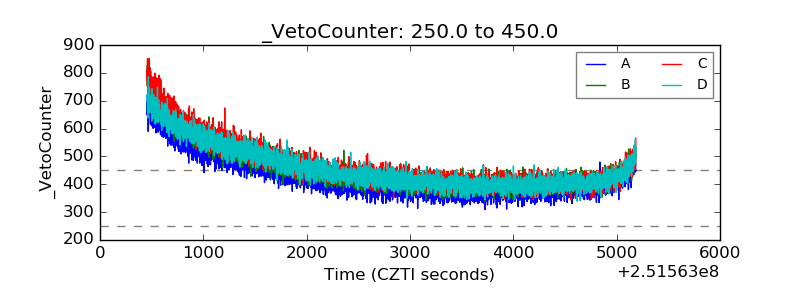 |