| Param | Original file | Final file |
|---|---|---|
| Filename | modeM0/AS1A04_130T04_9000001794_12080cztM0_level2.evt | modeM0/AS1A04_130T04_9000001794_12080cztM0_level2_quad_clean.evt |
| Size (bytes) | 111,041,280 | 24,586,560 |
| Size | 105.9 MB | 23.4 MB |
| Events in quadrant A | 714,300 | 161,306 |
| Events in quadrant B | 1,111,186 | 160,452 |
| Events in quadrant C | 650,925 | 161,600 |
| Events in quadrant D | 787,269 | 155,041 |
| Mode M0 | |||
|---|---|---|---|
| Quadrant | BADHDUFLAG | Total packets | Discarded packets |
| A | 0 | 2963 | 2 |
| B | 0 | 4191 | 1 |
| C | 0 | 2882 | 1 |
| D | 0 | 3181 | 1 |
| Mode SS | |||
|---|---|---|---|
| Quadrant | BADHDUFLAG | Total packets | Discarded packets |
| A | 0 | 28 | 0 |
| B | 0 | 28 | 0 |
| C | 0 | 28 | 0 |
| D | 0 | 28 | 0 |
| Mode M9 | |||
|---|---|---|---|
| Quadrant | BADHDUFLAG | Total packets | Discarded packets |
| A | 0 | 2 | 0 |
| B | 0 | 2 | 0 |
| C | 0 | 2 | 0 |
| D | 0 | 2 | 0 |
| Quadrant | Total seconds | Saturated seconds | Saturation percentage |
|---|---|---|---|
| A | 1420 | 8 | 0.563380% |
| B | 1420 | 117 | 8.239437% |
| C | 1420 | 1 | 0.070423% |
| D | 1420 | 9 | 0.633803% |
Noise dominated data is calculated using 1-second bins in cleaned event files. If a bin has >2000 counts, and if more than 50% of those come from <1% of pixels, then it is considered to be noise-dominated and hence unusable.
| Quadrant | # 1 sec bins | Bins with >0 counts | Bins with >2000 counts | High rate bins dominated by noise | Noise dominated (total time) | Noise dominated (detector-on time) | Marked lightcurve |
|---|---|---|---|---|---|---|---|
| A | 1421 | 1421 | 0 | 0 | 0.00% | 0.00% | 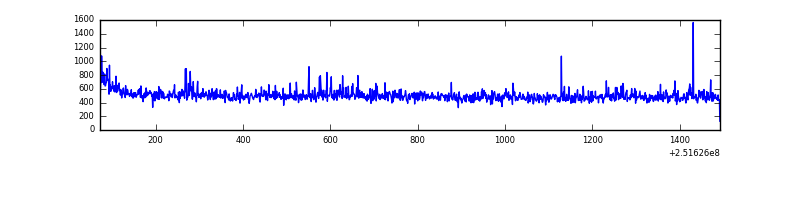 |
| B | 1421 | 1421 | 69 | 69 | 4.86% | 4.86% | 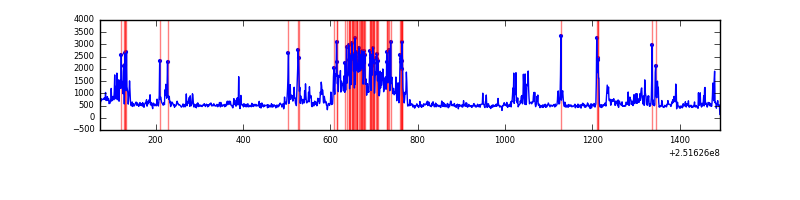 |
| C | 1421 | 1421 | 0 | 0 | 0.00% | 0.00% | 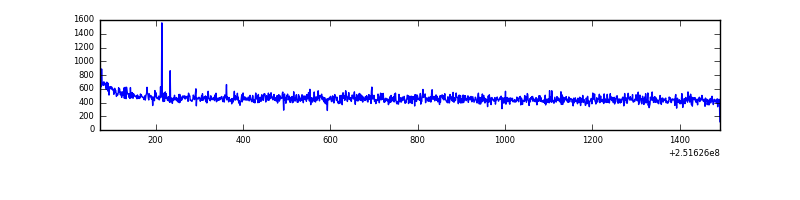 |
| D | 1421 | 1421 | 2 | 2 | 0.14% | 0.14% | 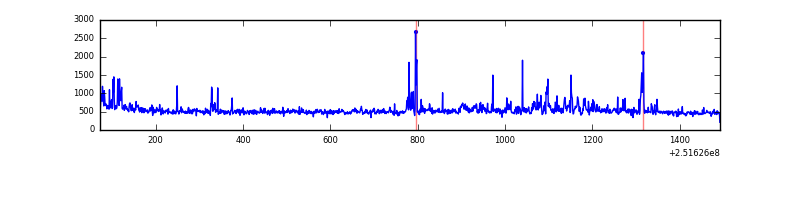 |
Top three noisy pixels from each quadrant. If the there are fewer than three noisy pixels in the level2.evt file, extra rows are filled as -1
| Pixel properties | Quadrant properties | ||||||
|---|---|---|---|---|---|---|---|
| Quadrant | DetID | PixID | Counts | Sigma | Mean | Median | Sigma |
| A | 1 | 162 | 13466 | 351.2 | 176 | 172 | 37.9 |
| A | 1 | 178 | 6372 | 163.79 | 176 | 172 | 37.9 |
| A | 1 | 161 | 5775 | 148.02 | 176 | 172 | 37.9 |
| B | 4 | 239 | 421698 | 12185.87 | 169 | 166 | 34.6 |
| B | 15 | 204 | 17956 | 514.28 | 169 | 166 | 34.6 |
| B | 0 | 214 | 7897 | 223.49 | 169 | 166 | 34.6 |
| C | 14 | 234 | 2532 | 59.01 | 165 | 165 | 40.1 |
| C | 8 | 208 | 2008 | 45.95 | 165 | 165 | 40.1 |
| C | 13 | 61 | 1189 | 25.53 | 165 | 165 | 40.1 |
| D | 8 | 195 | 54210 | 1294.73 | 167 | 163 | 41.7 |
| D | 10 | 50 | 45051 | 1075.32 | 167 | 163 | 41.7 |
| D | 1 | 52 | 30160 | 718.6 | 167 | 163 | 41.7 |
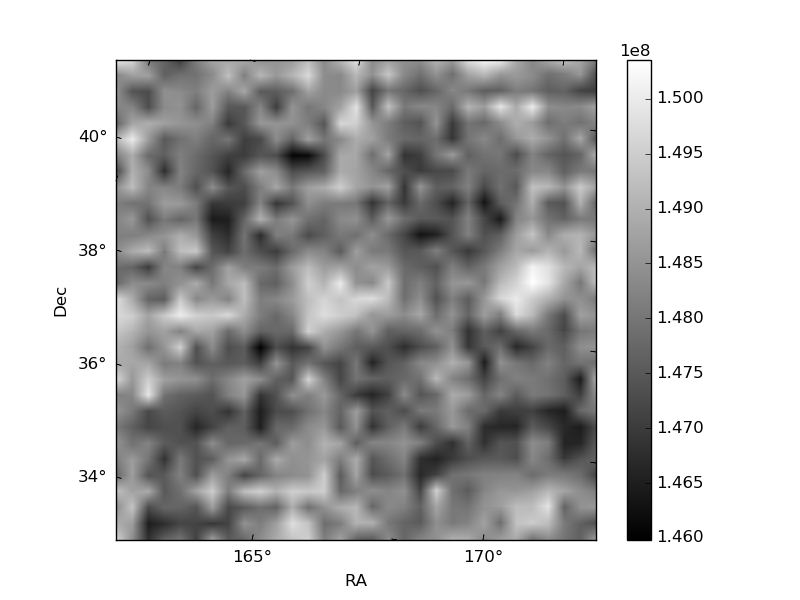
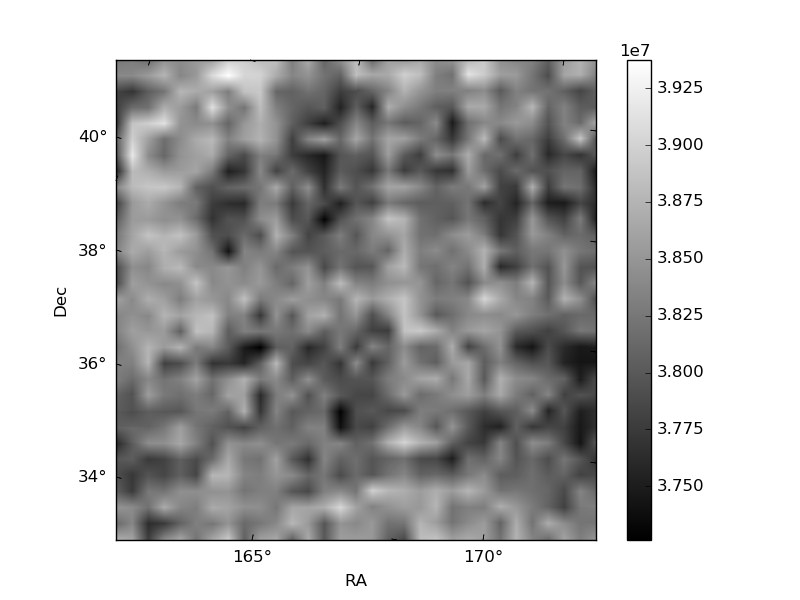
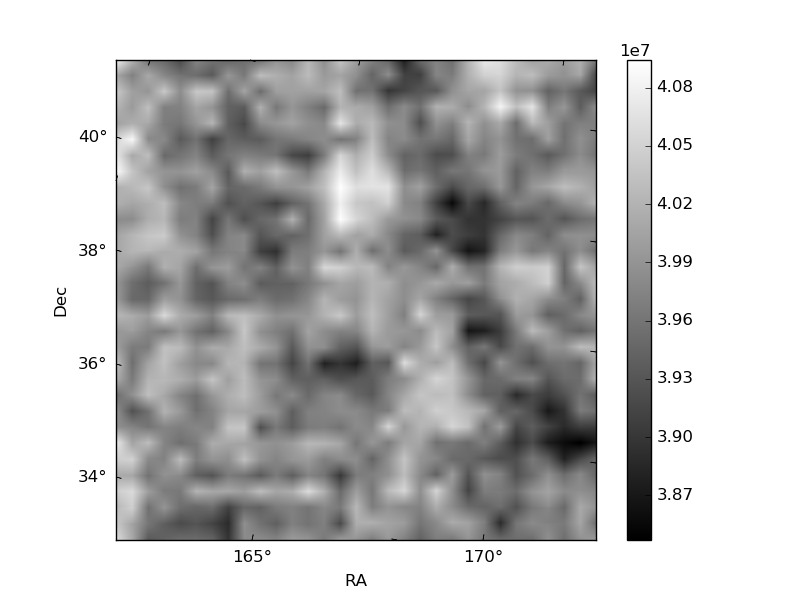
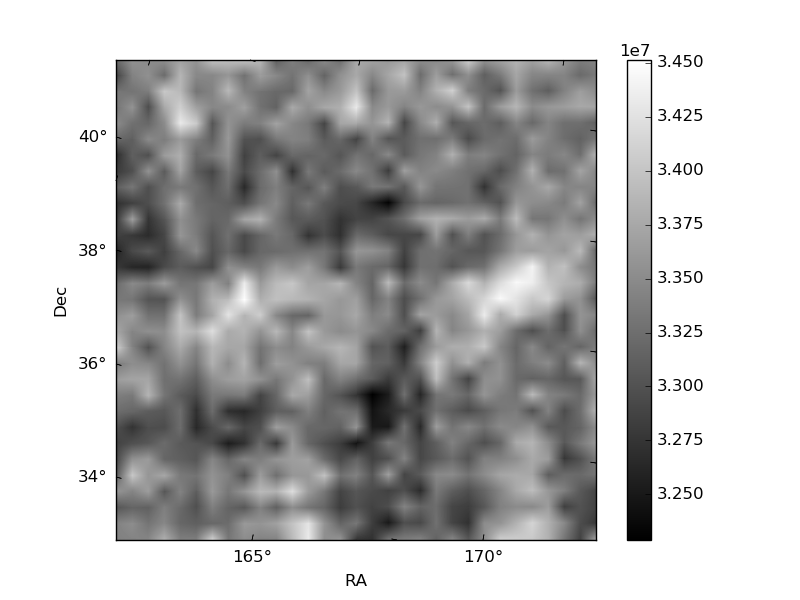
Histogram calculated using DETX and DETY for each event in the final _common_clean file
| Quadrant A | 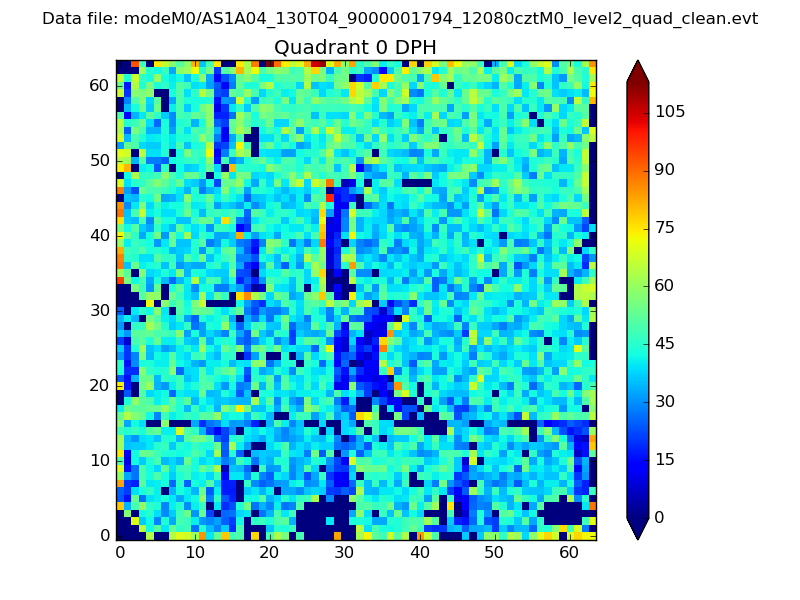 |
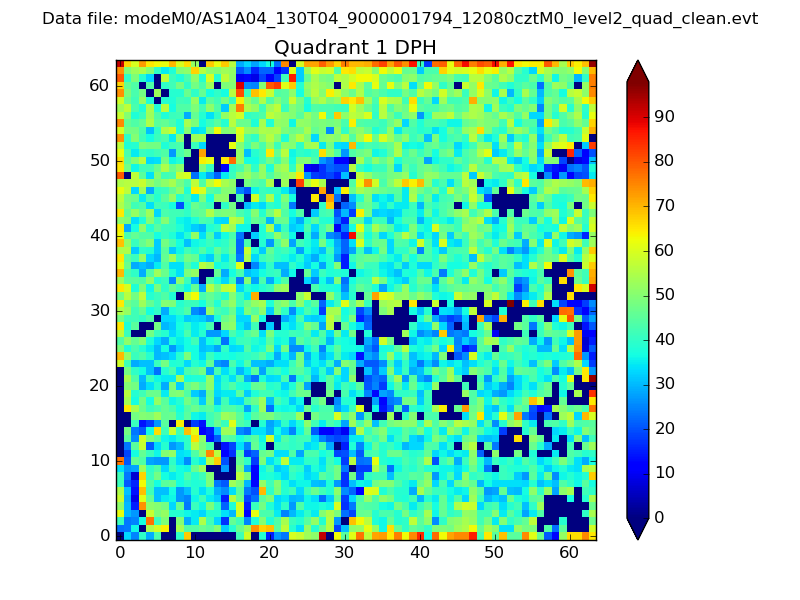 |
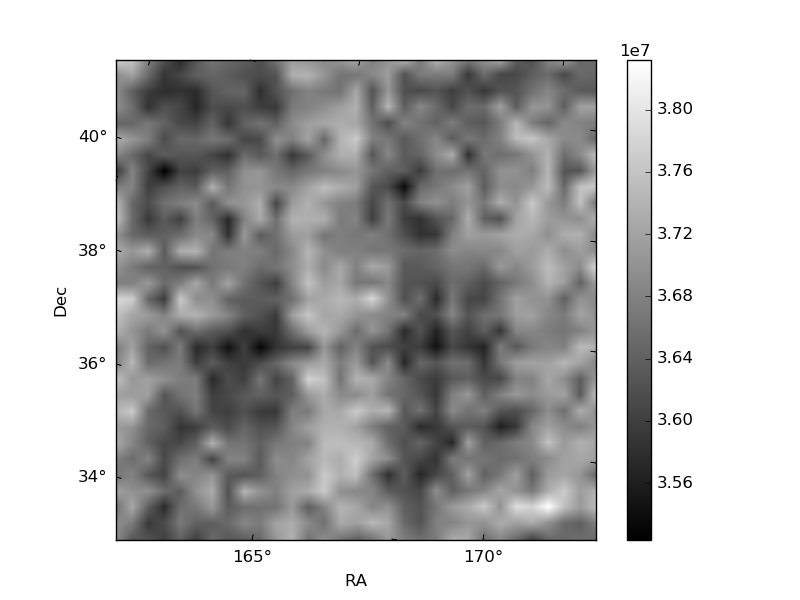
Quadrant B |
|---|---|---|---|
| Quadrant D | 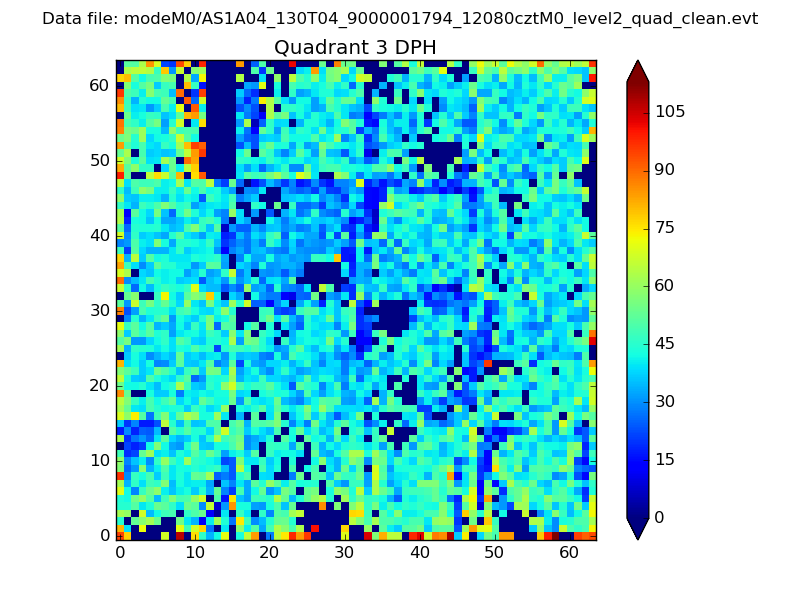 |
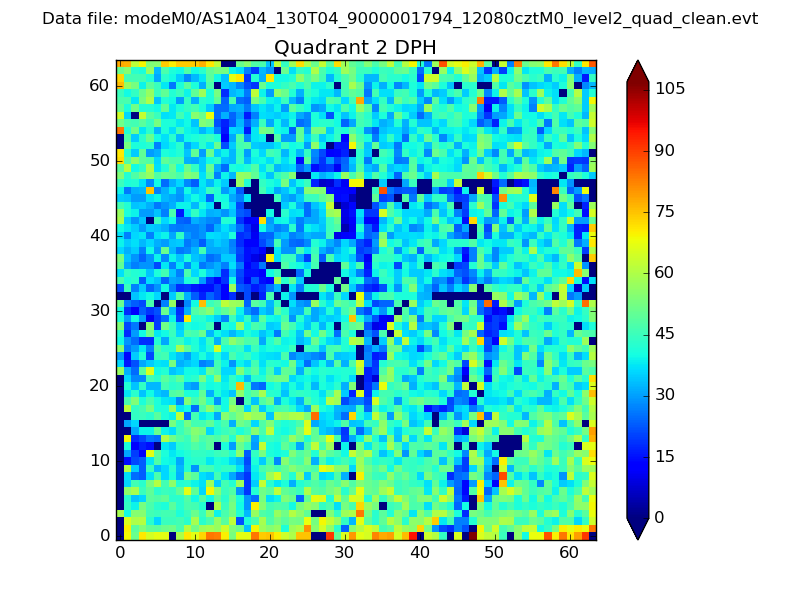 |
Quadrant C |
| Plot type | Count rate plots | Images |
|---|---|---|
| Comparison with Poisson distribution Blue bars denote a histogram of data divided into 1 sec bins. Red curve is a Poisson curve with rate = median count rate of data. |
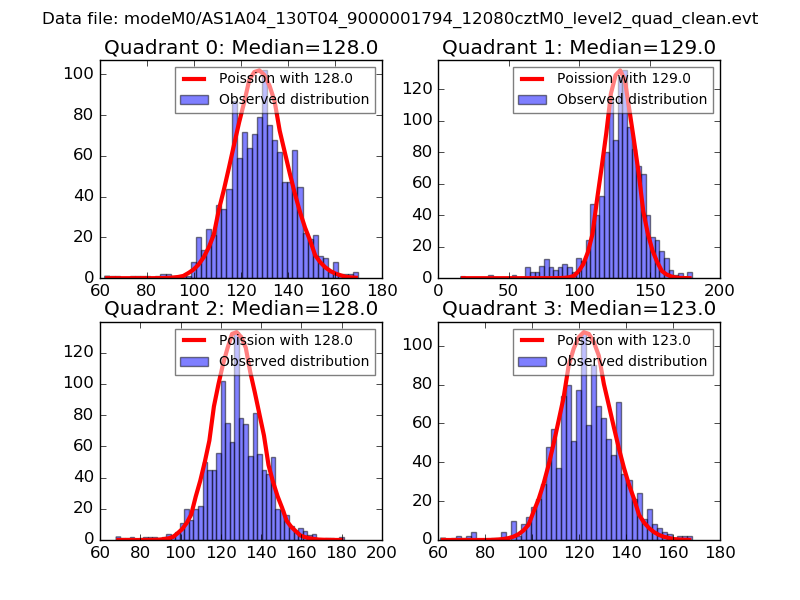 |
 |
| Quadrant-wise count rates Data is divided into 100 sec bins |
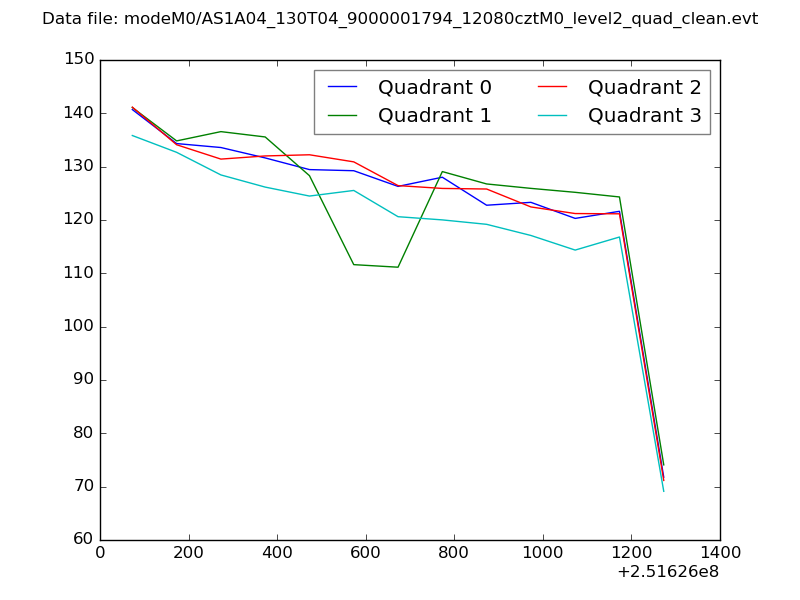 |
|
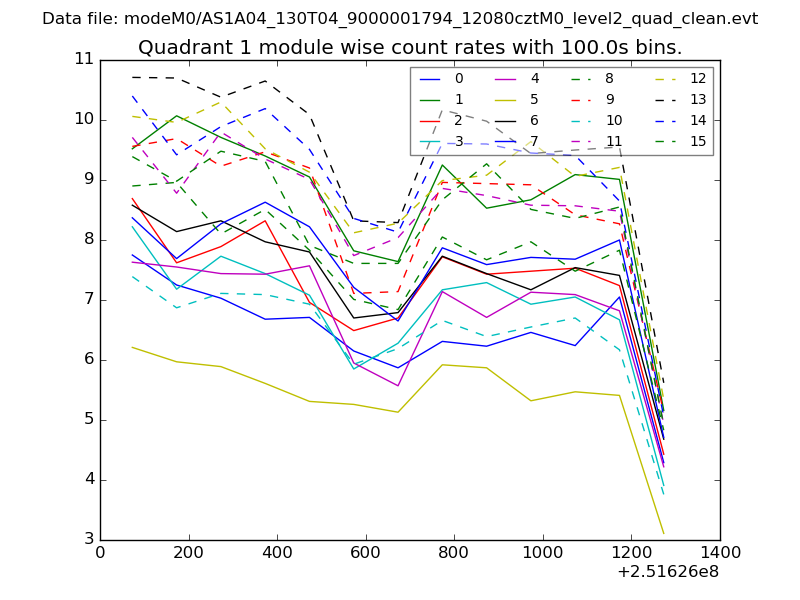
| Module-wise count rates for Quadrant A Data is divided into 100 sec bins |
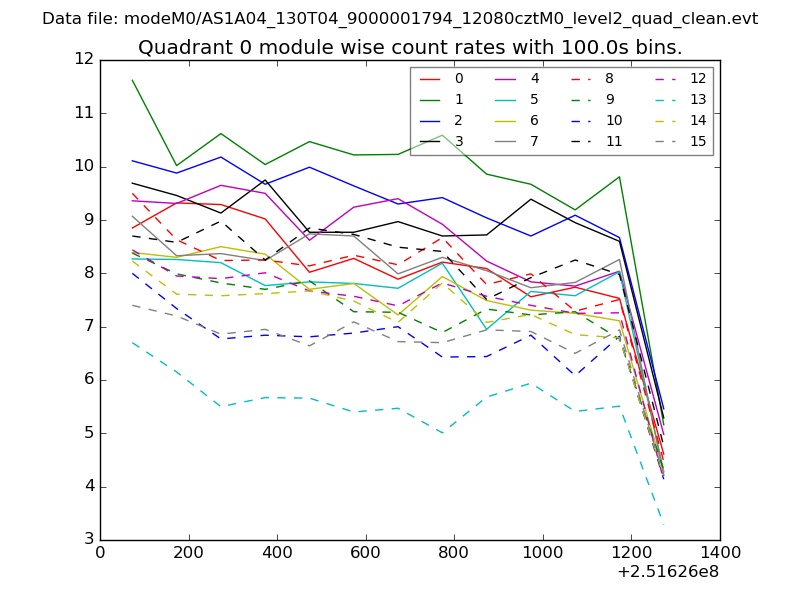 |
 |
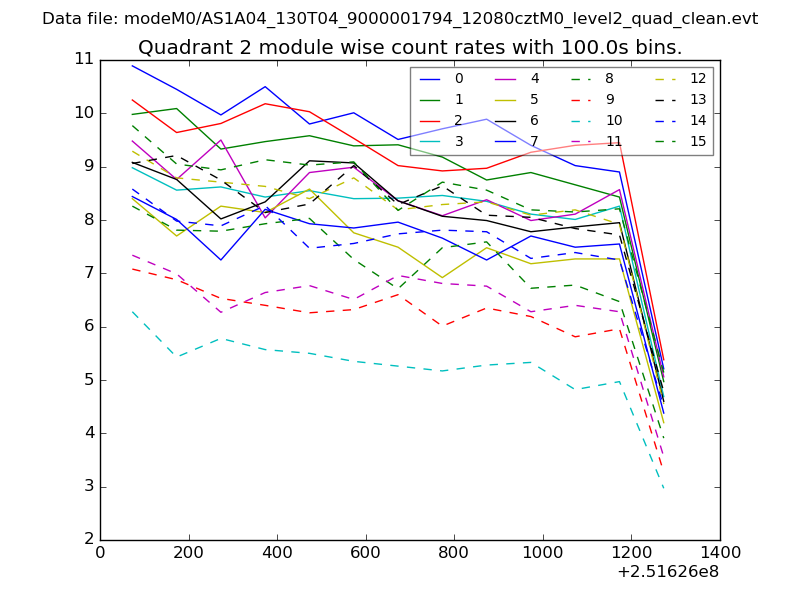
| Module-wise count rates for Quadrant B Data is divided into 100 sec bins |
 |
 |
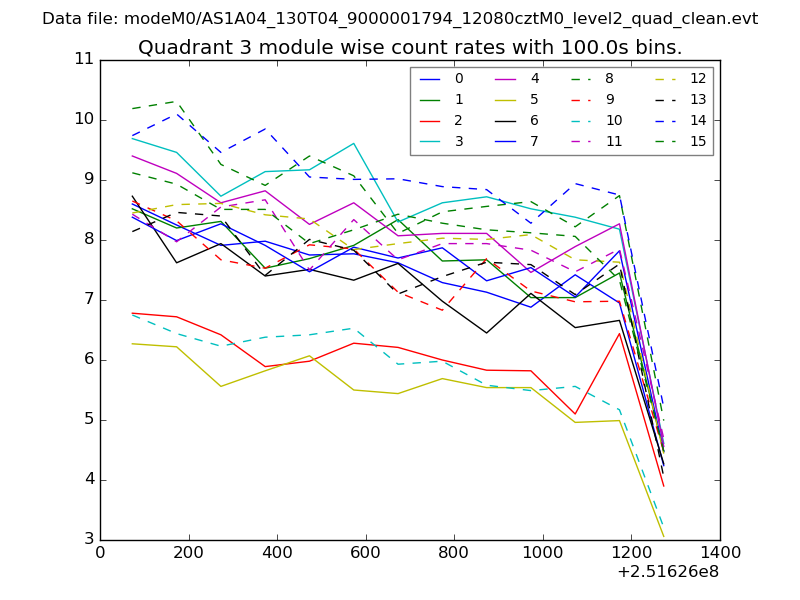
| Module-wise count rates for Quadrant C Data is divided into 100 sec bins |
 |
 |
| Module-wise count rates for Quadrant D Data is divided into 100 sec bins |
 |
 |
| Parameter | Plot |
|---|---|
| CZT HV Monitor | 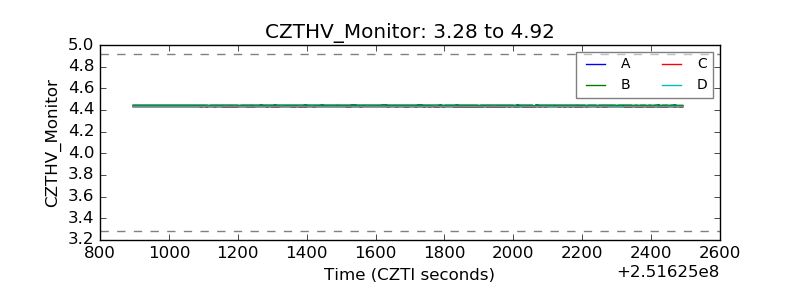 |
| D_VDD | 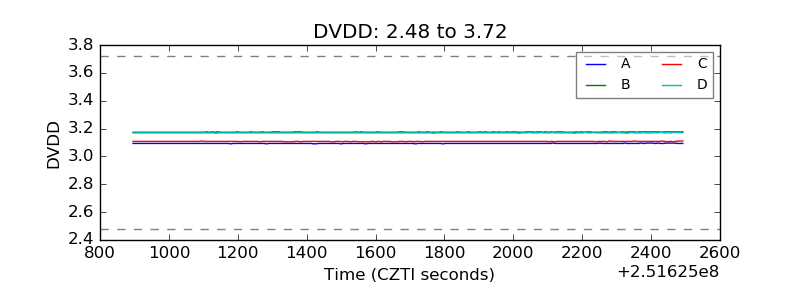 |
| Temperature 1 |  |
| Veto HV Monitor | 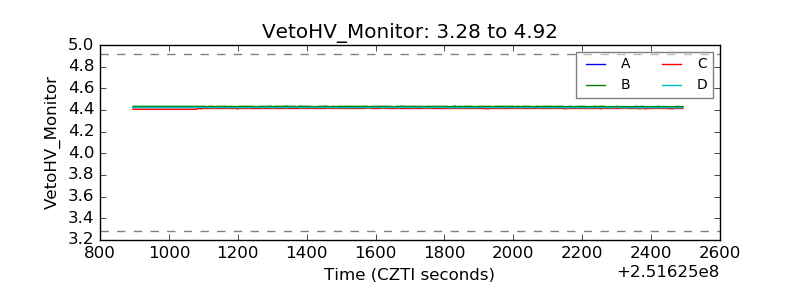 |
| Veto LLD |  |
| Alpha Counter | 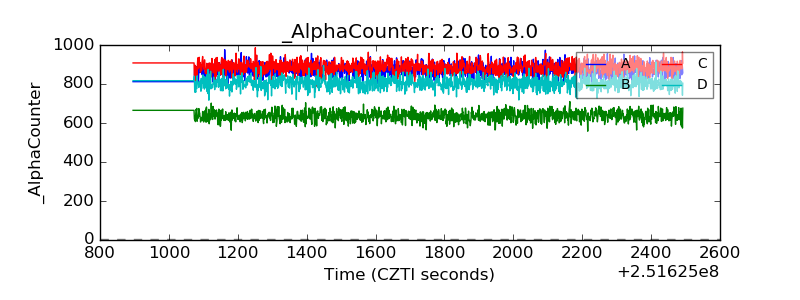 |
| _CPM_Rate | 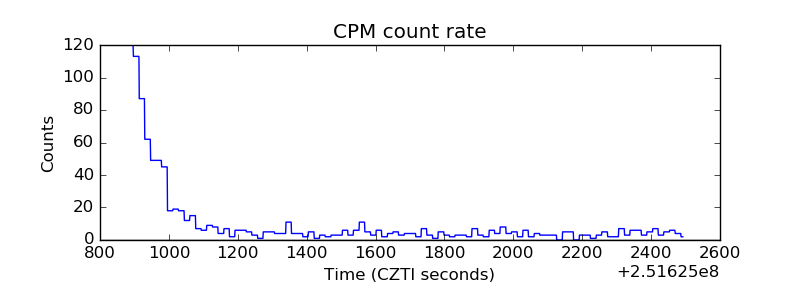 |
| CZT Counter | 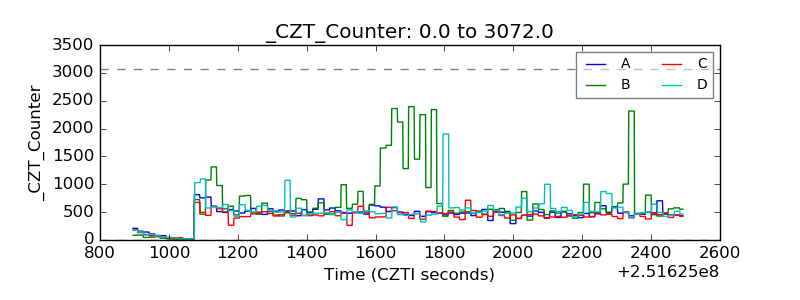 |
| +2.5 Volts monitor |  |
| +5 Volts monitor | 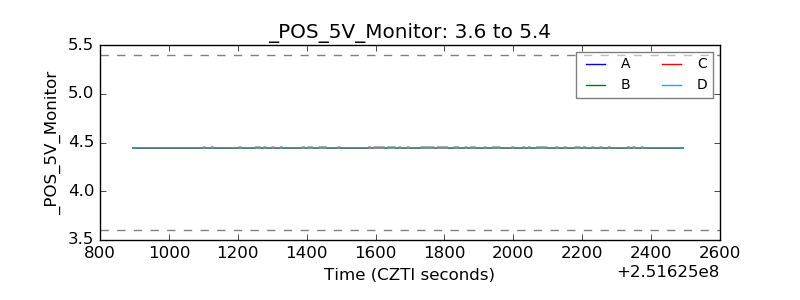 |
| _ROLL_ROT | 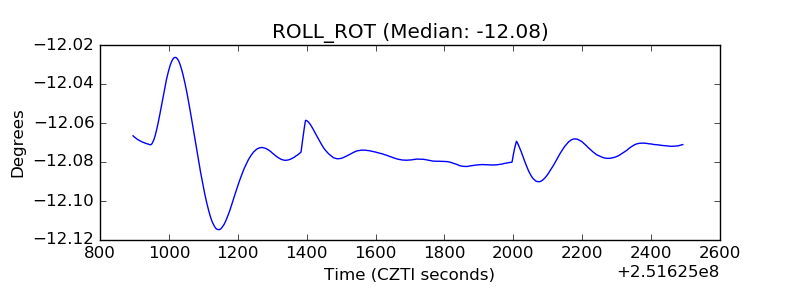 |
| _Roll_DEC | 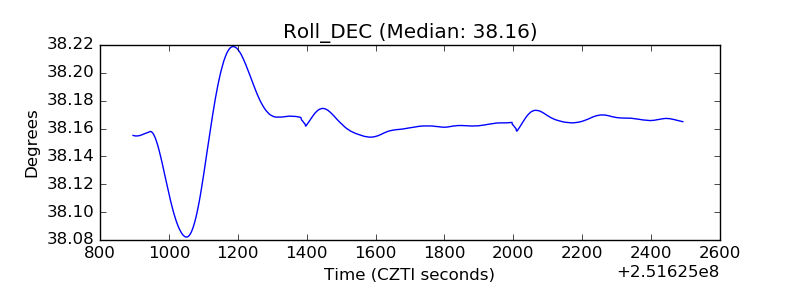 |
| _Roll_RA | 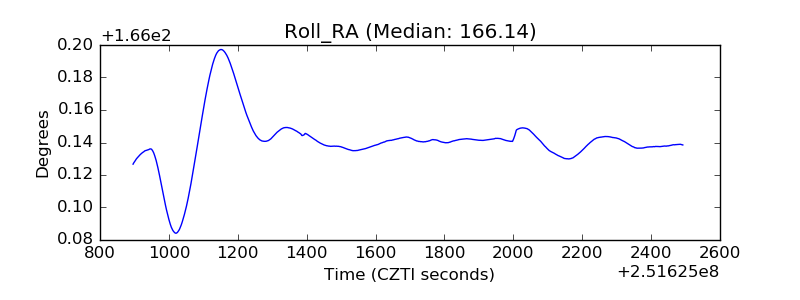 |
| Veto Counter | 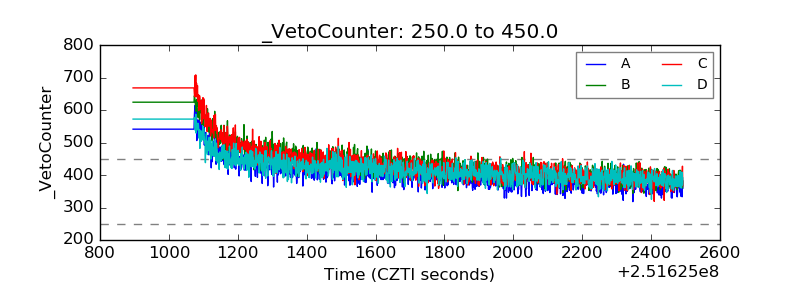 |