| Param | Original file | Final file |
|---|---|---|
| Filename | modeM0/AS1A04_130T04_9000001794_12081cztM0_level2.evt | modeM0/AS1A04_130T04_9000001794_12081cztM0_level2_quad_clean.evt |
| Size (bytes) | 524,917,440 | 83,018,880 |
| Size | 500.6 MB | 79.2 MB |
| Events in quadrant A | 3,375,942 | 522,226 |
| Events in quadrant B | 5,189,005 | 512,844 |
| Events in quadrant C | 3,015,699 | 522,630 |
| Events in quadrant D | 3,872,965 | 500,151 |
| Mode M0 | |||
|---|---|---|---|
| Quadrant | BADHDUFLAG | Total packets | Discarded packets |
| A | 0 | 14058 | 3 |
| B | 0 | 19572 | 2 |
| C | 0 | 13291 | 2 |
| D | 0 | 15576 | 2 |
| Mode SS | |||
|---|---|---|---|
| Quadrant | BADHDUFLAG | Total packets | Discarded packets |
| A | 0 | 134 | 0 |
| B | 0 | 134 | 0 |
| C | 0 | 134 | 0 |
| D | 0 | 134 | 0 |
| Mode M9 | |||
|---|---|---|---|
| Quadrant | BADHDUFLAG | Total packets | Discarded packets |
| A | 0 | 10 | 0 |
| B | 0 | 10 | 0 |
| C | 0 | 10 | 0 |
| D | 0 | 10 | 0 |
| Quadrant | Total seconds | Saturated seconds | Saturation percentage |
|---|---|---|---|
| A | 6533 | 88 | 1.347008% |
| B | 6533 | 672 | 10.286239% |
| C | 6533 | 40 | 0.612276% |
| D | 6534 | 102 | 1.561065% |
Noise dominated data is calculated using 1-second bins in cleaned event files. If a bin has >2000 counts, and if more than 50% of those come from <1% of pixels, then it is considered to be noise-dominated and hence unusable.
| Quadrant | # 1 sec bins | Bins with >0 counts | Bins with >2000 counts | High rate bins dominated by noise | Noise dominated (total time) | Noise dominated (detector-on time) | Marked lightcurve |
|---|---|---|---|---|---|---|---|
| A | 7559 | 6534 | 4 | 4 | 0.05% | 0.06% | 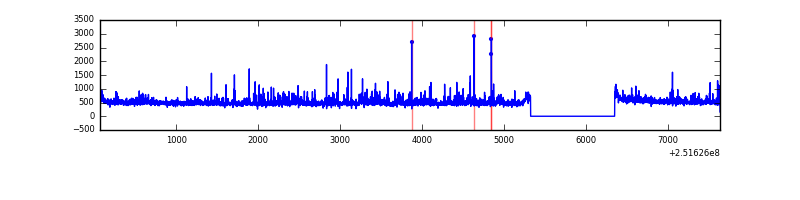 |
| B | 7559 | 6534 | 432 | 432 | 5.72% | 6.61% | 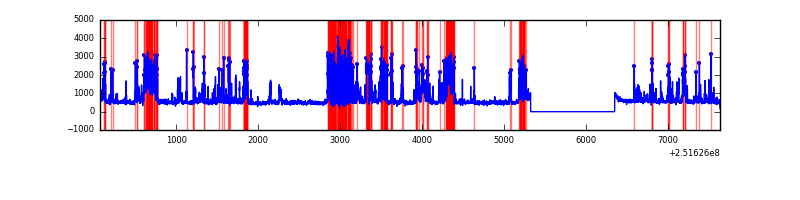 |
| C | 7559 | 6534 | 0 | 0 | 0.00% | 0.00% | 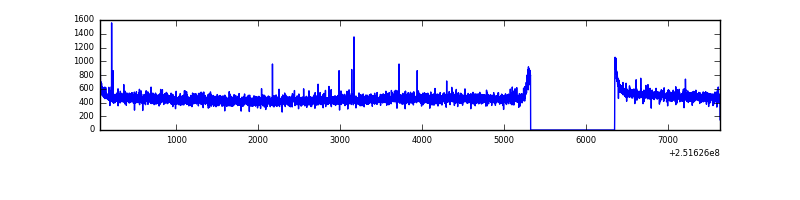 |
| D | 7560 | 6535 | 28 | 28 | 0.37% | 0.43% | 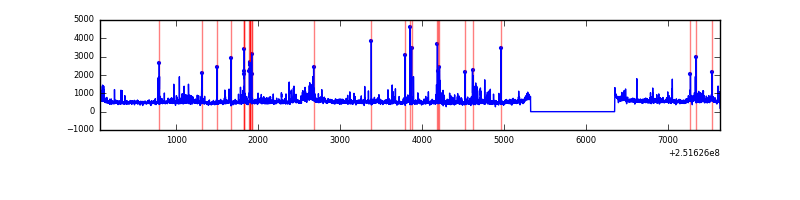 |
Top three noisy pixels from each quadrant. If the there are fewer than three noisy pixels in the level2.evt file, extra rows are filled as -1
| Pixel properties | Quadrant properties | ||||||
|---|---|---|---|---|---|---|---|
| Quadrant | DetID | PixID | Counts | Sigma | Mean | Median | Sigma |
| A | 1 | 162 | 113727 | 690.01 | 797 | 779 | 163.7 |
| A | 1 | 178 | 55753 | 335.84 | 797 | 779 | 163.7 |
| A | 1 | 161 | 49772 | 299.3 | 797 | 779 | 163.7 |
| B | 4 | 239 | 1988288 | 13612.19 | 764 | 745 | 146.0 |
| B | 15 | 204 | 115386 | 785.15 | 764 | 745 | 146.0 |
| B | 11 | 51 | 42389 | 285.21 | 764 | 745 | 146.0 |
| C | 8 | 208 | 12530 | 65.66 | 768 | 771 | 179.1 |
| C | 13 | 61 | 5579 | 26.85 | 768 | 771 | 179.1 |
| C | 14 | 234 | 5043 | 23.85 | 768 | 771 | 179.1 |
| D | 8 | 195 | 246061 | 1316.12 | 768 | 747 | 186.4 |
| D | 10 | 50 | 196478 | 1050.11 | 768 | 747 | 186.4 |
| D | 5 | 222 | 152856 | 816.07 | 768 | 747 | 186.4 |
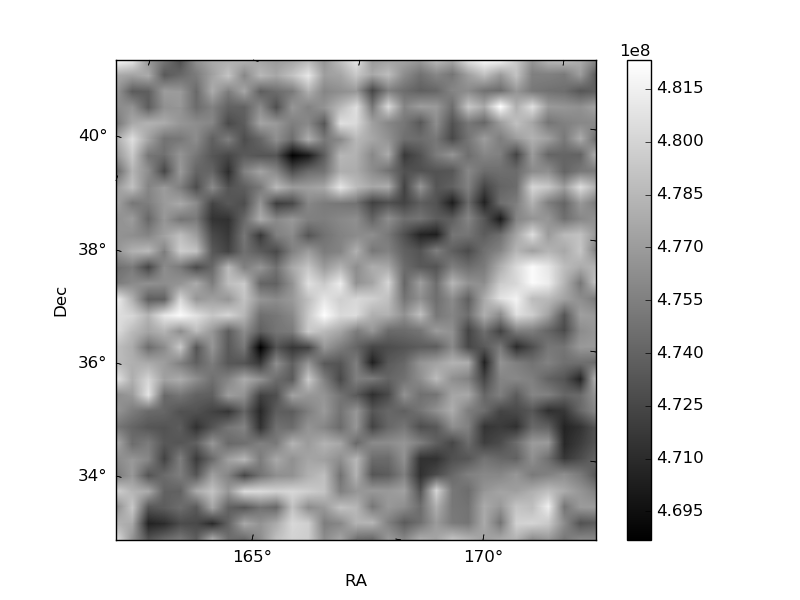
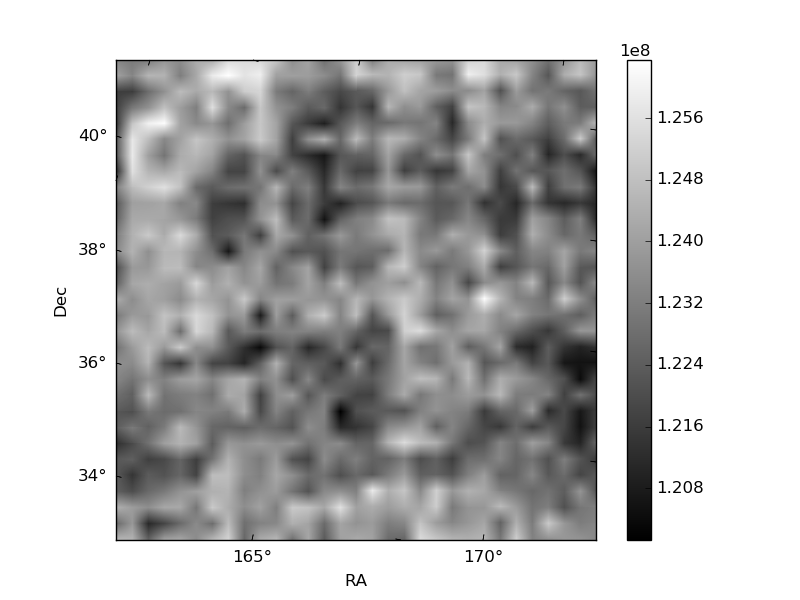
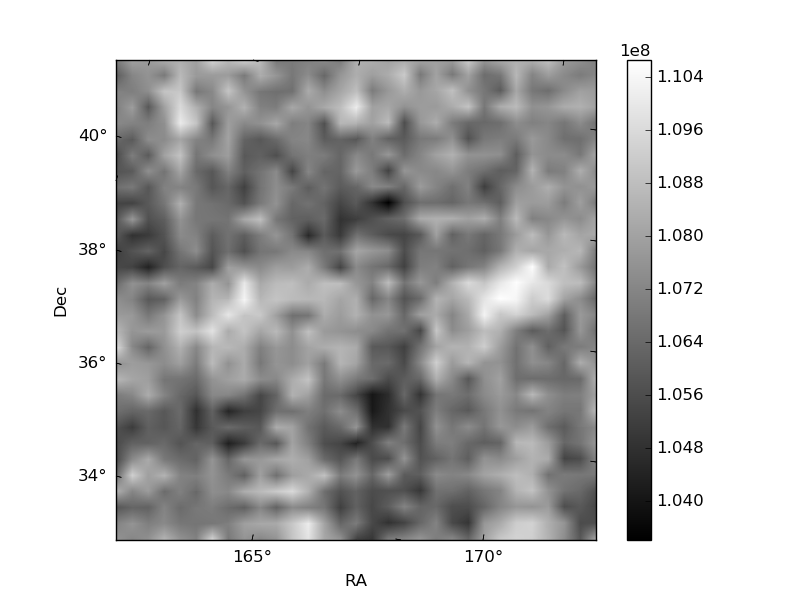
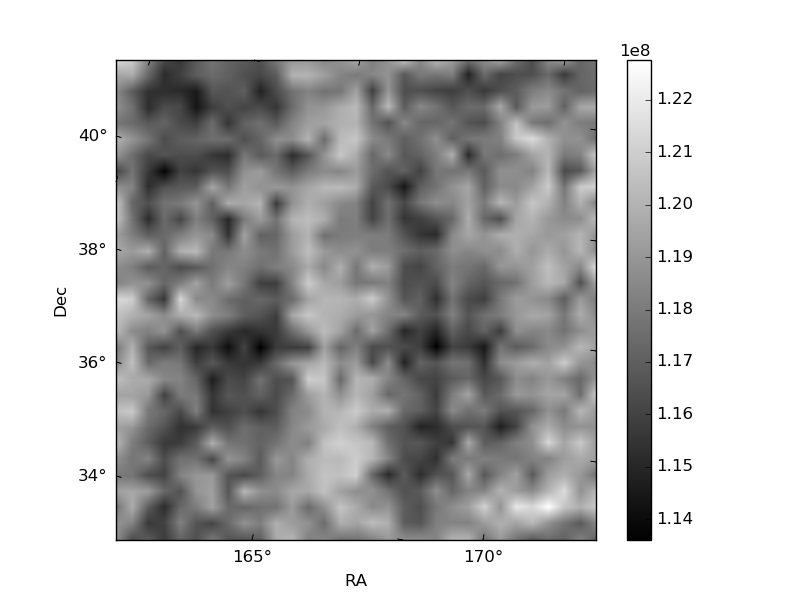
Histogram calculated using DETX and DETY for each event in the final _common_clean file
| Quadrant A | 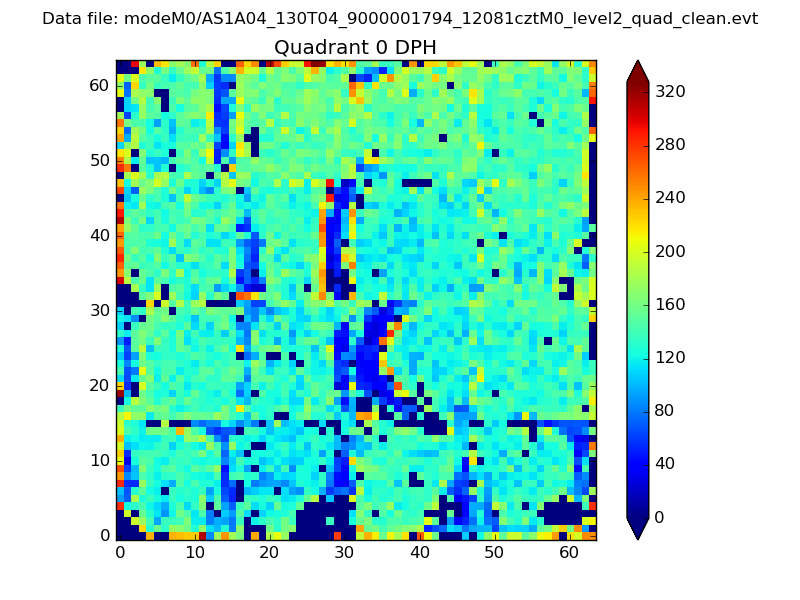 |
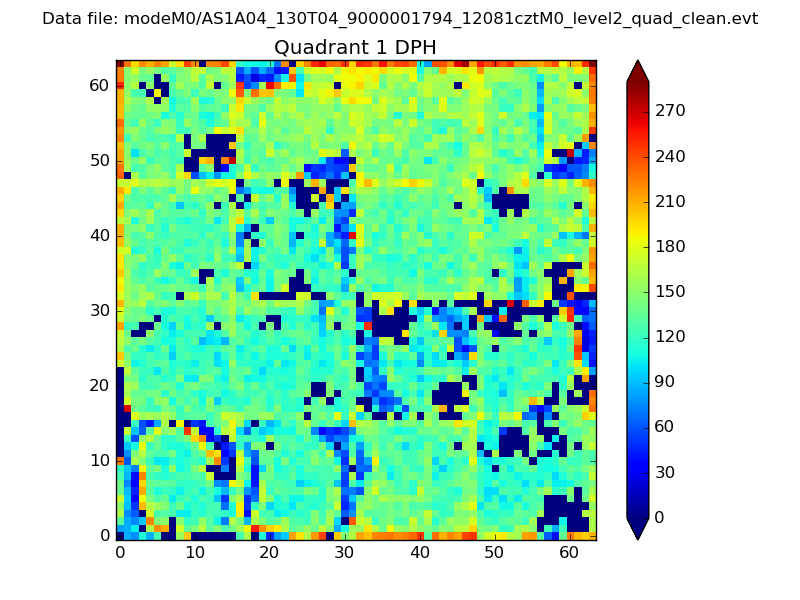 |
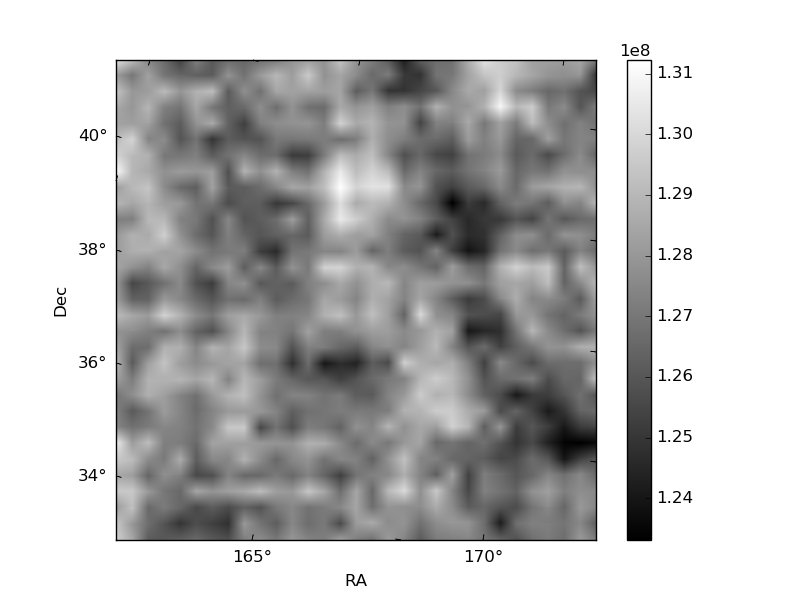
Quadrant B |
|---|---|---|---|
| Quadrant D | 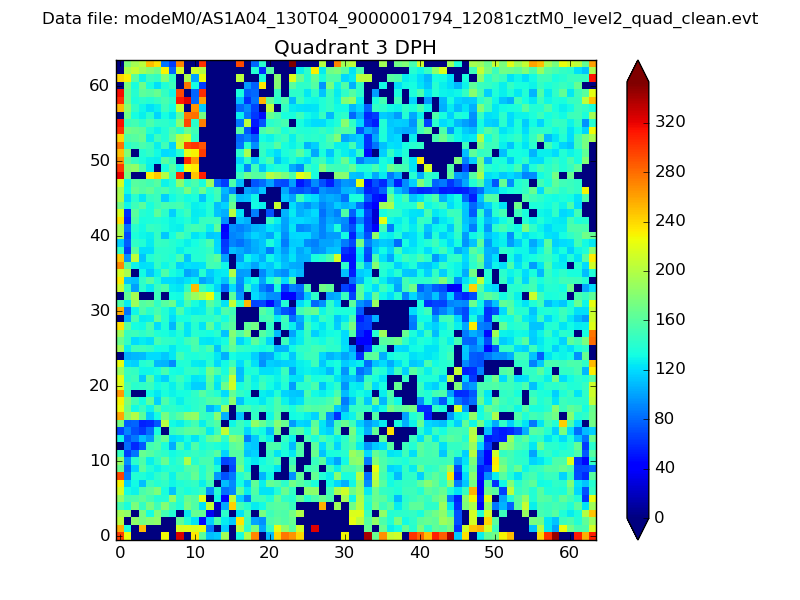 |
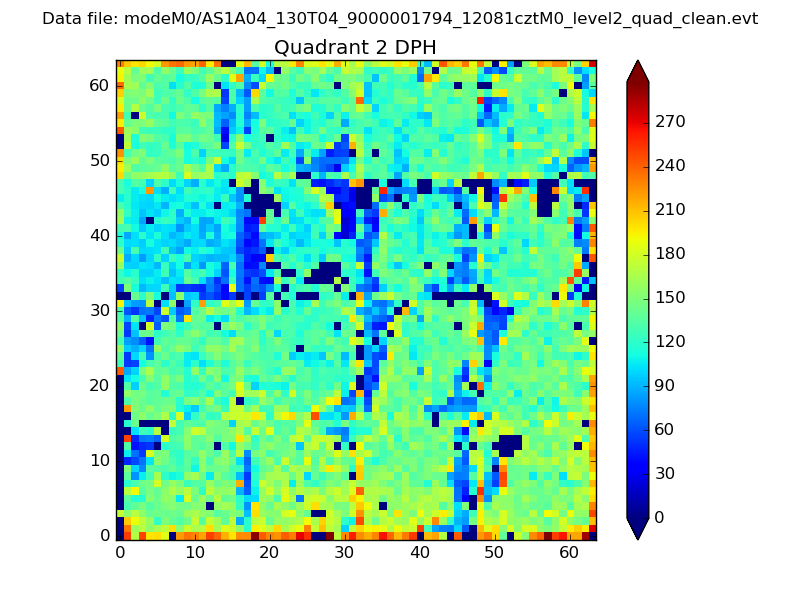 |
Quadrant C |
| Plot type | Count rate plots | Images |
|---|---|---|
| Comparison with Poisson distribution Blue bars denote a histogram of data divided into 1 sec bins. Red curve is a Poisson curve with rate = median count rate of data. |
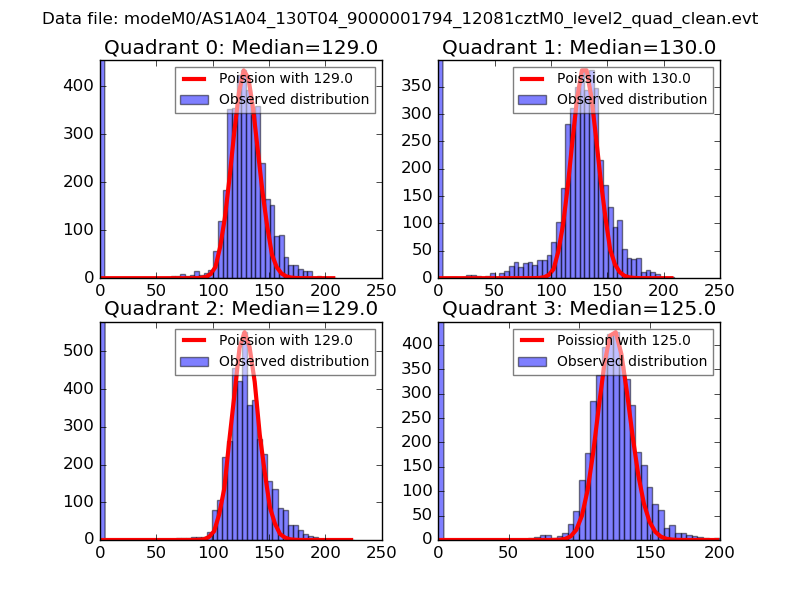 |
 |
| Quadrant-wise count rates Data is divided into 100 sec bins |
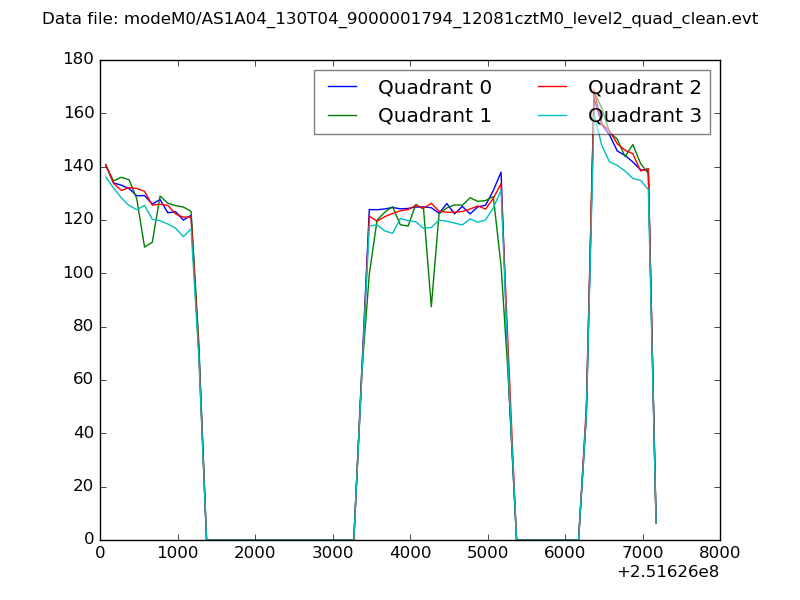 |
|
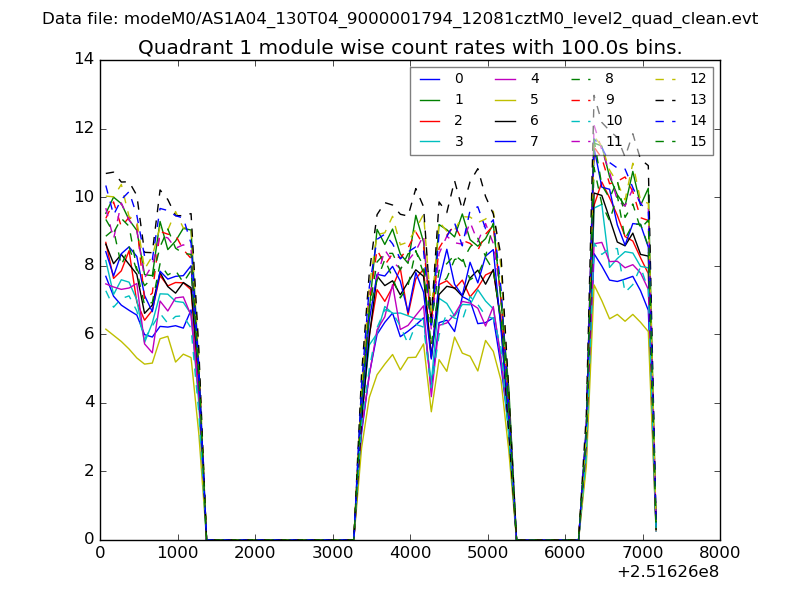
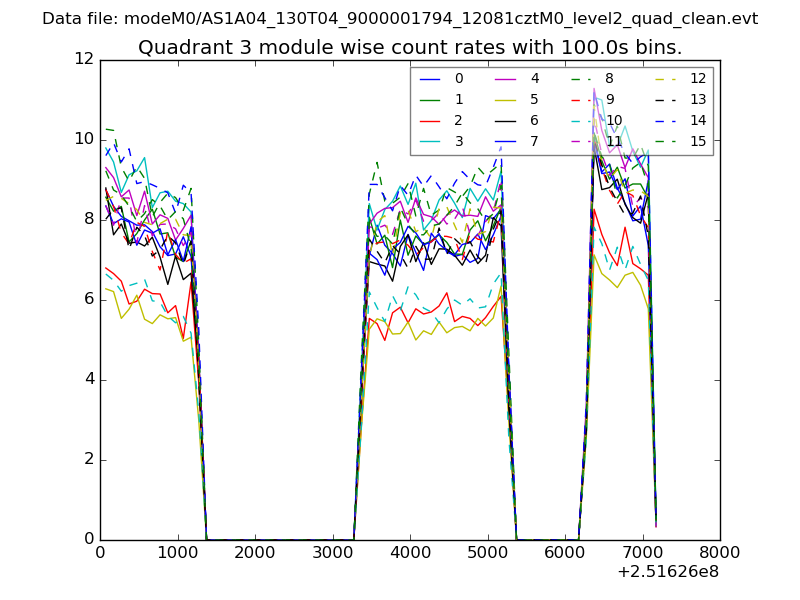
| Module-wise count rates for Quadrant A Data is divided into 100 sec bins |
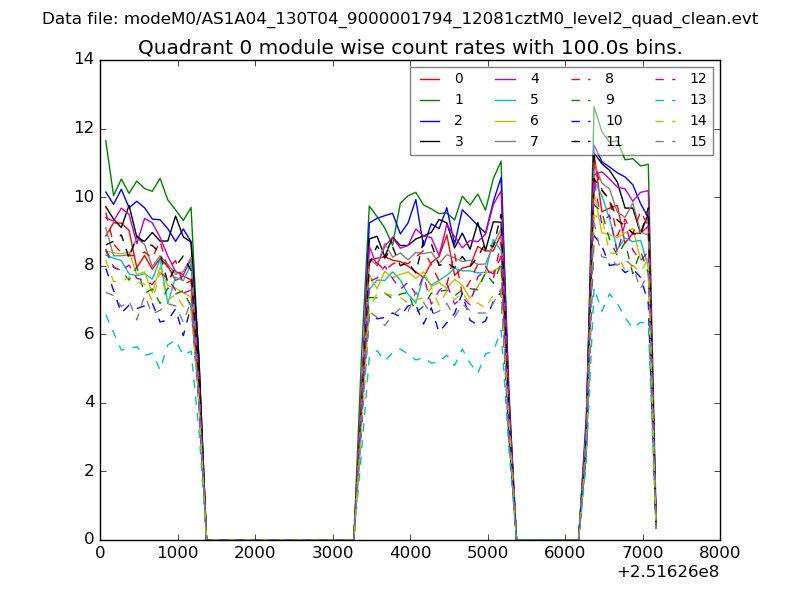 |
 |
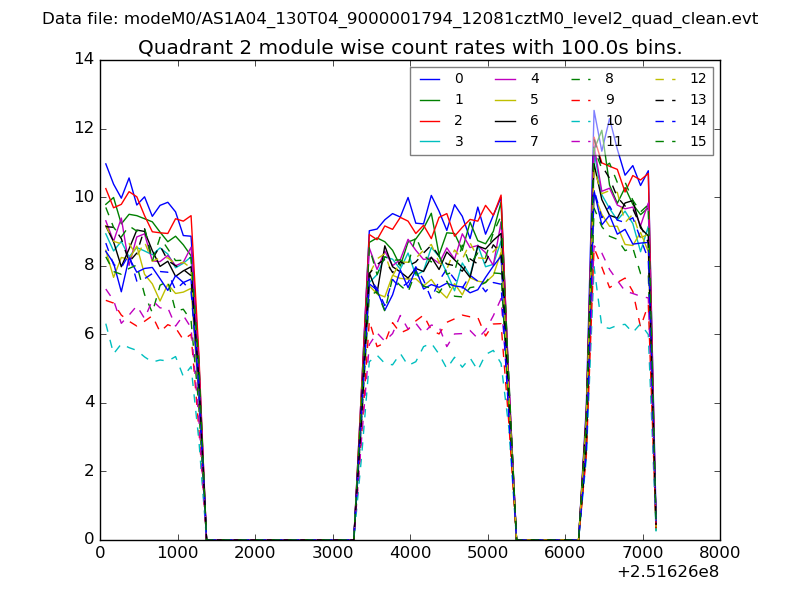
| Module-wise count rates for Quadrant B Data is divided into 100 sec bins |
 |
 |
| Module-wise count rates for Quadrant C Data is divided into 100 sec bins |
 |
 |
| Module-wise count rates for Quadrant D Data is divided into 100 sec bins |
 |
 |
| Parameter | Plot |
|---|---|
| CZT HV Monitor | 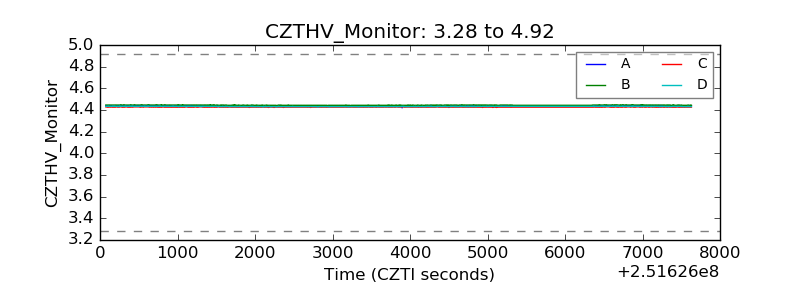 |
| D_VDD | 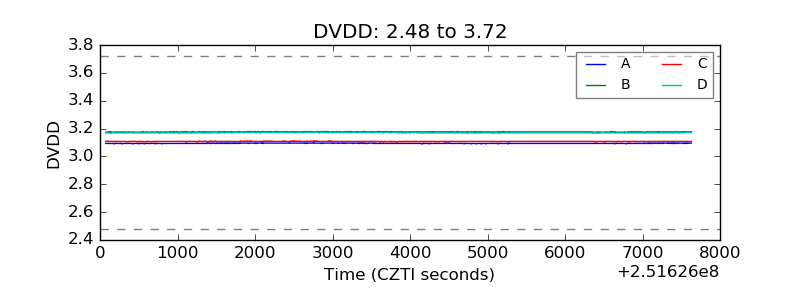 |
| Temperature 1 | 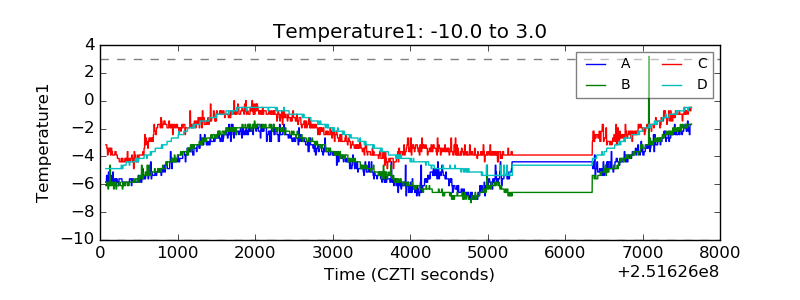 |
| Veto HV Monitor |  |
| Veto LLD |  |
| Alpha Counter | 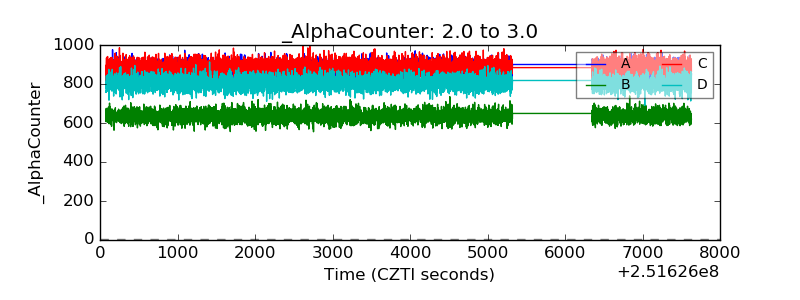 |
| _CPM_Rate | 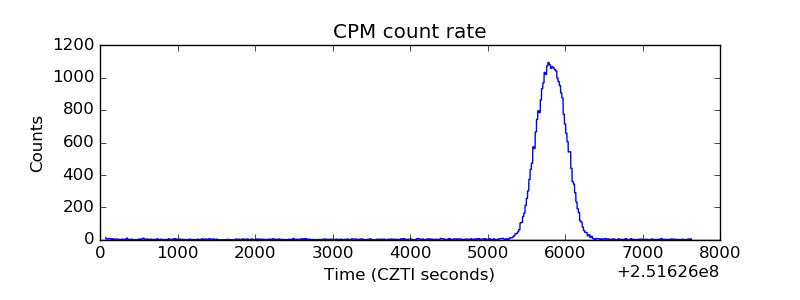 |
| CZT Counter | 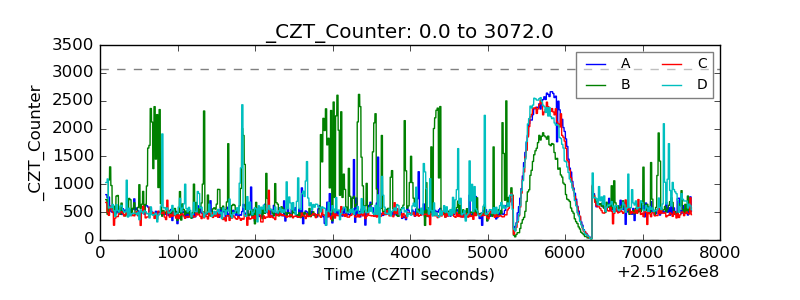 |
| +2.5 Volts monitor |  |
| +5 Volts monitor |  |
| _ROLL_ROT | 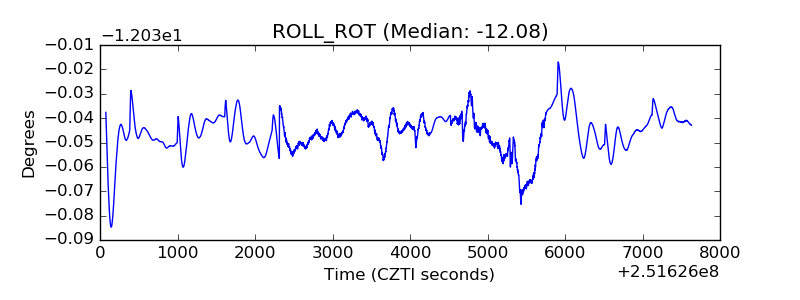 |
| _Roll_DEC | 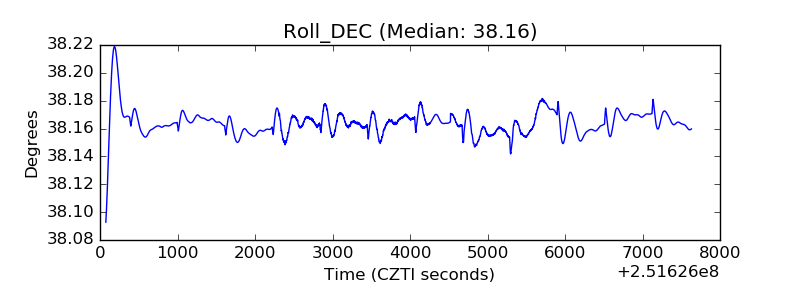 |
| _Roll_RA | 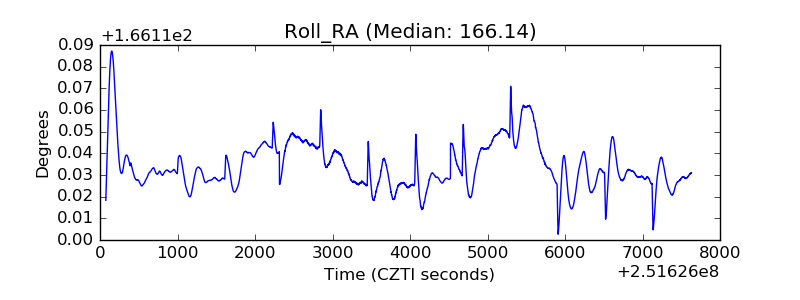 |
| Veto Counter | 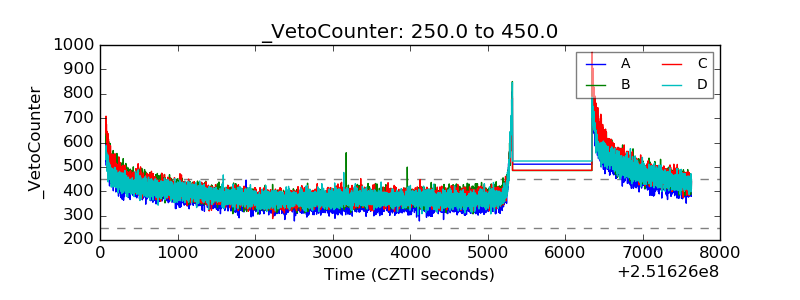 |