| Param | Original file | Final file |
|---|---|---|
| Filename | modeM0/AS1A04_130T04_9000001794_12084cztM0_level2.evt | modeM0/AS1A04_130T04_9000001794_12084cztM0_level2_quad_clean.evt |
| Size (bytes) | 638,559,360 | 61,427,520 |
| Size | 609.0 MB | 58.6 MB |
| Events in quadrant A | 6,095,258 | 324,321 |
| Events in quadrant B | 5,179,696 | 363,064 |
| Events in quadrant C | 3,199,715 | 374,190 |
| Events in quadrant D | 4,436,045 | 355,988 |
| Mode M0 | |||
|---|---|---|---|
| Quadrant | BADHDUFLAG | Total packets | Discarded packets |
| A | 0 | 22432 | 2 |
| B | 0 | 19649 | 1 |
| C | 0 | 13465 | 1 |
| D | 0 | 17594 | 1 |
| Mode SS | |||
|---|---|---|---|
| Quadrant | BADHDUFLAG | Total packets | Discarded packets |
| A | 0 | 130 | 0 |
| B | 0 | 130 | 0 |
| C | 0 | 130 | 0 |
| D | 0 | 130 | 0 |
| Mode M9 | |||
|---|---|---|---|
| Quadrant | BADHDUFLAG | Total packets | Discarded packets |
| A | 0 | 12 | 0 |
| B | 0 | 12 | 0 |
| C | 0 | 12 | 0 |
| D | 0 | 12 | 0 |
| Quadrant | Total seconds | Saturated seconds | Saturation percentage |
|---|---|---|---|
| A | 6323 | 1166 | 18.440614% |
| B | 6323 | 600 | 9.489167% |
| C | 6323 | 74 | 1.170331% |
| D | 6323 | 252 | 3.985450% |
Noise dominated data is calculated using 1-second bins in cleaned event files. If a bin has >2000 counts, and if more than 50% of those come from <1% of pixels, then it is considered to be noise-dominated and hence unusable.
| Quadrant | # 1 sec bins | Bins with >0 counts | Bins with >2000 counts | High rate bins dominated by noise | Noise dominated (total time) | Noise dominated (detector-on time) | Marked lightcurve |
|---|---|---|---|---|---|---|---|
| A | 7554 | 6324 | 856 | 856 | 11.33% | 13.54% |  |
| B | 7554 | 6324 | 321 | 321 | 4.25% | 5.08% | 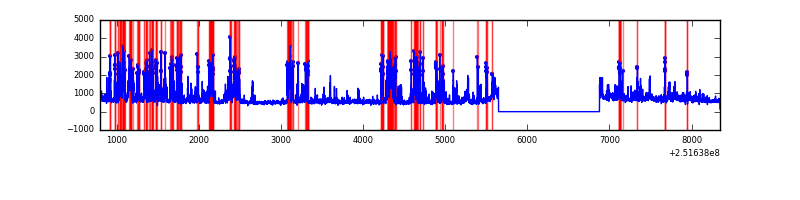 |
| C | 7554 | 6324 | 0 | 0 | 0.00% | 0.00% | 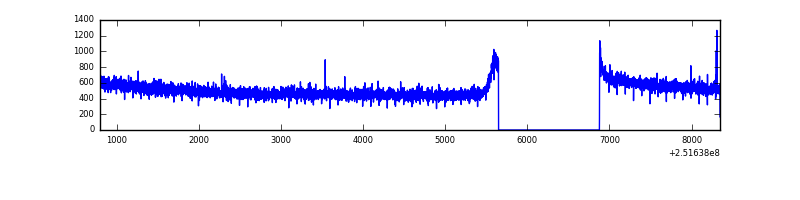 |
| D | 7554 | 6324 | 137 | 137 | 1.81% | 2.17% | 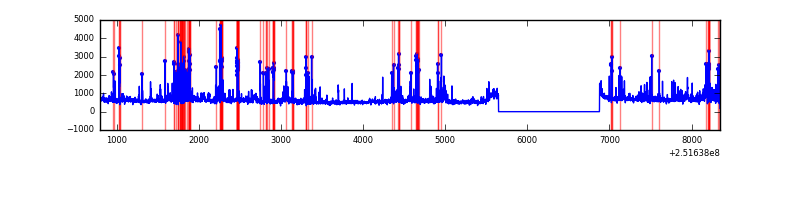 |
Top three noisy pixels from each quadrant. If the there are fewer than three noisy pixels in the level2.evt file, extra rows are filled as -1
| Pixel properties | Quadrant properties | ||||||
|---|---|---|---|---|---|---|---|
| Quadrant | DetID | PixID | Counts | Sigma | Mean | Median | Sigma |
| A | 13 | 248 | 1935659 | 12430.55 | 776 | 762 | 155.7 |
| A | 14 | 63 | 717557 | 4604.98 | 776 | 762 | 155.7 |
| A | 13 | 251 | 149068 | 952.78 | 776 | 762 | 155.7 |
| B | 4 | 239 | 1671507 | 10973.31 | 815 | 797 | 152.3 |
| B | 15 | 204 | 193534 | 1265.91 | 815 | 797 | 152.3 |
| B | 11 | 51 | 102927 | 670.79 | 815 | 797 | 152.3 |
| C | 13 | 61 | 6009 | 27.51 | 819 | 822 | 188.5 |
| C | 0 | 207 | 3412 | 13.74 | 819 | 822 | 188.5 |
| C | 3 | 202 | 2166 | 7.13 | 819 | 822 | 188.5 |
| D | 1 | 52 | 690762 | 3548.38 | 809 | 787 | 194.4 |
| D | 8 | 195 | 432311 | 2219.23 | 809 | 787 | 194.4 |
| D | 13 | 104 | 84670 | 431.39 | 809 | 787 | 194.4 |
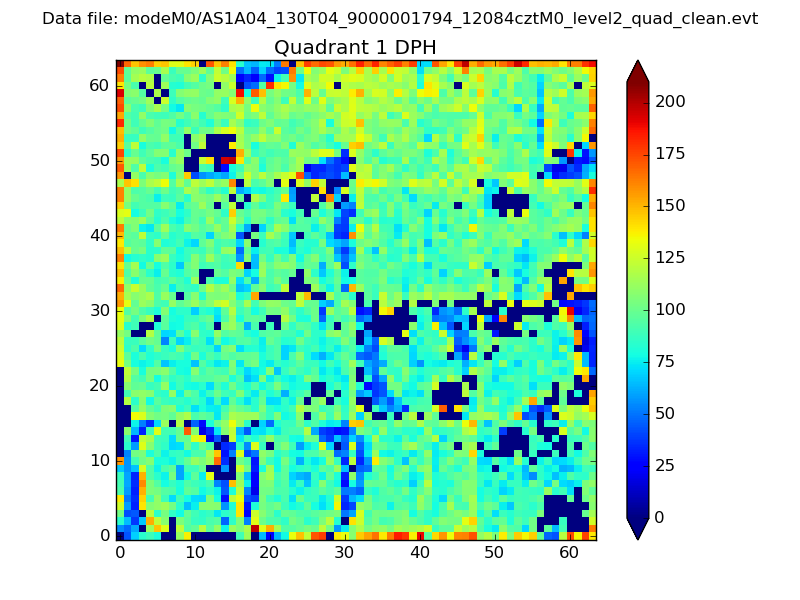
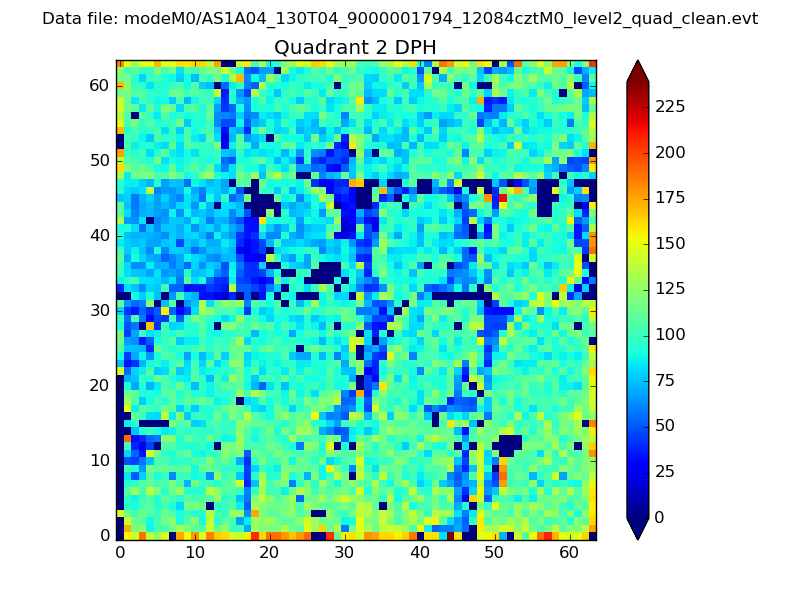
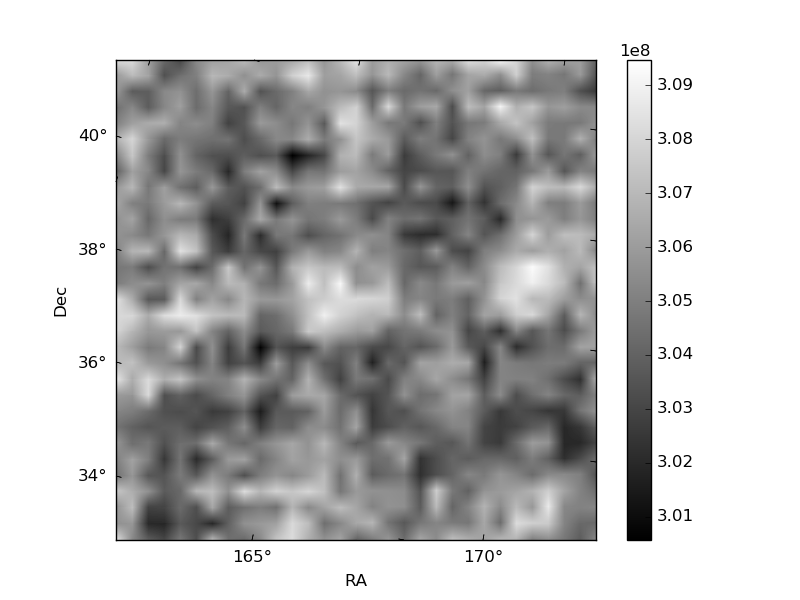
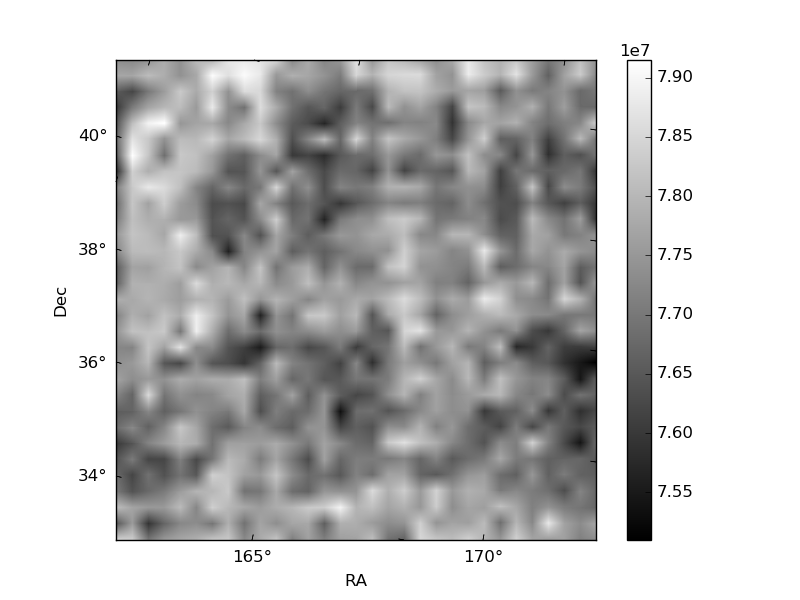
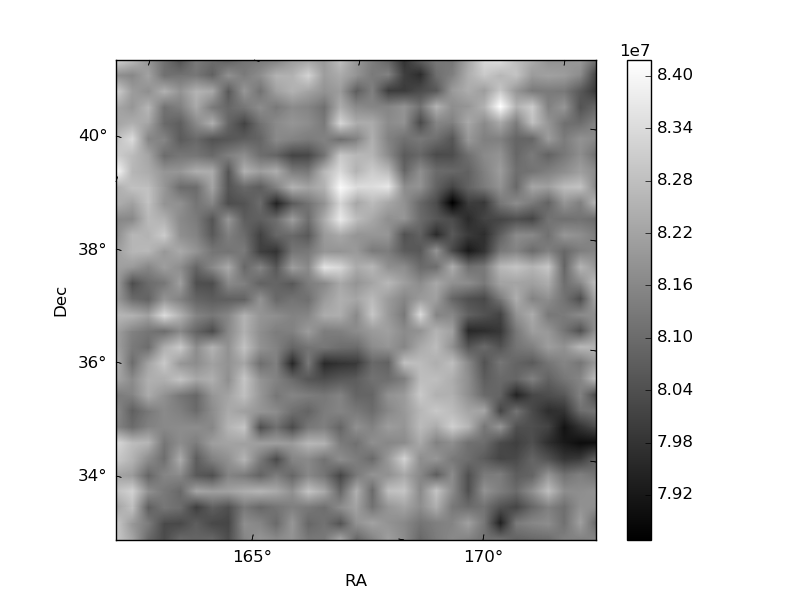
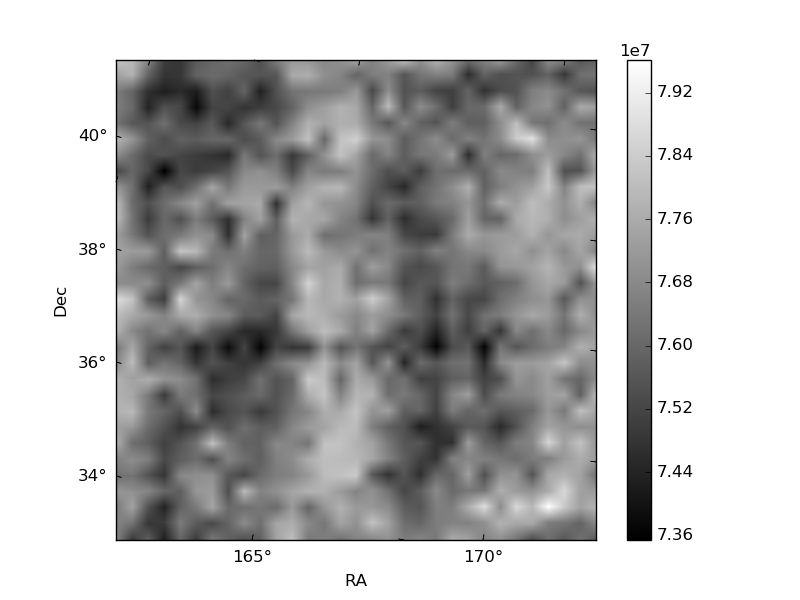
Histogram calculated using DETX and DETY for each event in the final _common_clean file
| Quadrant A | 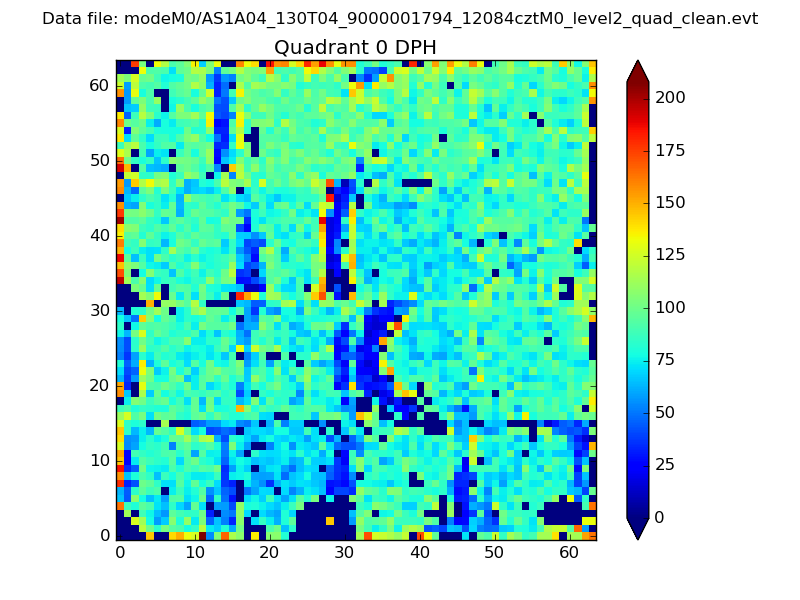 |
 |
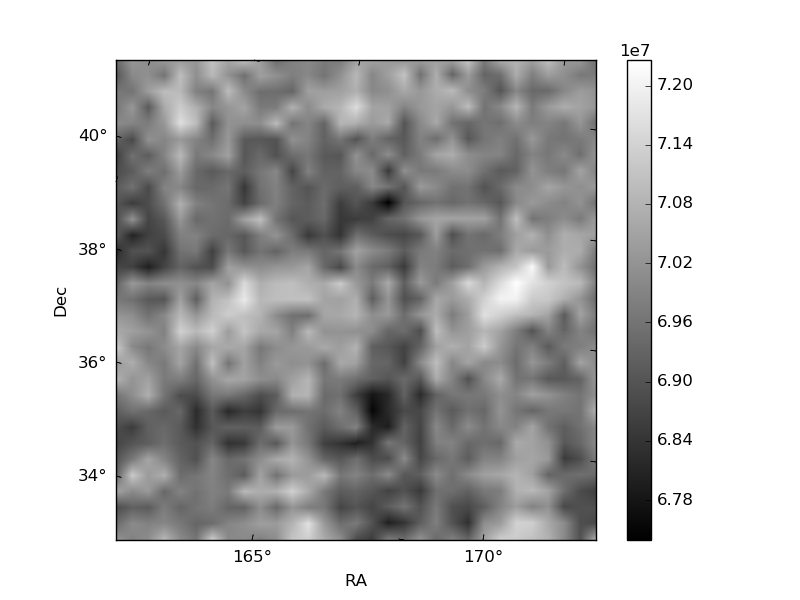
Quadrant B |
|---|---|---|---|
| Quadrant D | 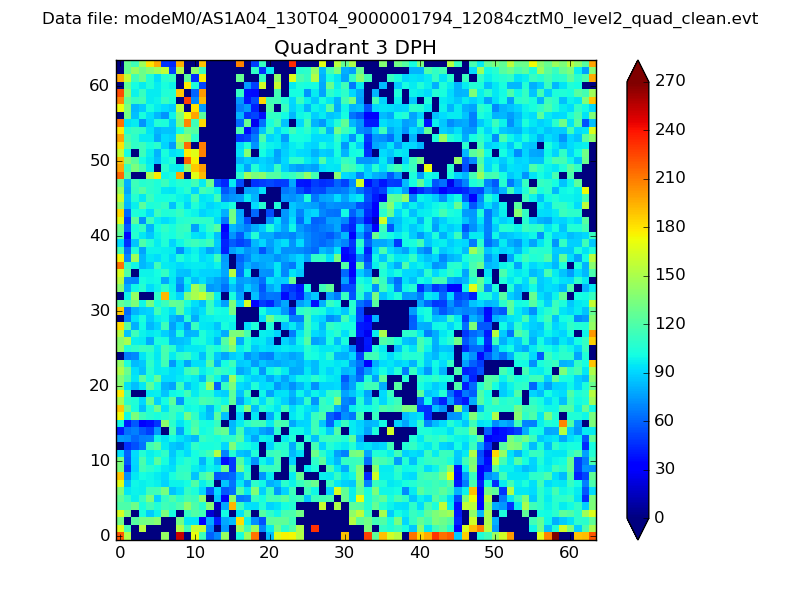 |
 |
Quadrant C |
| Plot type | Count rate plots | Images |
|---|---|---|
| Comparison with Poisson distribution Blue bars denote a histogram of data divided into 1 sec bins. Red curve is a Poisson curve with rate = median count rate of data. |
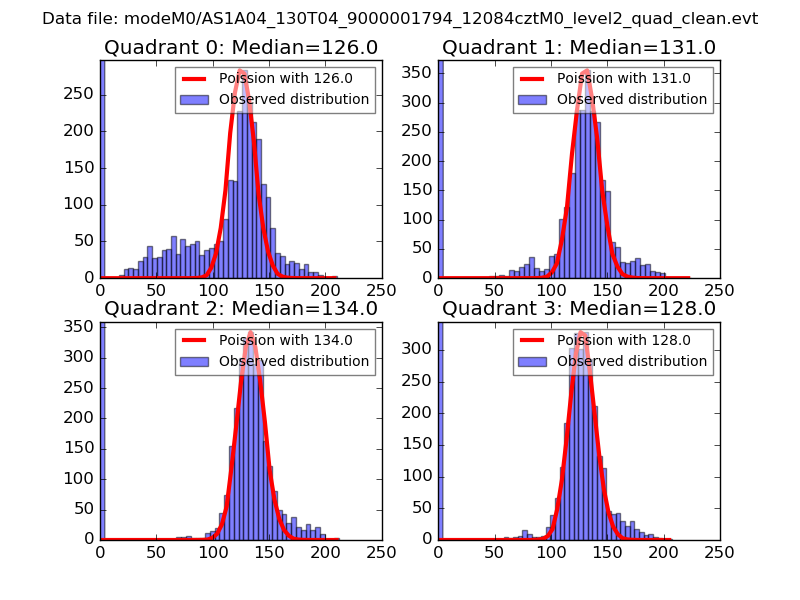 |
 |
| Quadrant-wise count rates Data is divided into 100 sec bins |
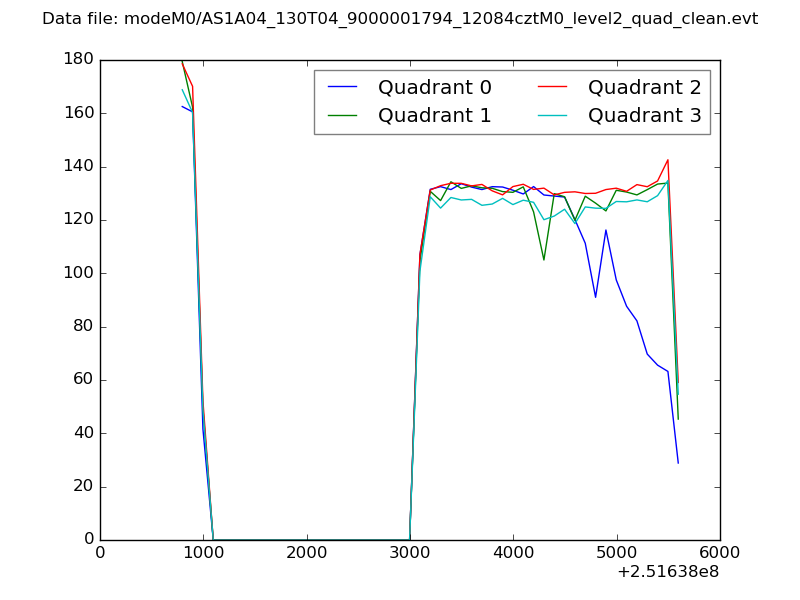 |
|
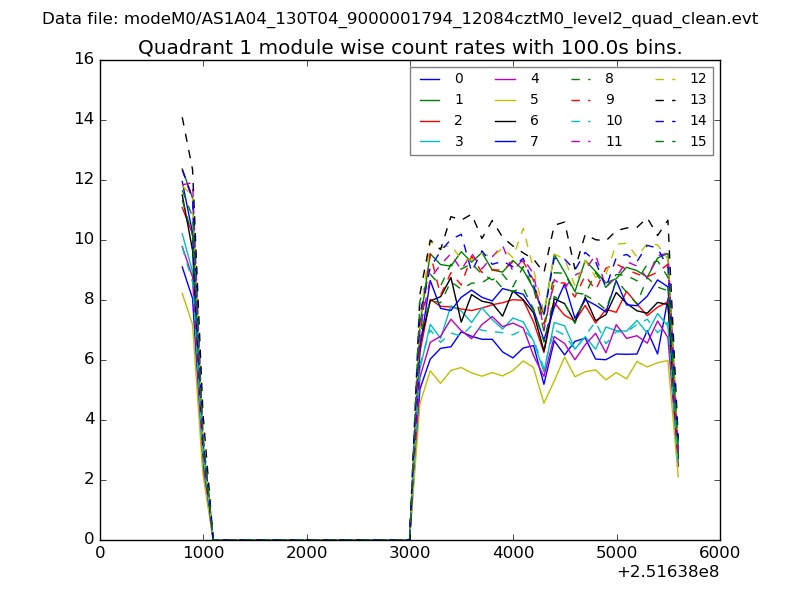
| Module-wise count rates for Quadrant A Data is divided into 100 sec bins |
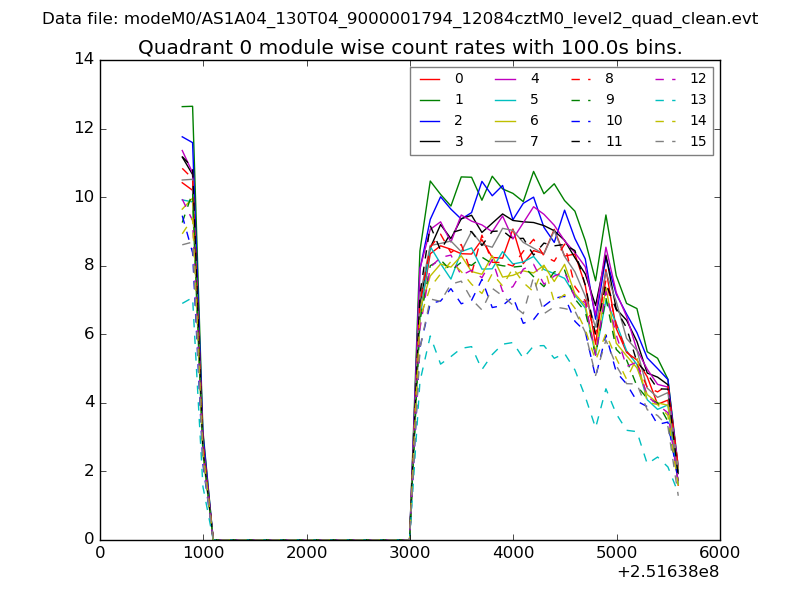 |
 |
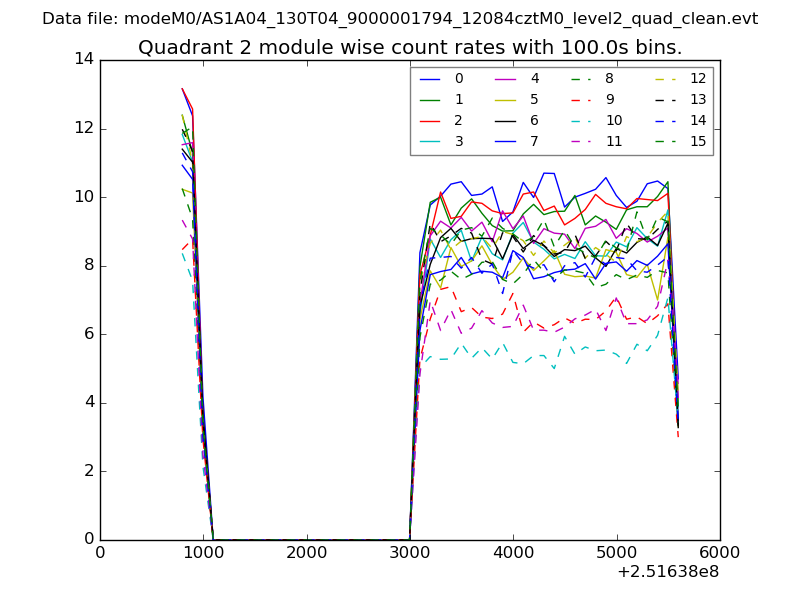
| Module-wise count rates for Quadrant B Data is divided into 100 sec bins |
 |
 |
| Module-wise count rates for Quadrant C Data is divided into 100 sec bins |
 |
 |
| Module-wise count rates for Quadrant D Data is divided into 100 sec bins |
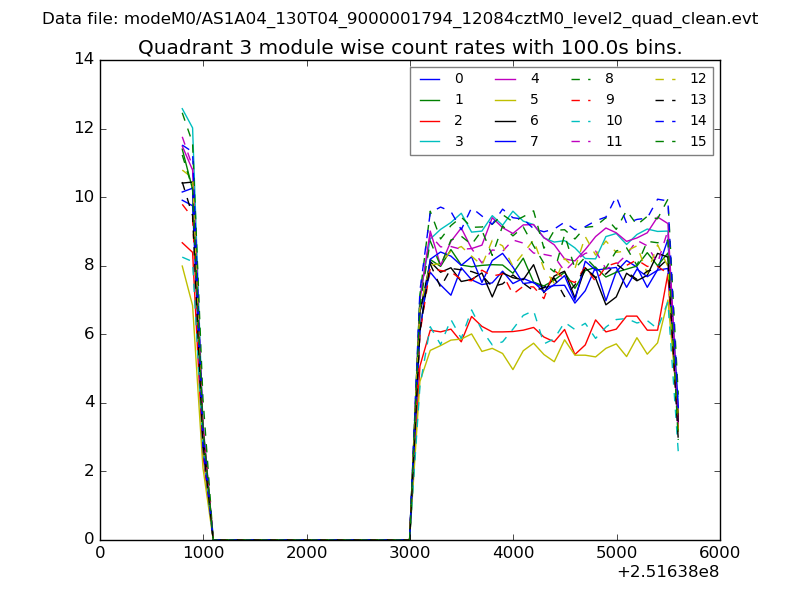 |
 |
| Parameter | Plot |
|---|---|
| CZT HV Monitor | 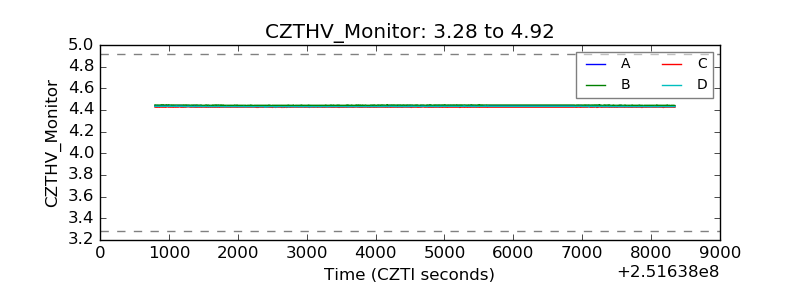 |
| D_VDD | 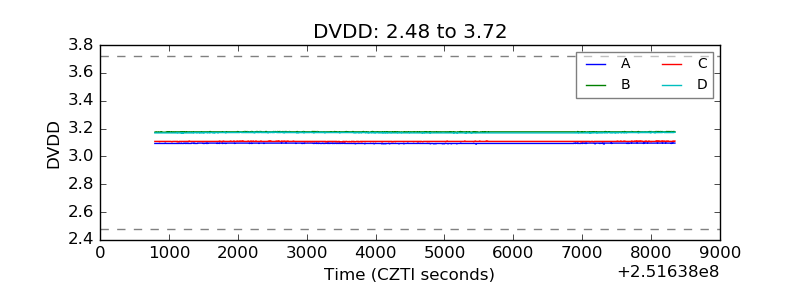 |
| Temperature 1 | 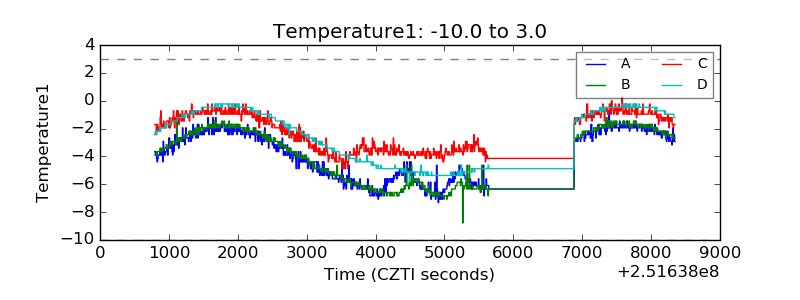 |
| Veto HV Monitor | 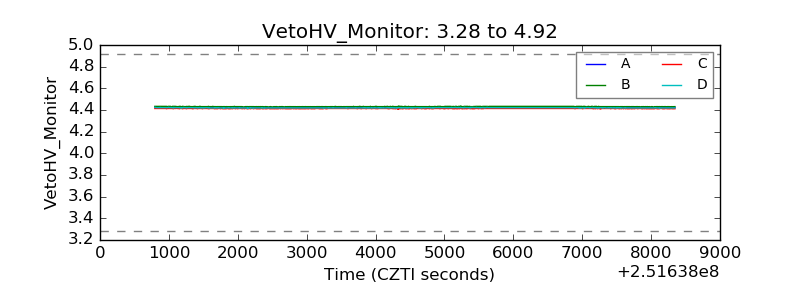 |
| Veto LLD | 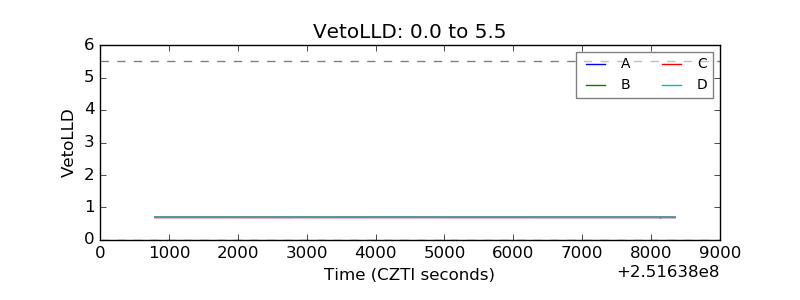 |
| Alpha Counter | 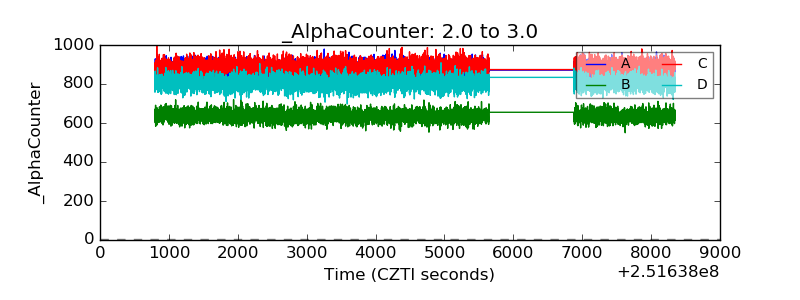 |
| _CPM_Rate | 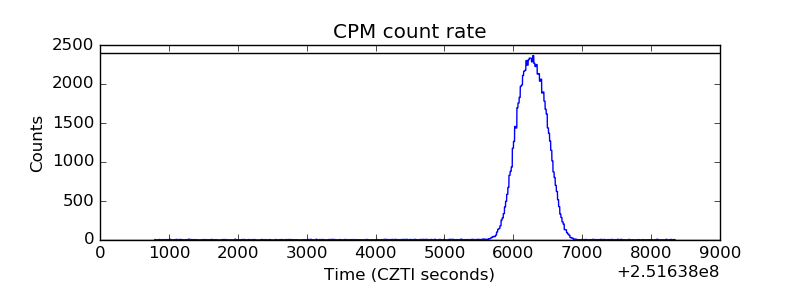 |
| CZT Counter | 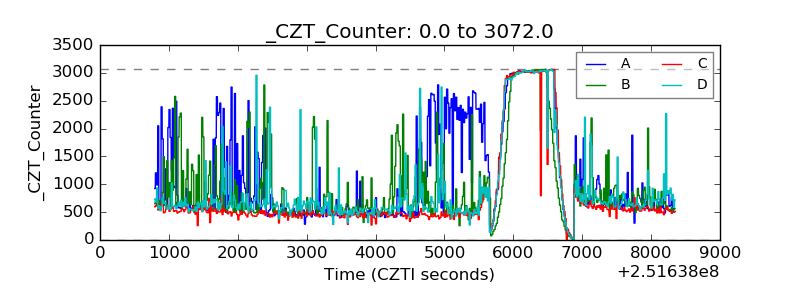 |
| +2.5 Volts monitor |  |
| +5 Volts monitor |  |
| _ROLL_ROT | 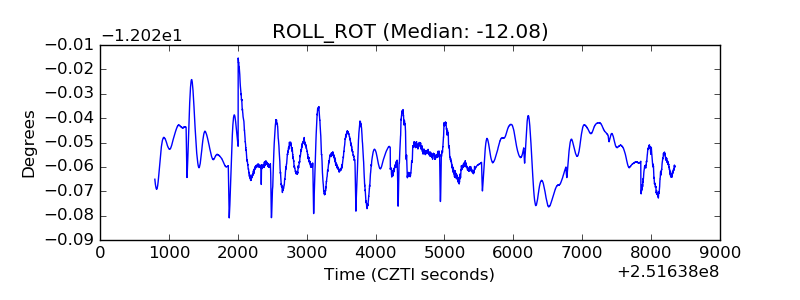 |
| _Roll_DEC | 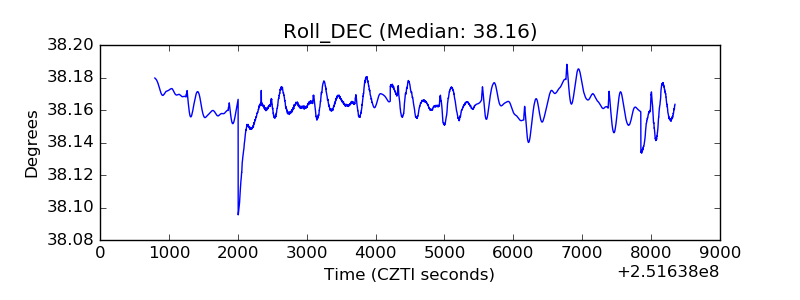 |
| _Roll_RA | 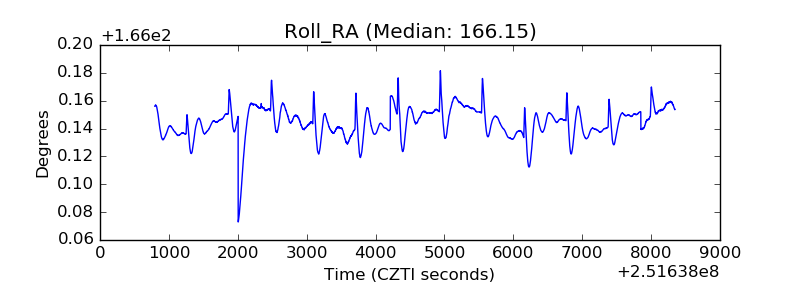 |
| Veto Counter | 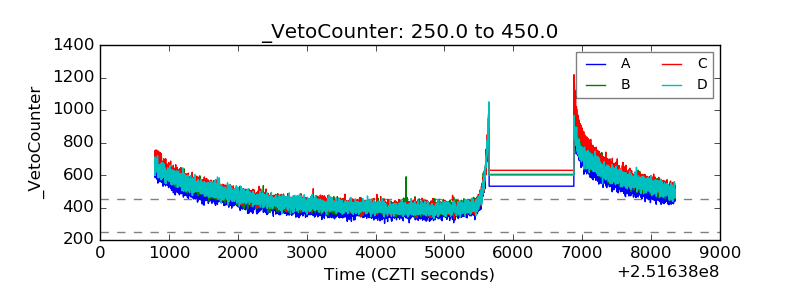 |