| Param | Original file | Final file |
|---|---|---|
| Filename | modeM0/AS1G08_065T01_9000001796cztM0_level2.fits | modeM0/AS1G08_065T01_9000001796cztM0_level2_quad_clean.evt |
| Size (bytes) | 1,372,559,040 | 1,426,484,160 |
| Size | 1.3 GB | 1.3 GB |
| Events in quadrant A | 2,877,394 | 3,321,010 |
| Events in quadrant B | 2,753,836 | 3,219,705 |
| Events in quadrant C | 2,891,432 | 3,194,147 |
| Events in quadrant D | 2,467,728 | 2,914,733 |
| Mode M0 | |||
|---|---|---|---|
| Quadrant | BADHDUFLAG | Total packets | Discarded packets |
| A | 0 | 1065127 | 0 |
| B | 0 | 1231547 | 0 |
| C | 0 | 932483 | 0 |
| D | 0 | 1108279 | 0 |
| Mode M9 | |||
|---|---|---|---|
| Quadrant | BADHDUFLAG | Total packets | Discarded packets |
| A | 0 | 721 | 0 |
| B | 0 | 721 | 0 |
| C | 0 | 721 | 0 |
| D | 0 | 721 | 0 |
| Mode SS | |||
|---|---|---|---|
| Quadrant | BADHDUFLAG | Total packets | Discarded packets |
| A | 0 | 9136 | 0 |
| B | 0 | 9136 | 0 |
| C | 0 | 9136 | 0 |
| D | 0 | 9136 | 0 |
| Quadrant | Total seconds | Saturated seconds | Saturation percentage |
|---|---|---|---|
| A | 445320 | 15108 | 3.392617% |
| B | 445314 | 30078 | 6.754335% |
| C | 445318 | 4156 | 0.933266% |
| D | 445313 | 13399 | 3.008895% |
Noise dominated data is calculated using 1-second bins in cleaned event files. If a bin has >2000 counts, and if more than 50% of those come from <1% of pixels, then it is considered to be noise-dominated and hence unusable.
| Quadrant | # 1 sec bins | Bins with >0 counts | Bins with >2000 counts | High rate bins dominated by noise | Noise dominated (total time) | Noise dominated (detector-on time) | Marked lightcurve |
|---|---|---|---|---|---|---|---|
| A | 79107 | 50104 | 0 | 0 | 0.00% | 0.00% |  |
| B | 79123 | 50089 | 0 | 0 | 0.00% | 0.00% | 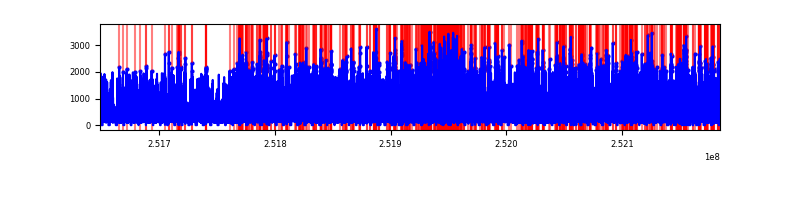 |
| C | 79107 | 50112 | 0 | 0 | 0.00% | 0.00% |  |
| D | 79107 | 50108 | 0 | 0 | 0.00% | 0.00% |  |
Top three noisy pixels from each quadrant. If the there are fewer than three noisy pixels in the level2.evt file, extra rows are filled as -1
| Pixel properties | Quadrant properties | ||||||
|---|---|---|---|---|---|---|---|
| Quadrant | DetID | PixID | Counts | Sigma | Mean | Median | Sigma |
| A | 0 | 29 | 2797 | 11.16 | 750 | 704 | 187.5 |
| A | 7 | 110 | 2416 | 9.13 | 750 | 704 | 187.5 |
| A | 0 | 30 | 2133 | 7.62 | 750 | 704 | 187.5 |
| B | 2 | 9 | 2243 | 10.69 | 728 | 694 | 144.9 |
| B | 14 | 254 | 1833 | 7.86 | 728 | 694 | 144.9 |
| B | 3 | 17 | 1819 | 7.76 | 728 | 694 | 144.9 |
| C | 12 | 241 | 2016 | 6.68 | 764 | 714 | 195.0 |
| C | 3 | 126 | 1941 | 6.29 | 764 | 714 | 195.0 |
| C | 3 | 158 | 1878 | 5.97 | 764 | 714 | 195.0 |
| D | 6 | 231 | 1844 | 6.43 | 705 | 643 | 186.9 |
| D | 7 | 5 | 1781 | 6.09 | 705 | 643 | 186.9 |
| D | 7 | 3 | 1702 | 5.67 | 705 | 643 | 186.9 |
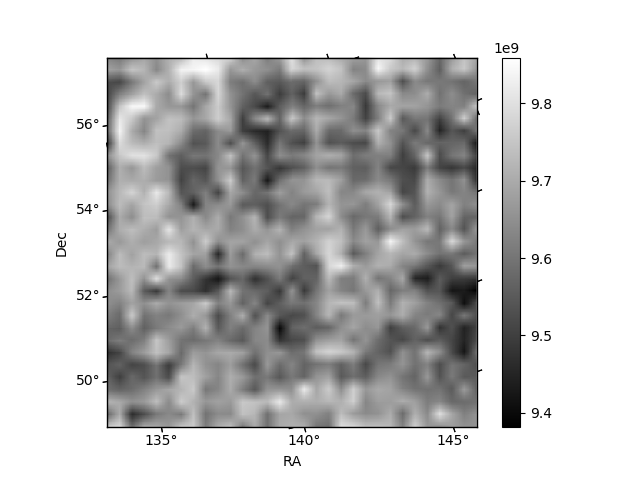
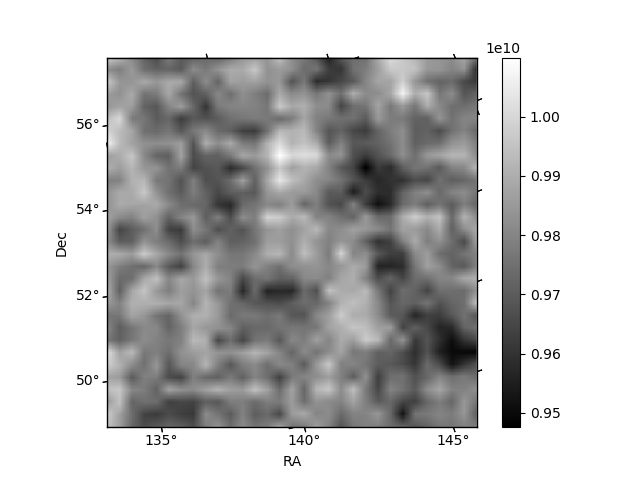
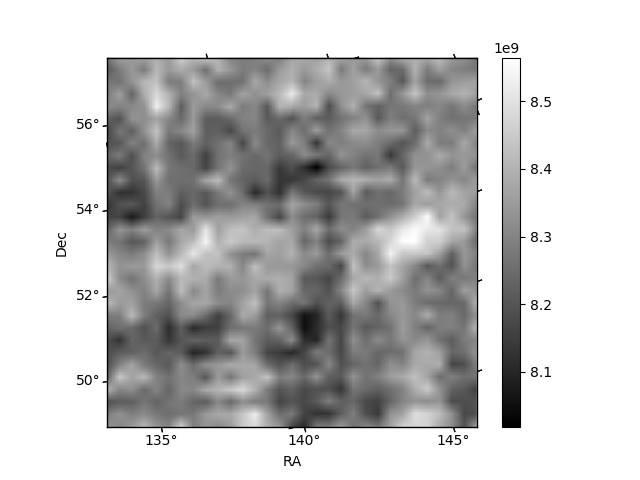
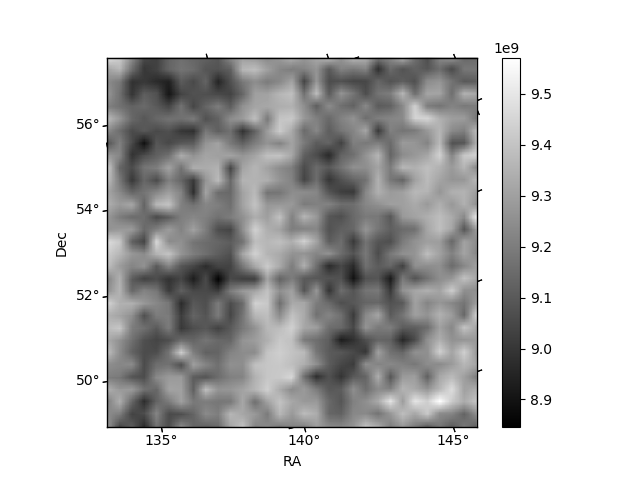
Histogram calculated using DETX and DETY for each event in the final _common_clean file
| Quadrant A | 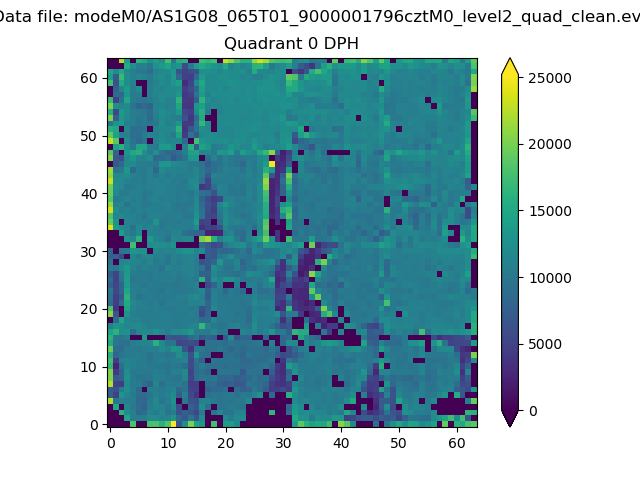 |
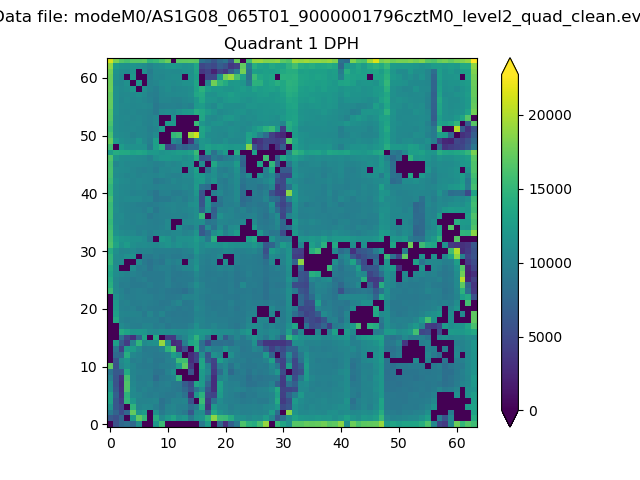 |
Quadrant B |
|---|---|---|---|
| Quadrant D | 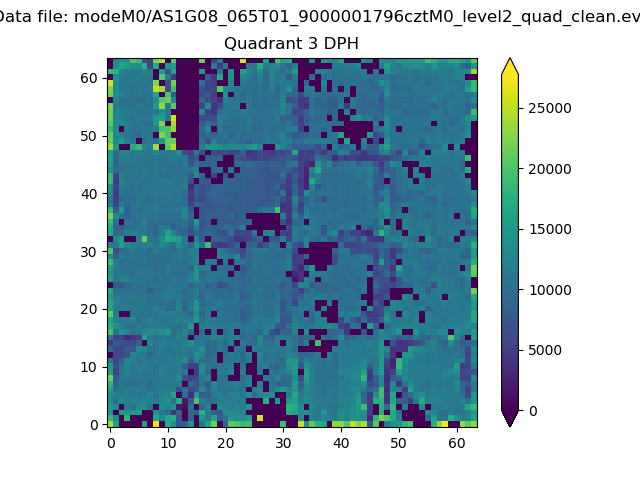 |
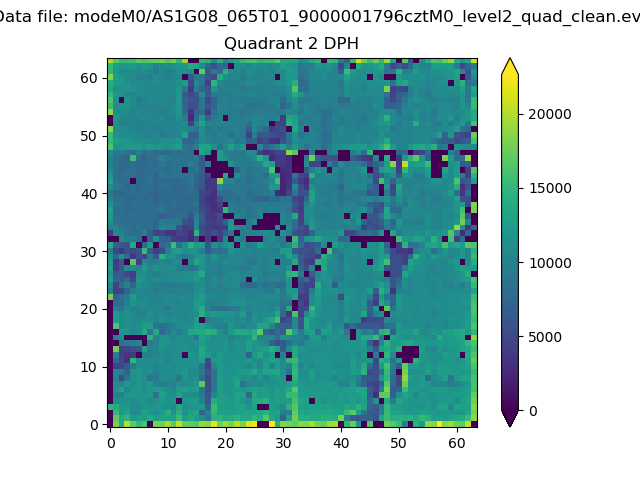 |
Quadrant C |
| Plot type | Count rate plots | Images |
|---|---|---|
| Comparison with Poisson distribution Blue bars denote a histogram of data divided into 1 sec bins. Red curve is a Poisson curve with rate = median count rate of data. |
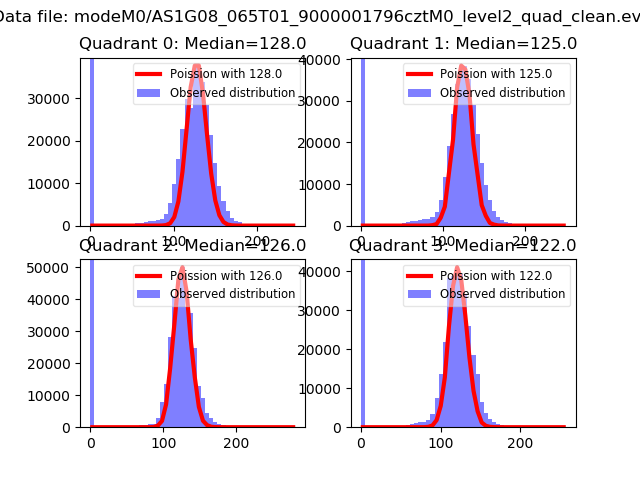 |
 |
| Quadrant-wise count rates Data is divided into 100 sec bins |
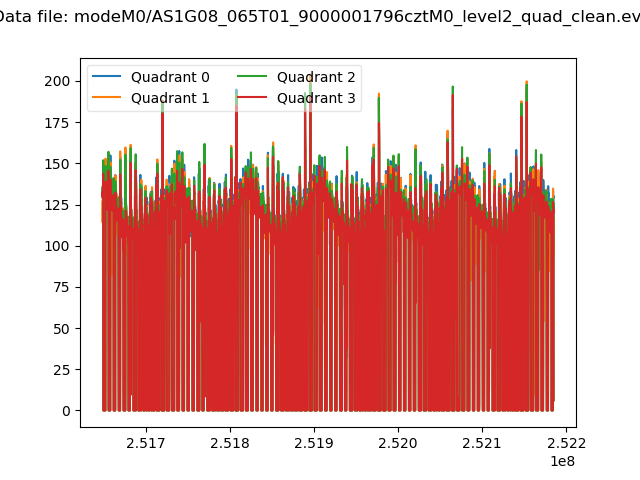 |
|
| Module-wise count rates for Quadrant A Data is divided into 100 sec bins |
 |
 |
| Module-wise count rates for Quadrant B Data is divided into 100 sec bins |
 |
 |
| Module-wise count rates for Quadrant C Data is divided into 100 sec bins |
 |
 |
| Module-wise count rates for Quadrant D Data is divided into 100 sec bins |
 |
 |
| Parameter | Plot |
|---|---|
| CZT HV Monitor |  |
| D_VDD | 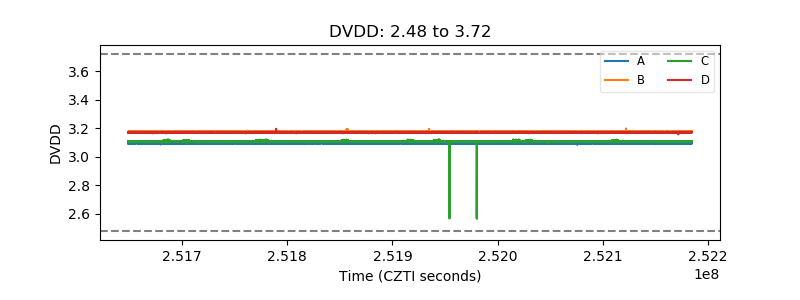 |
| Temperature 1 | 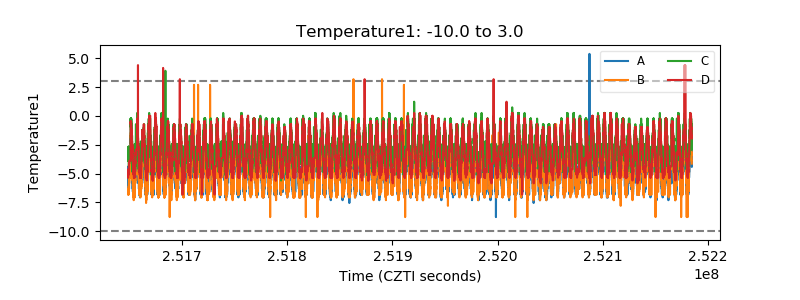 |
| Veto HV Monitor | 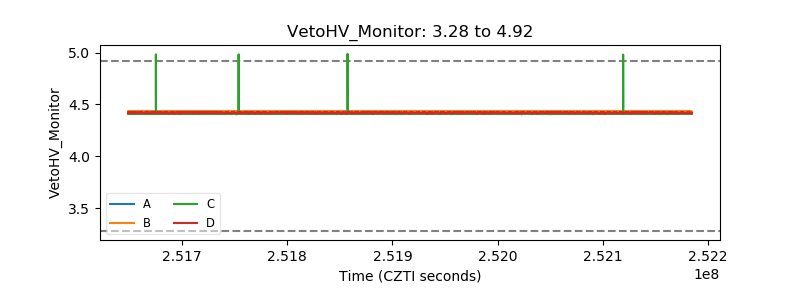 |
| Veto LLD | 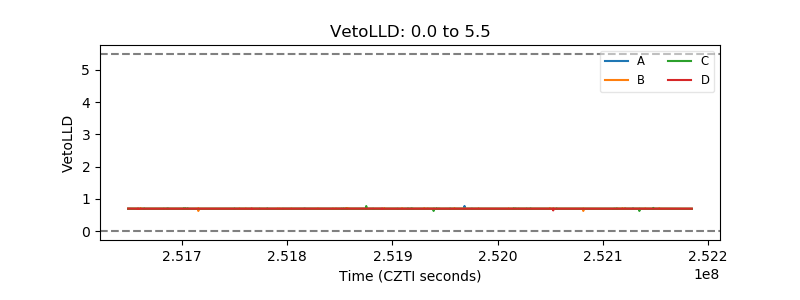 |
| Alpha Counter | 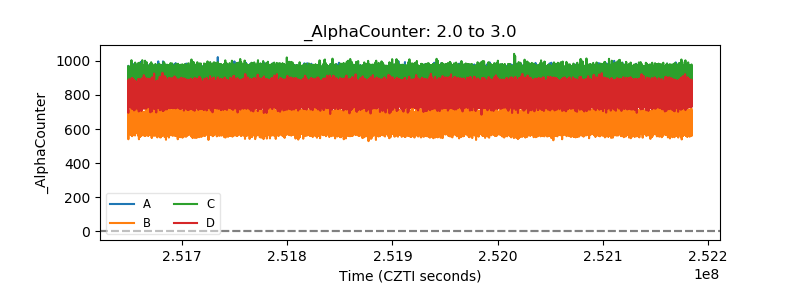 |
| _CPM_Rate | 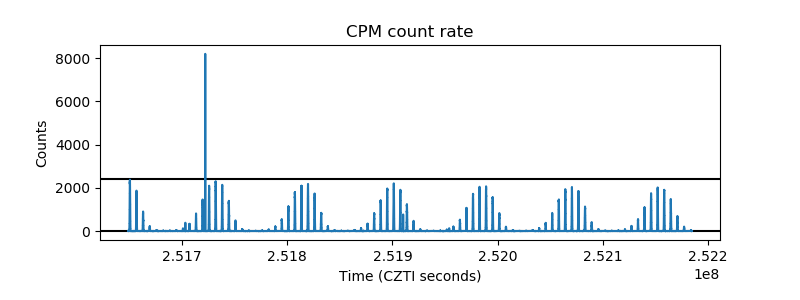 |
| CZT Counter | 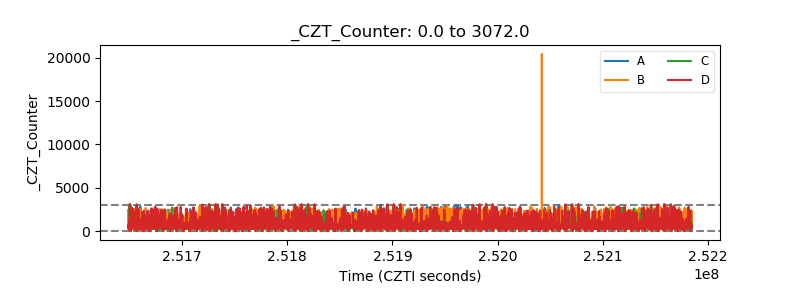 |
| +2.5 Volts monitor | 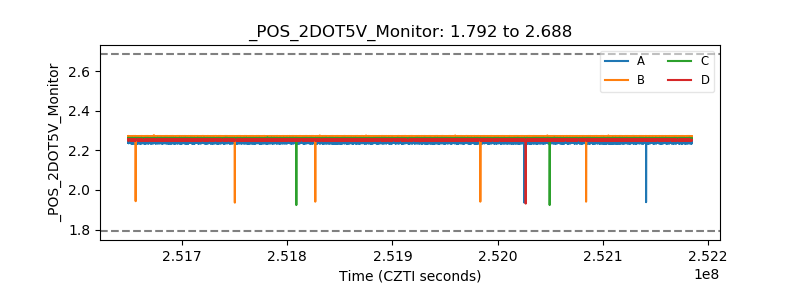 |
| +5 Volts monitor | 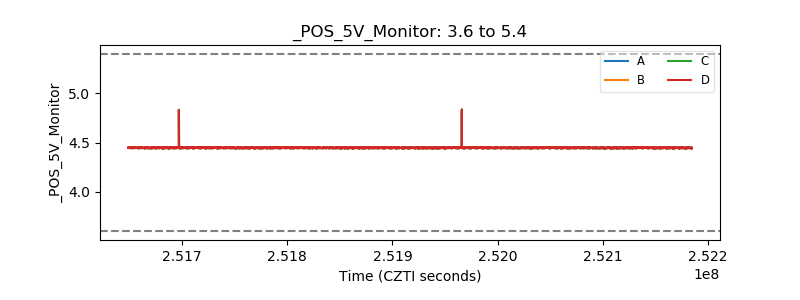 |
| _ROLL_ROT | 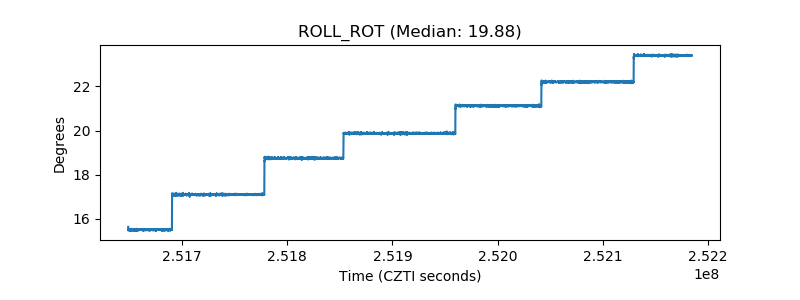 |
| _Roll_DEC | 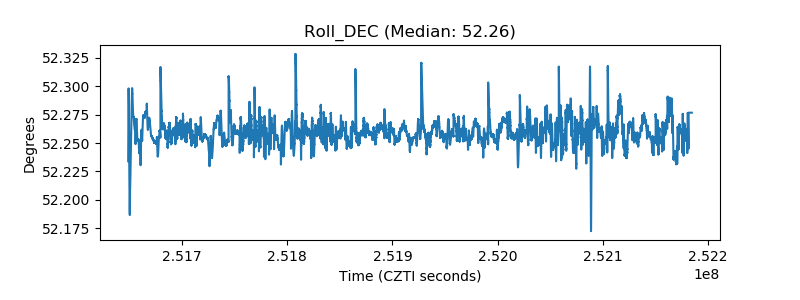 |
| _Roll_RA | 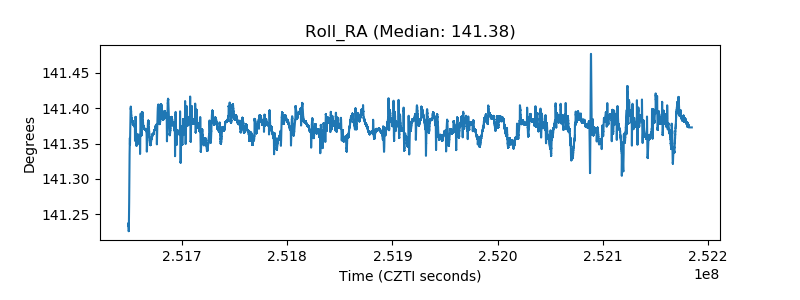 |
| Veto Counter | 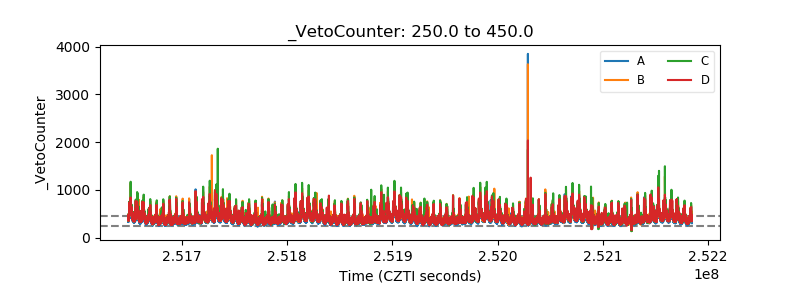 |