| Param | Original file | Final file |
|---|---|---|
| Filename | modeM0/AS1G08_065T01_9000001796_12085cztM0_level2.evt | modeM0/AS1G08_065T01_9000001796_12085cztM0_level2_quad_clean.evt |
| Size (bytes) | 210,504,960 | 26,827,200 |
| Size | 200.8 MB | 25.6 MB |
| Events in quadrant A | 1,654,395 | 161,346 |
| Events in quadrant B | 1,708,498 | 163,672 |
| Events in quadrant C | 1,254,459 | 164,197 |
| Events in quadrant D | 1,599,807 | 156,806 |
| Mode M0 | |||
|---|---|---|---|
| Quadrant | BADHDUFLAG | Total packets | Discarded packets |
| A | 0 | 6533 | 2 |
| B | 0 | 6634 | 1 |
| C | 0 | 5197 | 1 |
| D | 0 | 6466 | 1 |
| Mode M9 | |||
|---|---|---|---|
| Quadrant | BADHDUFLAG | Total packets | Discarded packets |
| A | 0 | 14 | 0 |
| B | 0 | 14 | 0 |
| C | 0 | 14 | 0 |
| D | 0 | 14 | 0 |
| Mode SS | |||
|---|---|---|---|
| Quadrant | BADHDUFLAG | Total packets | Discarded packets |
| A | 0 | 48 | 0 |
| B | 0 | 48 | 0 |
| C | 0 | 48 | 0 |
| D | 0 | 48 | 0 |
| Quadrant | Total seconds | Saturated seconds | Saturation percentage |
|---|---|---|---|
| A | 2298 | 138 | 6.005222% |
| B | 2298 | 166 | 7.223673% |
| C | 2298 | 40 | 1.740644% |
| D | 2298 | 84 | 3.655352% |
Noise dominated data is calculated using 1-second bins in cleaned event files. If a bin has >2000 counts, and if more than 50% of those come from <1% of pixels, then it is considered to be noise-dominated and hence unusable.
| Quadrant | # 1 sec bins | Bins with >0 counts | Bins with >2000 counts | High rate bins dominated by noise | Noise dominated (total time) | Noise dominated (detector-on time) | Marked lightcurve |
|---|---|---|---|---|---|---|---|
| A | 3654 | 2300 | 34 | 34 | 0.93% | 1.48% | 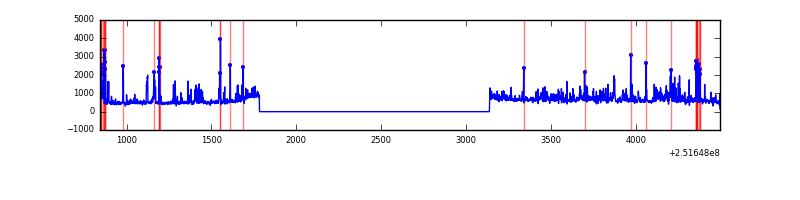 |
| B | 3654 | 2300 | 58 | 58 | 1.59% | 2.52% | 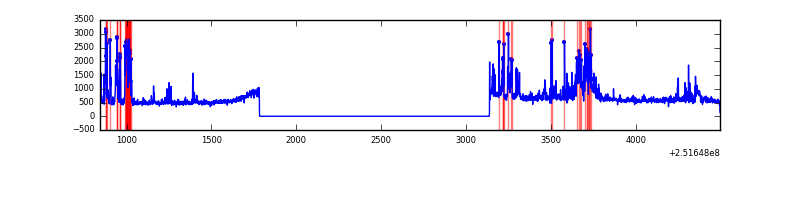 |
| C | 3654 | 2300 | 0 | 0 | 0.00% | 0.00% | 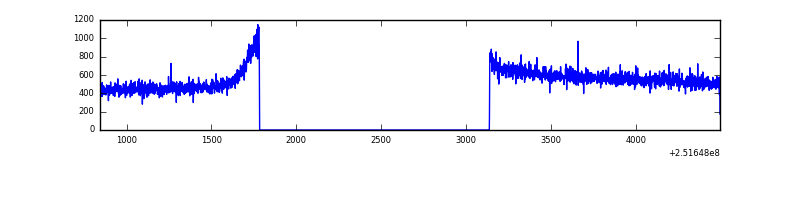 |
| D | 3654 | 2300 | 36 | 36 | 0.99% | 1.57% | 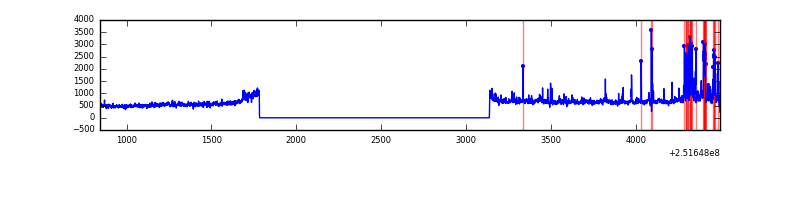 |
Top three noisy pixels from each quadrant. If the there are fewer than three noisy pixels in the level2.evt file, extra rows are filled as -1
| Pixel properties | Quadrant properties | ||||||
|---|---|---|---|---|---|---|---|
| Quadrant | DetID | PixID | Counts | Sigma | Mean | Median | Sigma |
| A | 13 | 251 | 236266 | 3528.98 | 325 | 318 | 66.9 |
| A | 1 | 162 | 63720 | 948.28 | 325 | 318 | 66.9 |
| A | 1 | 178 | 33519 | 496.57 | 325 | 318 | 66.9 |
| B | 4 | 239 | 346946 | 5604.18 | 324 | 317 | 61.9 |
| B | 15 | 204 | 54632 | 878.15 | 324 | 317 | 61.9 |
| B | 11 | 51 | 45795 | 735.27 | 324 | 317 | 61.9 |
| C | 13 | 61 | 2420 | 27.9 | 321 | 322 | 75.2 |
| C | 14 | 67 | 2360 | 27.1 | 321 | 322 | 75.2 |
| C | 3 | 202 | 777 | 6.05 | 321 | 322 | 75.2 |
| D | 8 | 195 | 166616 | 2153.77 | 319 | 310 | 77.2 |
| D | 10 | 199 | 121997 | 1575.93 | 319 | 310 | 77.2 |
| D | 1 | 52 | 65227 | 840.72 | 319 | 310 | 77.2 |
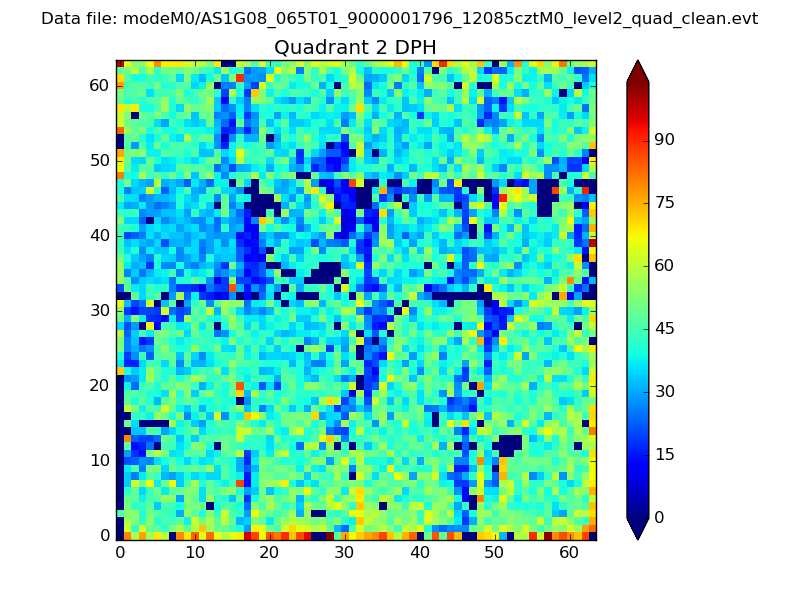
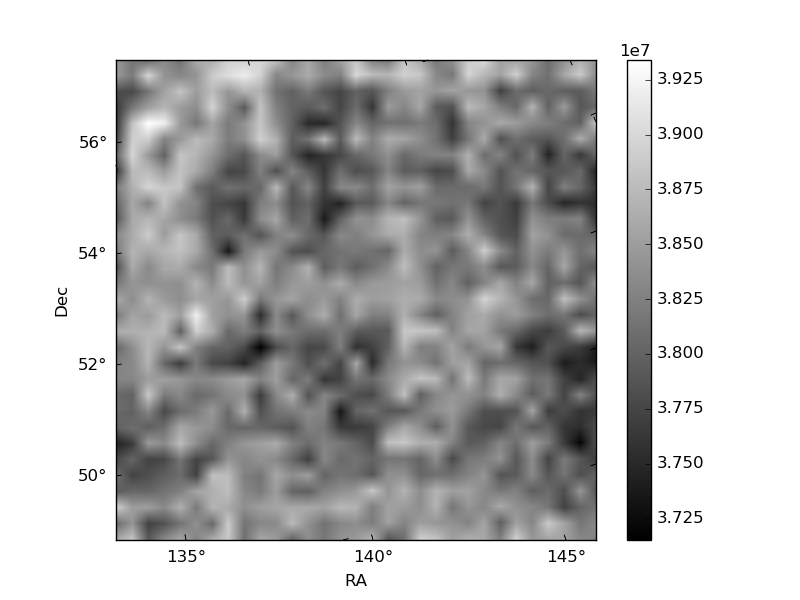
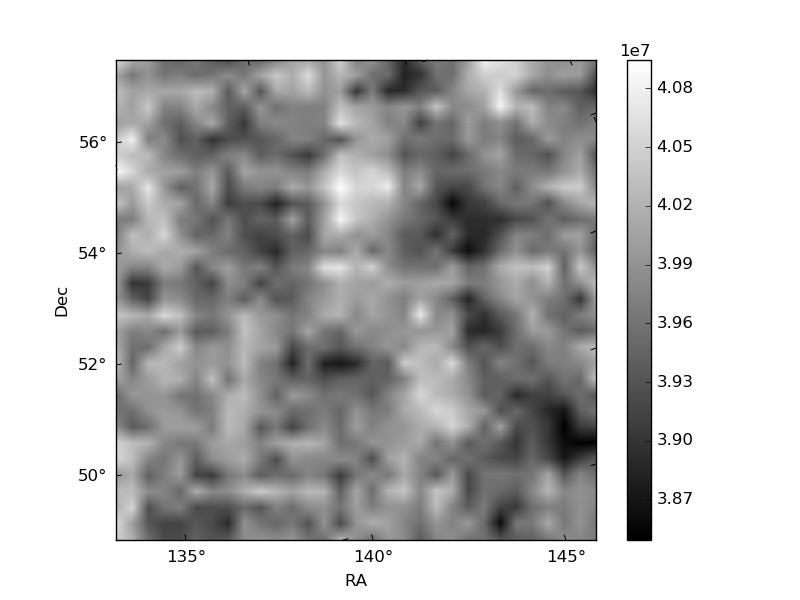
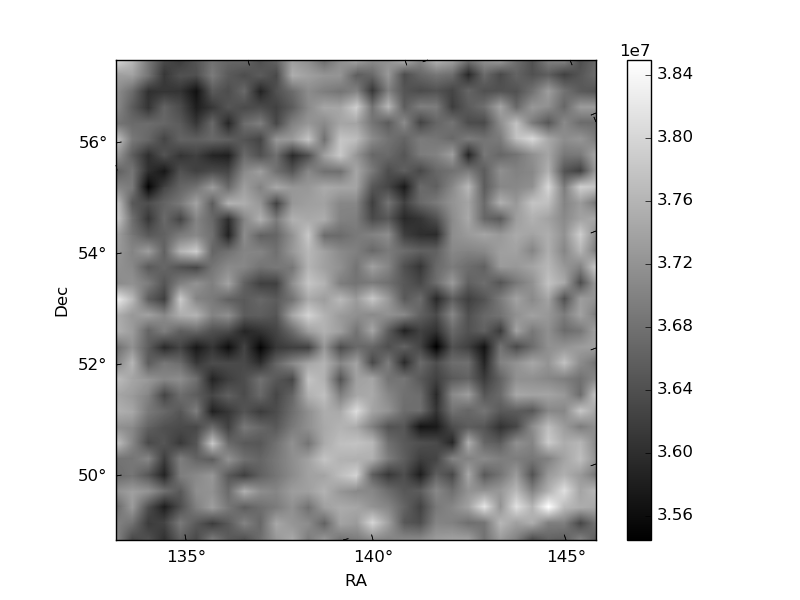
Histogram calculated using DETX and DETY for each event in the final _common_clean file
| Quadrant A | 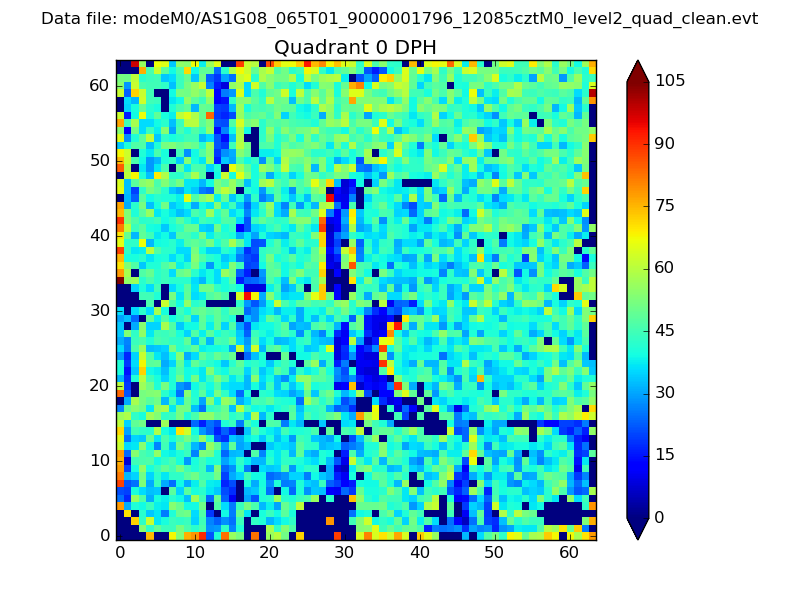 |
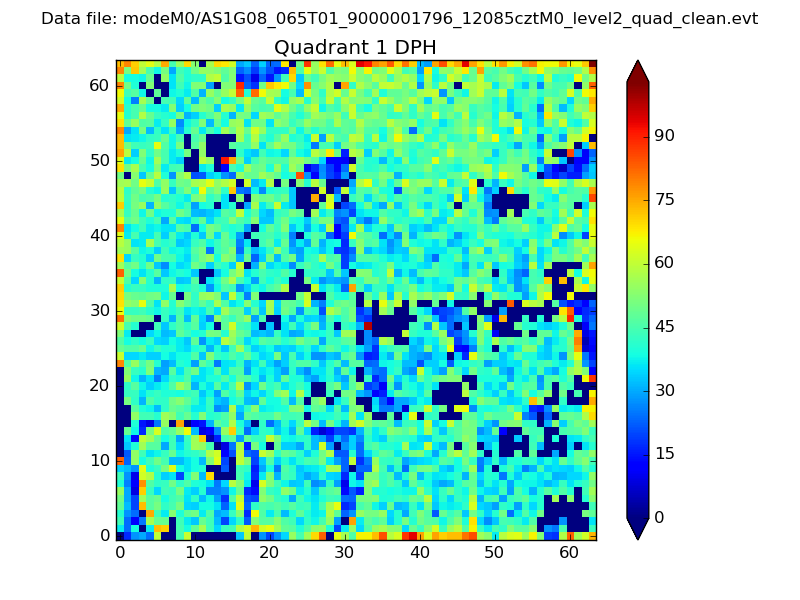 |
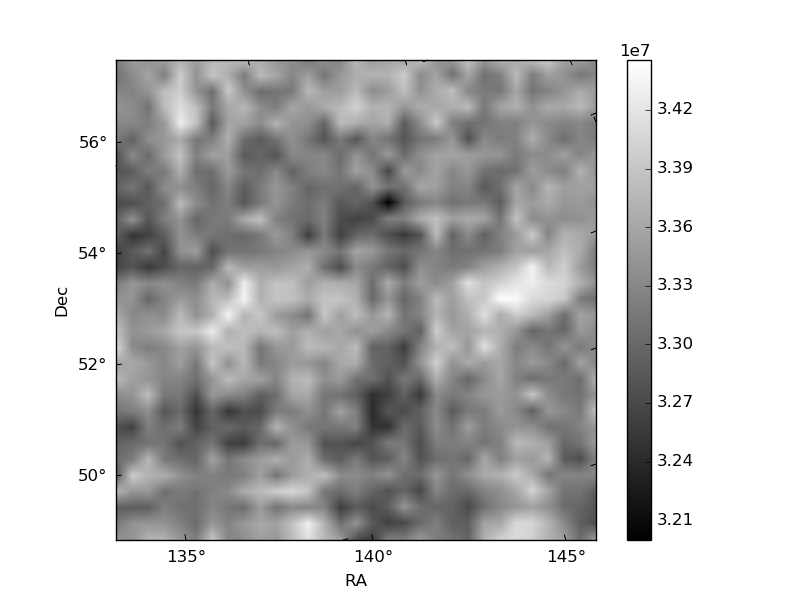
Quadrant B |
|---|---|---|---|
| Quadrant D | 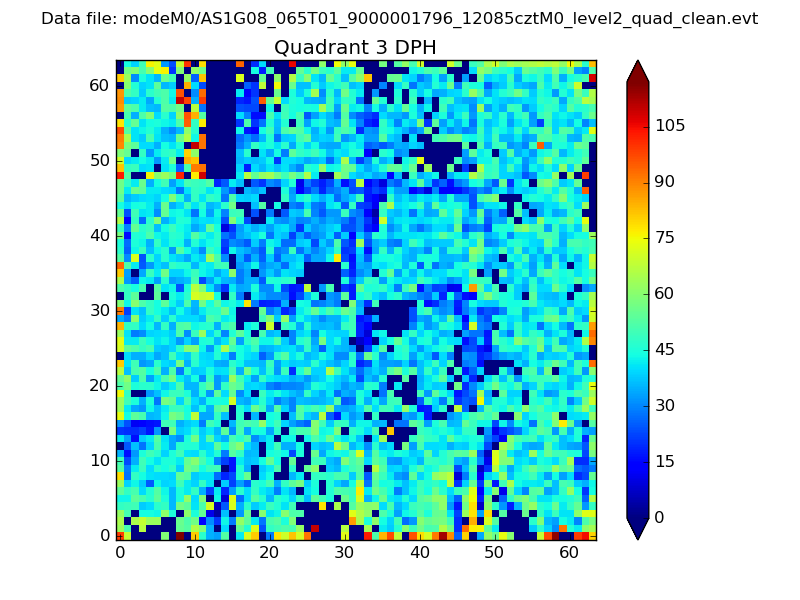 |
 |
Quadrant C |
| Plot type | Count rate plots | Images |
|---|---|---|
| Comparison with Poisson distribution Blue bars denote a histogram of data divided into 1 sec bins. Red curve is a Poisson curve with rate = median count rate of data. |
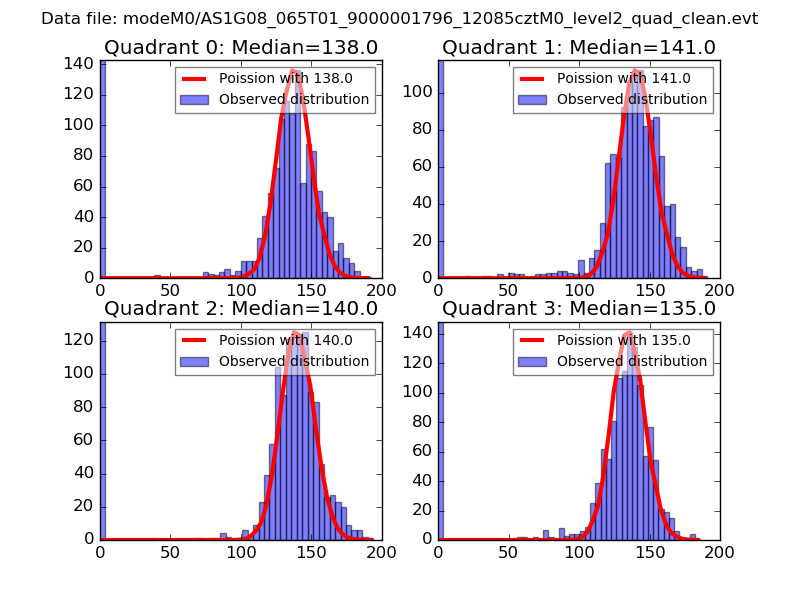 |
 |
| Quadrant-wise count rates Data is divided into 100 sec bins |
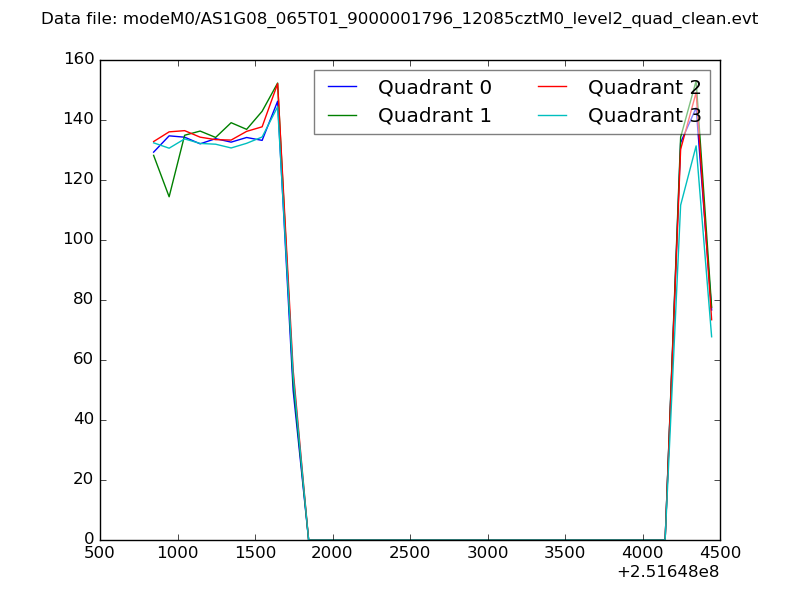 |
|
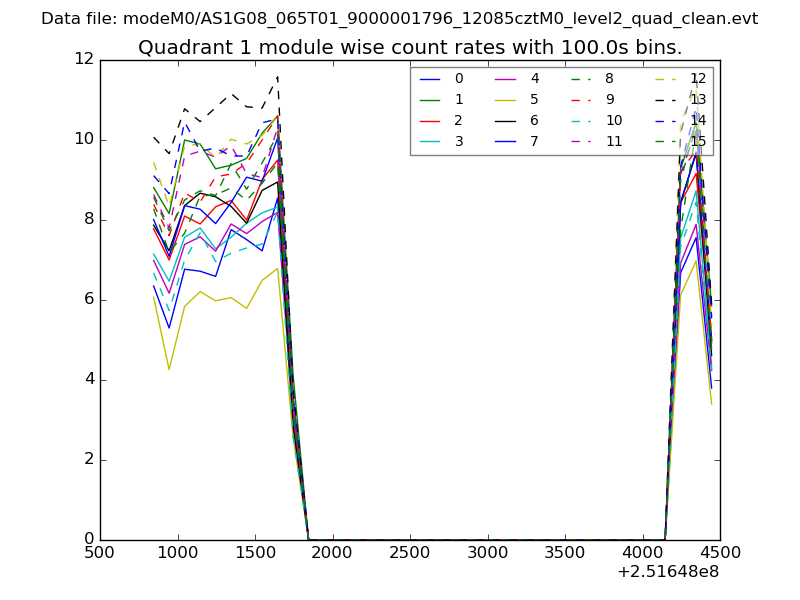
| Module-wise count rates for Quadrant A Data is divided into 100 sec bins |
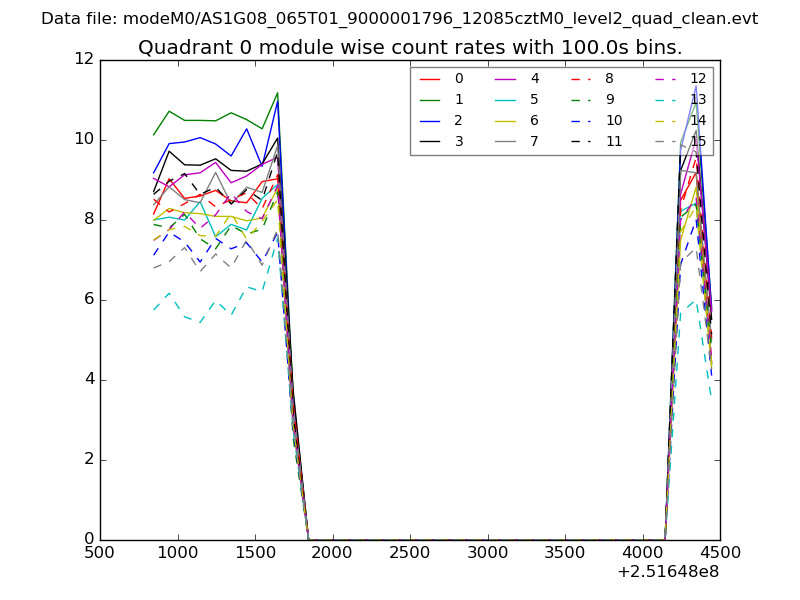 |
 |
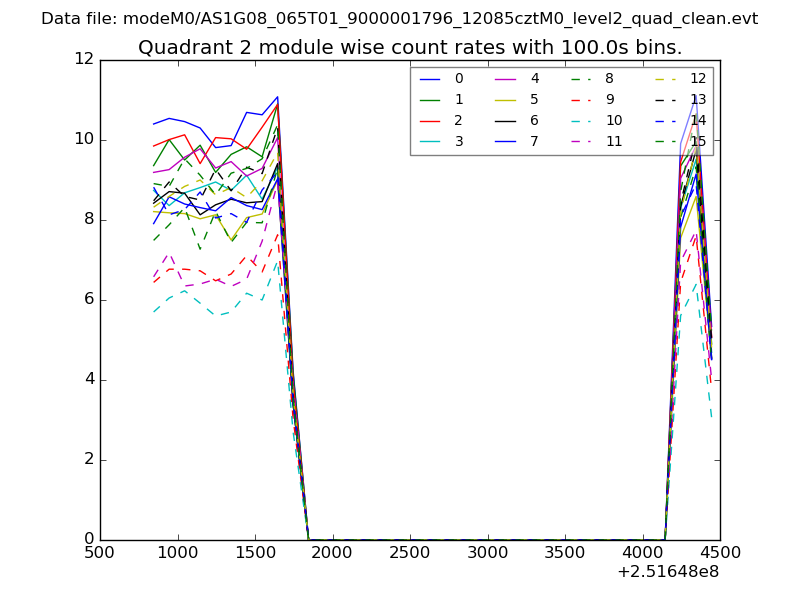
| Module-wise count rates for Quadrant B Data is divided into 100 sec bins |
 |
 |
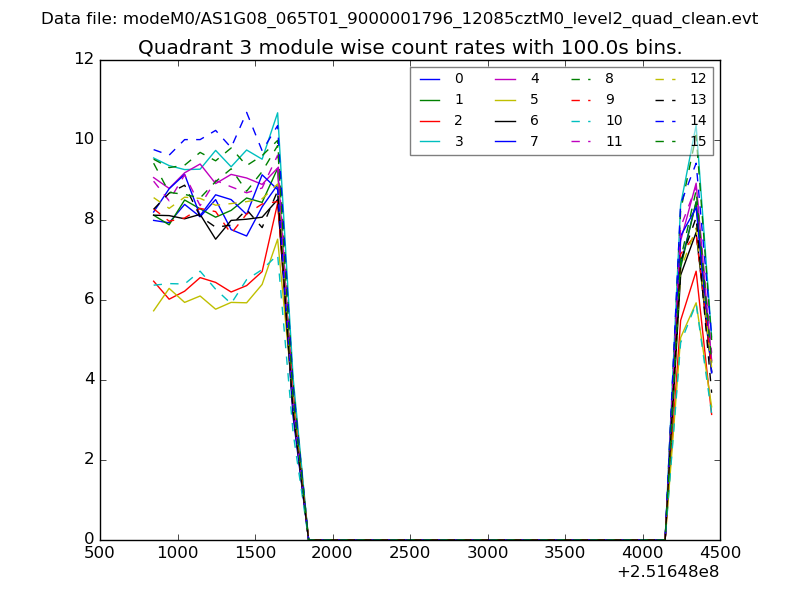
| Module-wise count rates for Quadrant C Data is divided into 100 sec bins |
 |
 |
| Module-wise count rates for Quadrant D Data is divided into 100 sec bins |
 |
 |
| Parameter | Plot |
|---|---|
| CZT HV Monitor | 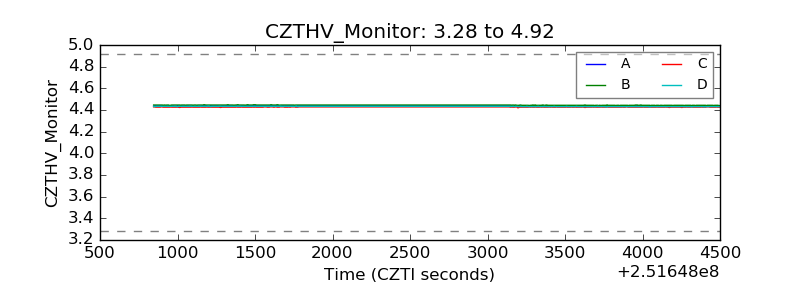 |
| D_VDD |  |
| Temperature 1 | 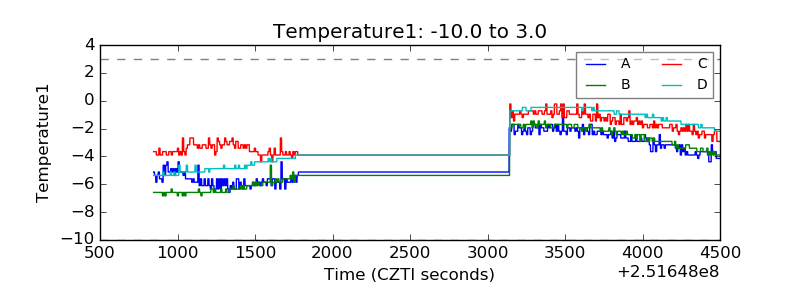 |
| Veto HV Monitor | 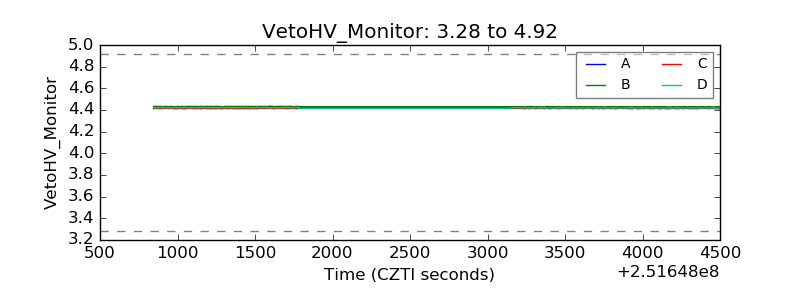 |
| Veto LLD | 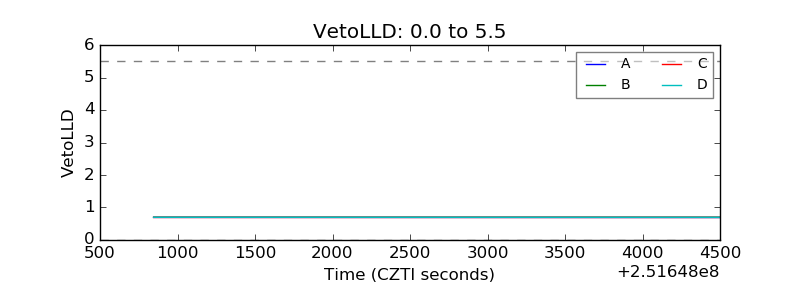 |
| Alpha Counter | 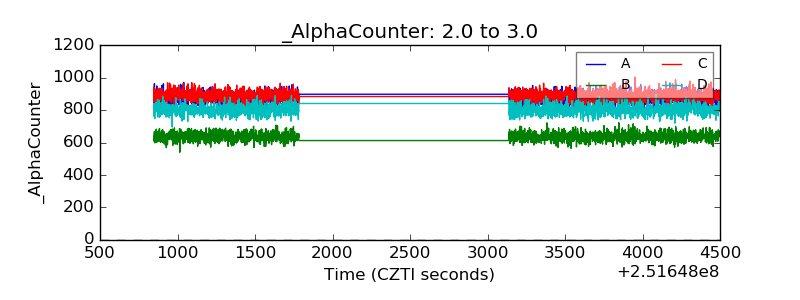 |
| _CPM_Rate | 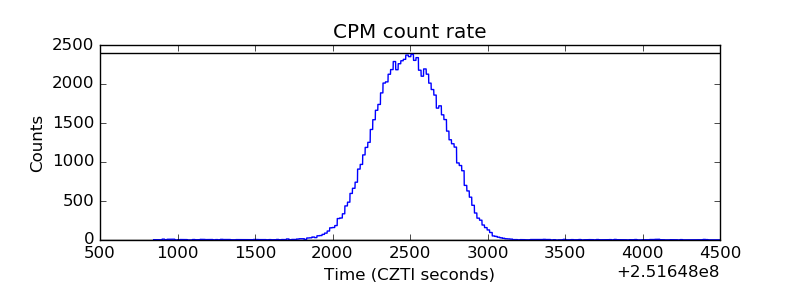 |
| CZT Counter | 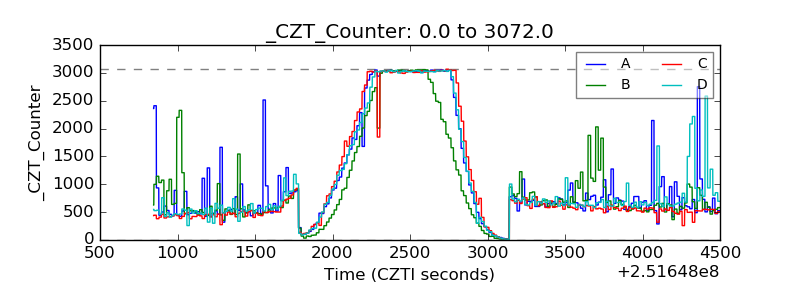 |
| +2.5 Volts monitor |  |
| +5 Volts monitor |  |
| _ROLL_ROT | 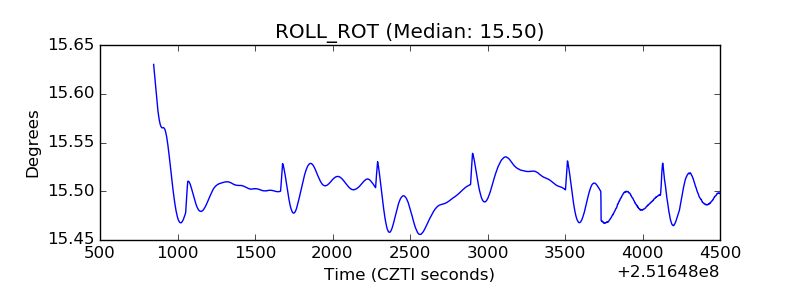 |
| _Roll_DEC | 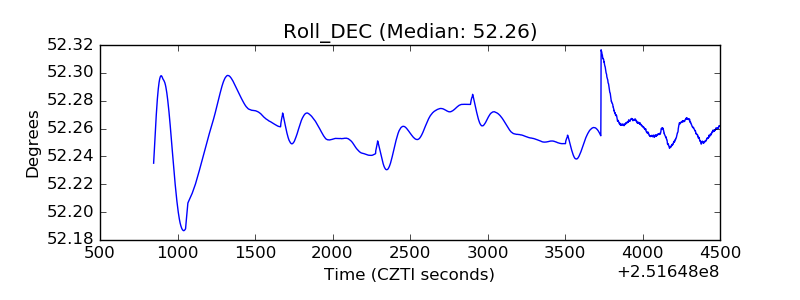 |
| _Roll_RA | 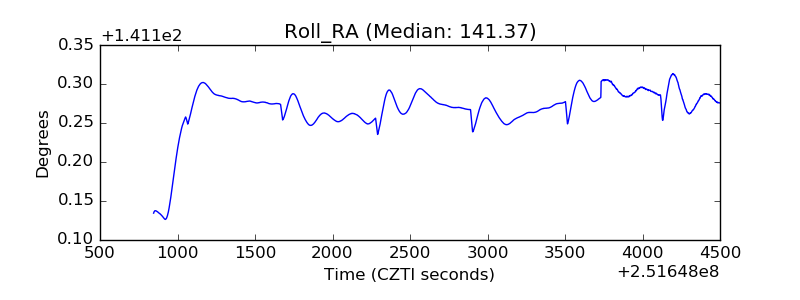 |
| Veto Counter | 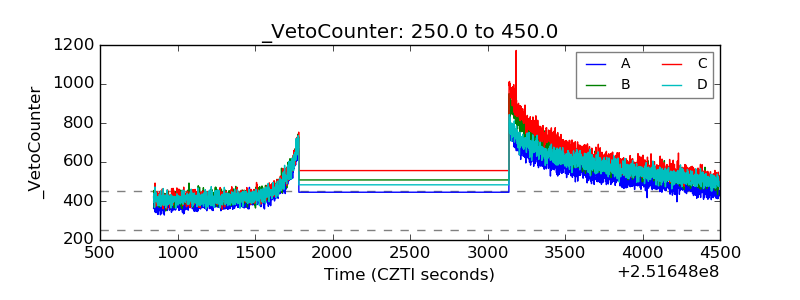 |