| Param | Original file | Final file |
|---|---|---|
| Filename | modeM0/AS1G08_065T01_9000001796_12087cztM0_level2.evt | modeM0/AS1G08_065T01_9000001796_12087cztM0_level2_quad_clean.evt |
| Size (bytes) | 551,234,880 | 103,060,800 |
| Size | 525.7 MB | 98.3 MB |
| Events in quadrant A | 3,990,446 | 673,536 |
| Events in quadrant B | 4,260,074 | 669,664 |
| Events in quadrant C | 3,211,361 | 681,302 |
| Events in quadrant D | 4,794,515 | 646,250 |
| Mode M0 | |||
|---|---|---|---|
| Quadrant | BADHDUFLAG | Total packets | Discarded packets |
| A | 0 | 16051 | 3 |
| B | 0 | 16967 | 2 |
| C | 0 | 13778 | 2 |
| D | 0 | 18548 | 2 |
| Mode M9 | |||
|---|---|---|---|
| Quadrant | BADHDUFLAG | Total packets | Discarded packets |
| A | 0 | 25 | 0 |
| B | 0 | 25 | 0 |
| C | 0 | 25 | 0 |
| D | 0 | 25 | 0 |
| Mode SS | |||
|---|---|---|---|
| Quadrant | BADHDUFLAG | Total packets | Discarded packets |
| A | 0 | 132 | 0 |
| B | 0 | 132 | 0 |
| C | 0 | 132 | 0 |
| D | 0 | 132 | 0 |
| Quadrant | Total seconds | Saturated seconds | Saturation percentage |
|---|---|---|---|
| A | 6458 | 323 | 5.001548% |
| B | 6458 | 500 | 7.742335% |
| C | 6458 | 134 | 2.074946% |
| D | 6458 | 401 | 6.209353% |
Noise dominated data is calculated using 1-second bins in cleaned event files. If a bin has >2000 counts, and if more than 50% of those come from <1% of pixels, then it is considered to be noise-dominated and hence unusable.
| Quadrant | # 1 sec bins | Bins with >0 counts | Bins with >2000 counts | High rate bins dominated by noise | Noise dominated (total time) | Noise dominated (detector-on time) | Marked lightcurve |
|---|---|---|---|---|---|---|---|
| A | 8984 | 6459 | 89 | 89 | 0.99% | 1.38% | 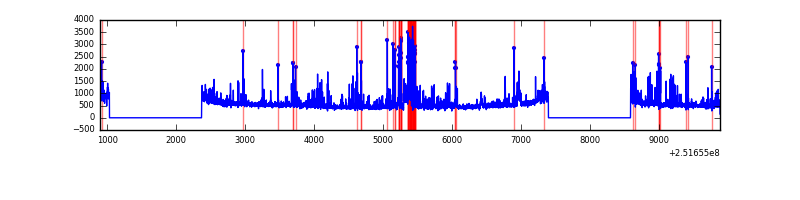 |
| B | 8984 | 6459 | 194 | 194 | 2.16% | 3.00% | 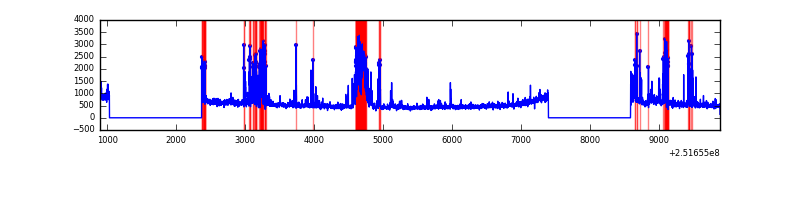 |
| C | 8984 | 6461 | 0 | 0 | 0.00% | 0.00% | 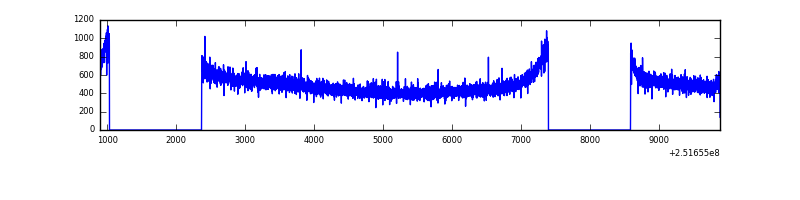 |
| D | 8984 | 6460 | 171 | 171 | 1.90% | 2.65% | 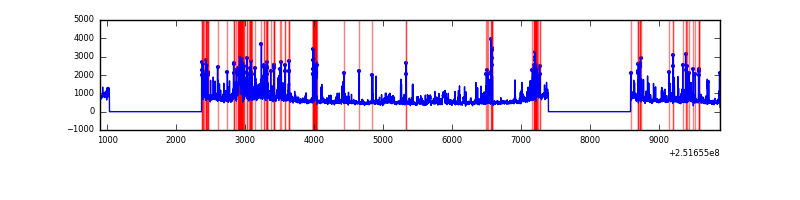 |
Top three noisy pixels from each quadrant. If the there are fewer than three noisy pixels in the level2.evt file, extra rows are filled as -1
| Pixel properties | Quadrant properties | ||||||
|---|---|---|---|---|---|---|---|
| Quadrant | DetID | PixID | Counts | Sigma | Mean | Median | Sigma |
| A | 13 | 251 | 504765 | 3040.24 | 824 | 809 | 165.8 |
| A | 1 | 162 | 132405 | 793.89 | 824 | 809 | 165.8 |
| A | 1 | 178 | 51856 | 307.95 | 824 | 809 | 165.8 |
| B | 4 | 239 | 957232 | 6256.17 | 815 | 796 | 152.9 |
| B | 15 | 204 | 84184 | 545.45 | 815 | 796 | 152.9 |
| B | 12 | 111 | 16439 | 102.32 | 815 | 796 | 152.9 |
| C | 13 | 61 | 6032 | 27.75 | 821 | 823 | 187.7 |
| C | 14 | 67 | 4995 | 22.22 | 821 | 823 | 187.7 |
| C | 8 | 208 | 4613 | 20.19 | 821 | 823 | 187.7 |
| D | 1 | 52 | 582522 | 3030.17 | 807 | 786 | 192.0 |
| D | 8 | 195 | 423436 | 2201.51 | 807 | 786 | 192.0 |
| D | 14 | 34 | 233173 | 1210.47 | 807 | 786 | 192.0 |
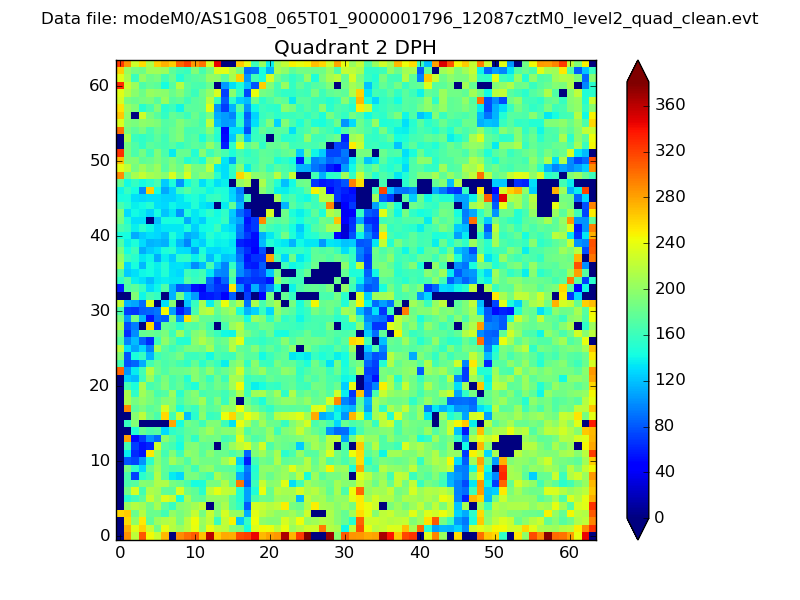
Histogram calculated using DETX and DETY for each event in the final _common_clean file
| Quadrant A | 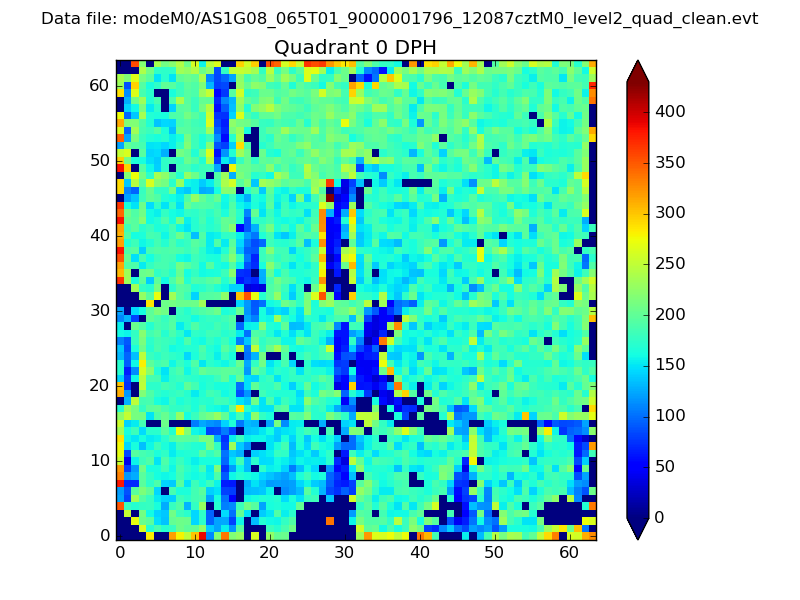 |
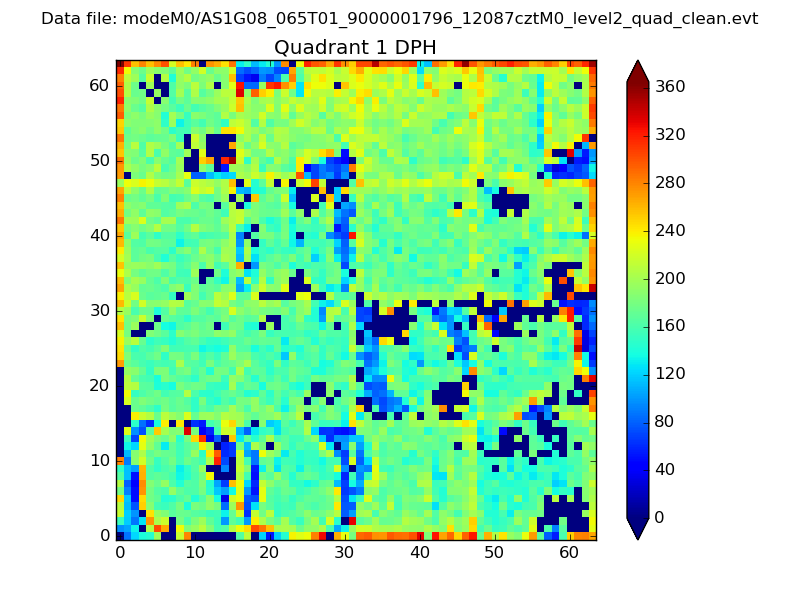 |
Quadrant B |
|---|---|---|---|
| Quadrant D | 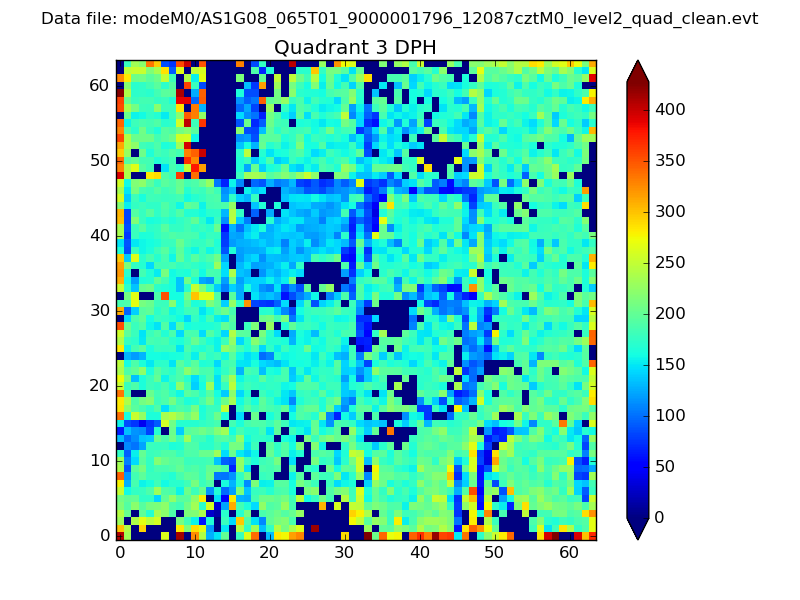 |
 |
Quadrant C |
| Plot type | Count rate plots | Images |
|---|---|---|
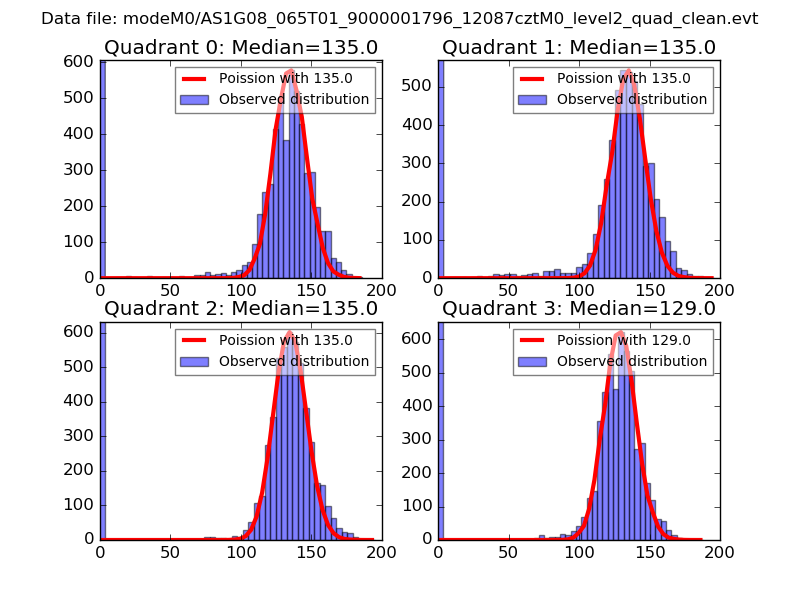
| Comparison with Poisson distribution Blue bars denote a histogram of data divided into 1 sec bins. Red curve is a Poisson curve with rate = median count rate of data. |
 |
 |
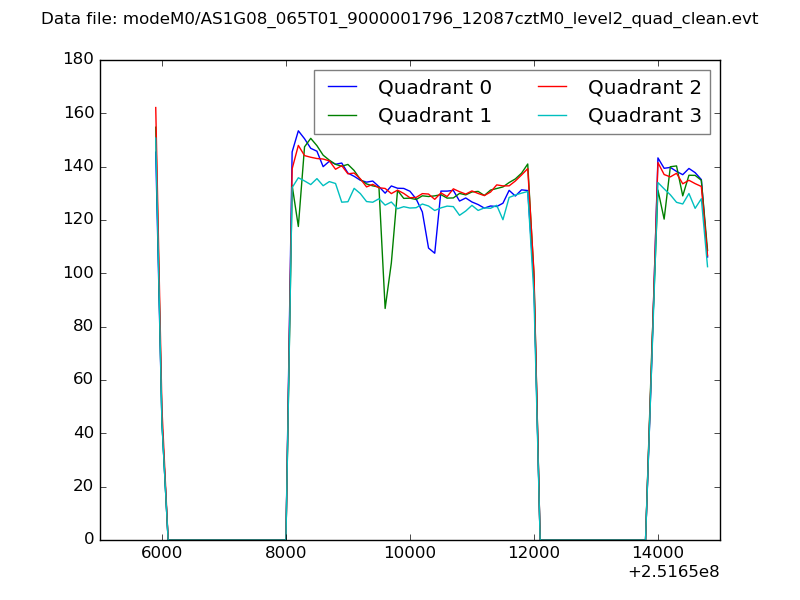
| Quadrant-wise count rates Data is divided into 100 sec bins |
 |
|
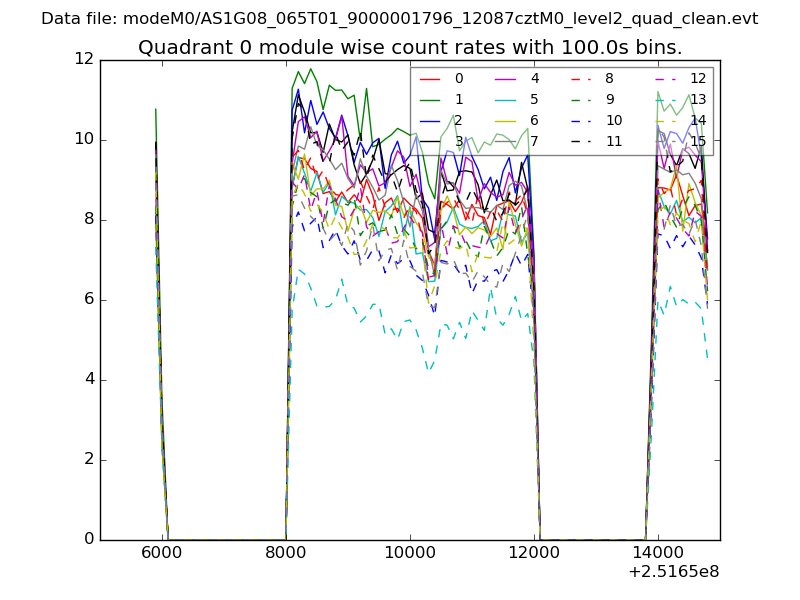
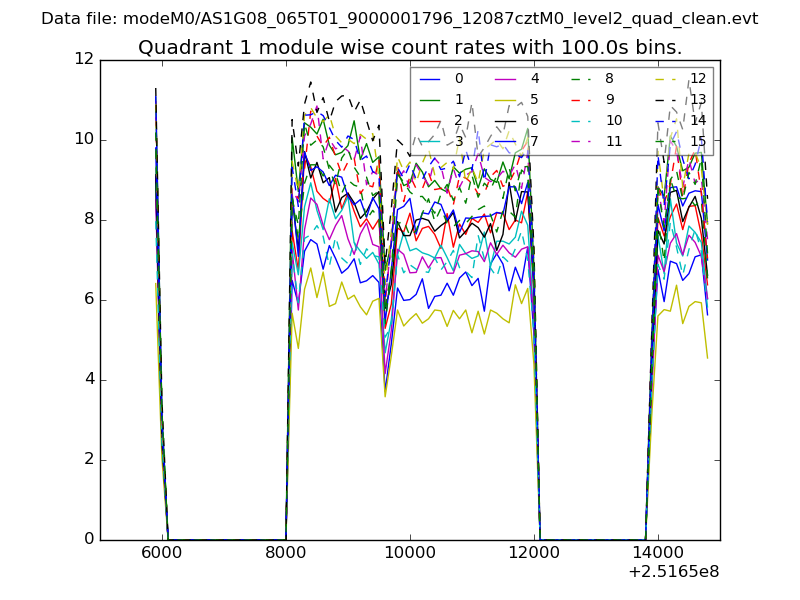
| Module-wise count rates for Quadrant A Data is divided into 100 sec bins |
 |
 |
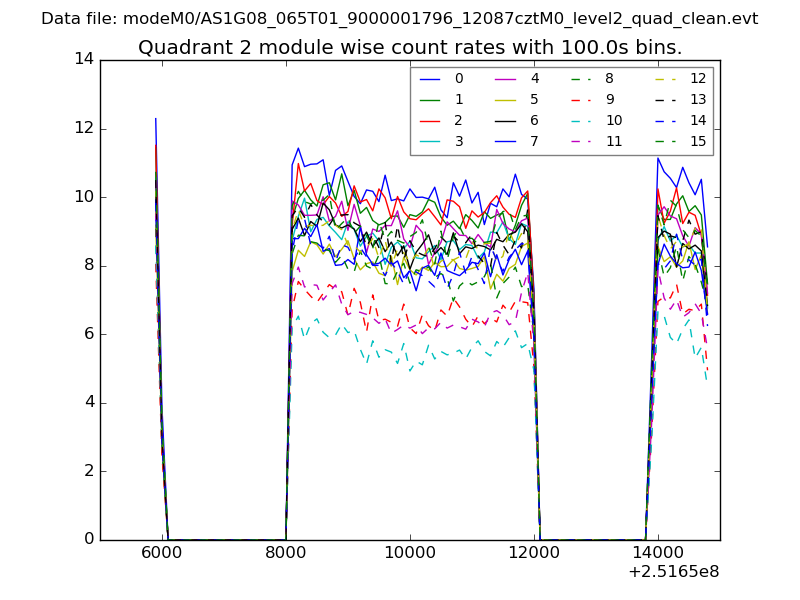
| Module-wise count rates for Quadrant B Data is divided into 100 sec bins |
 |
 |
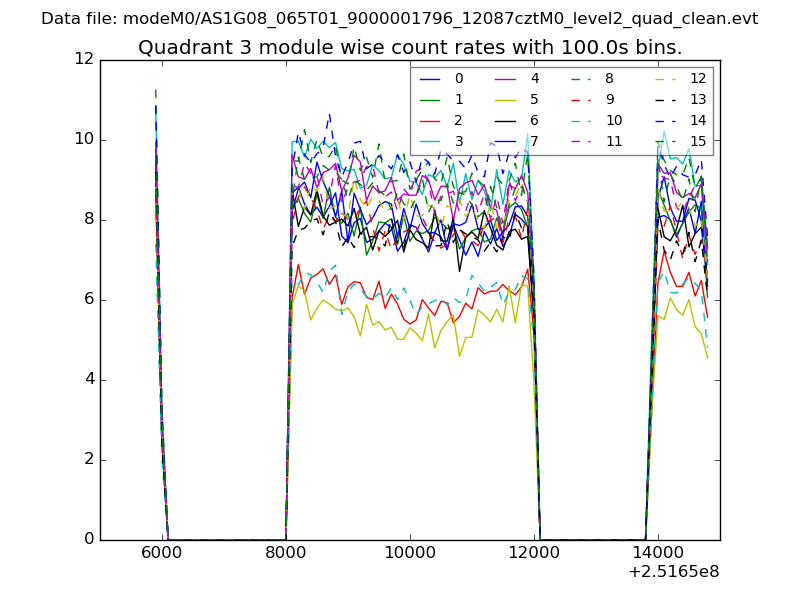
| Module-wise count rates for Quadrant C Data is divided into 100 sec bins |
 |
 |
| Module-wise count rates for Quadrant D Data is divided into 100 sec bins |
 |
 |
| Parameter | Plot |
|---|---|
| CZT HV Monitor | 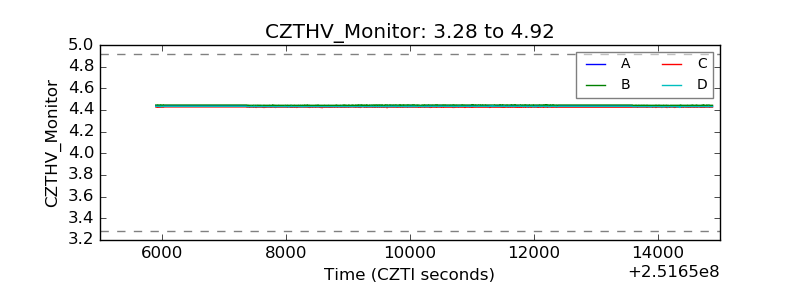 |
| D_VDD | 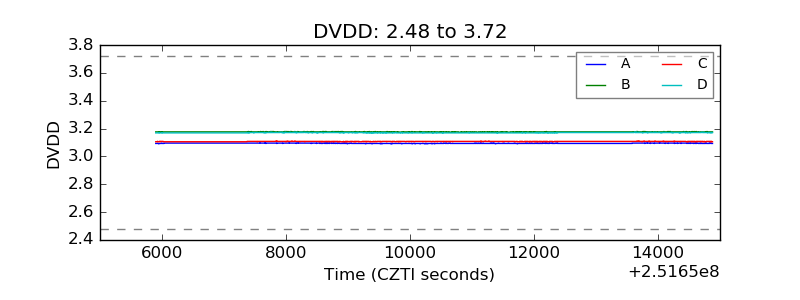 |
| Temperature 1 | 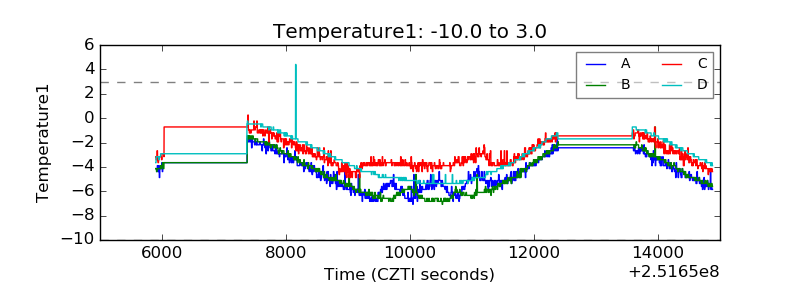 |
| Veto HV Monitor | 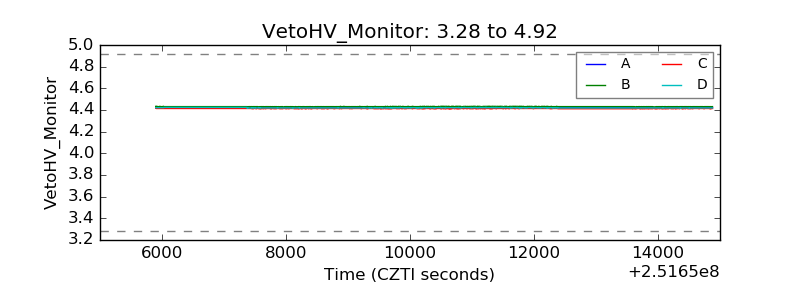 |
| Veto LLD | 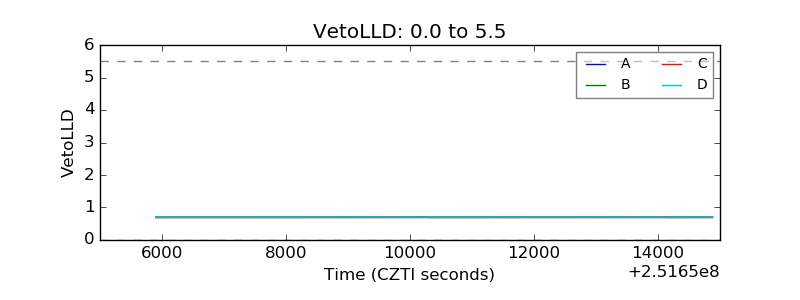 |
| Alpha Counter | 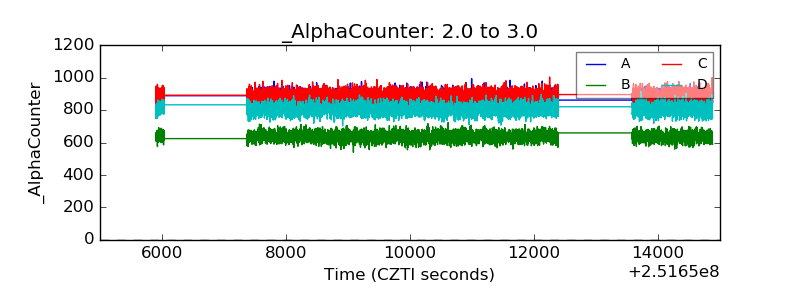 |
| _CPM_Rate | 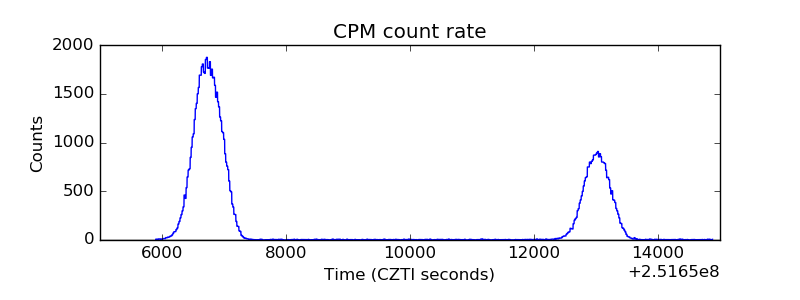 |
| CZT Counter | 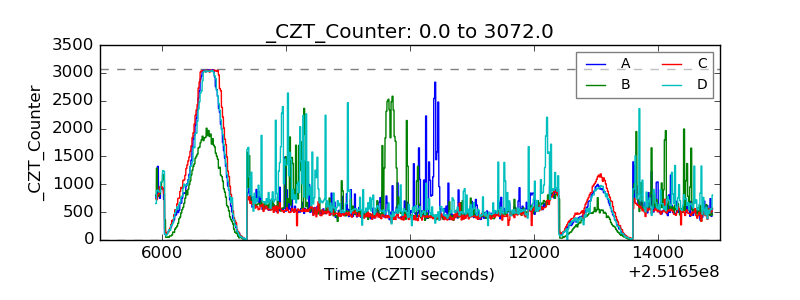 |
| +2.5 Volts monitor |  |
| +5 Volts monitor | 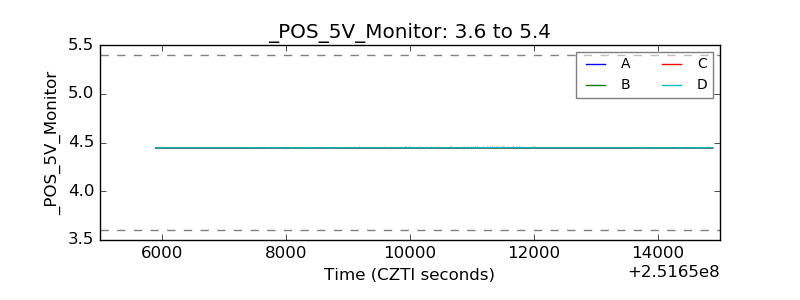 |
| _ROLL_ROT | 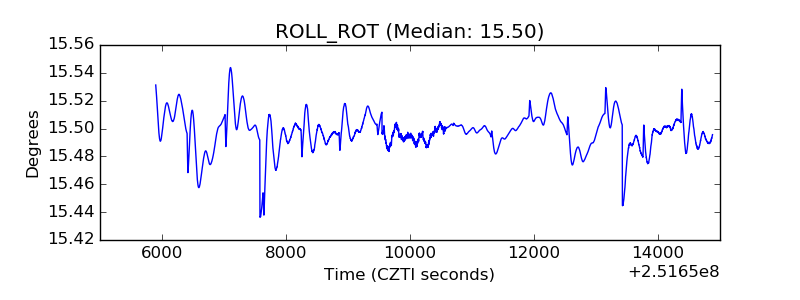 |
| _Roll_DEC | 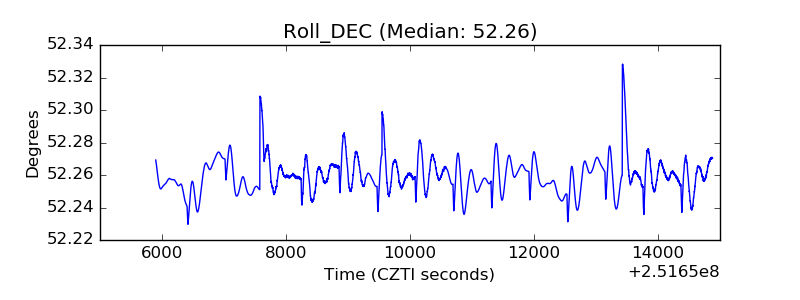 |
| _Roll_RA | 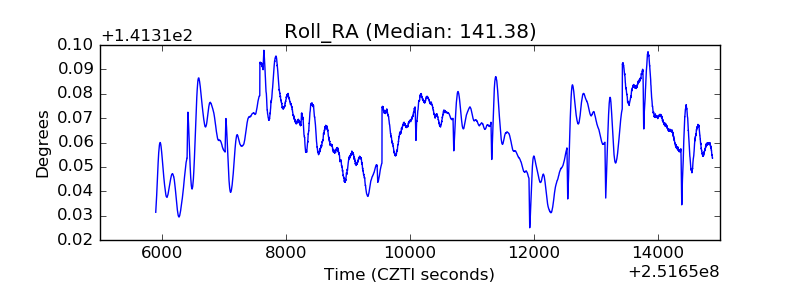 |
| Veto Counter | 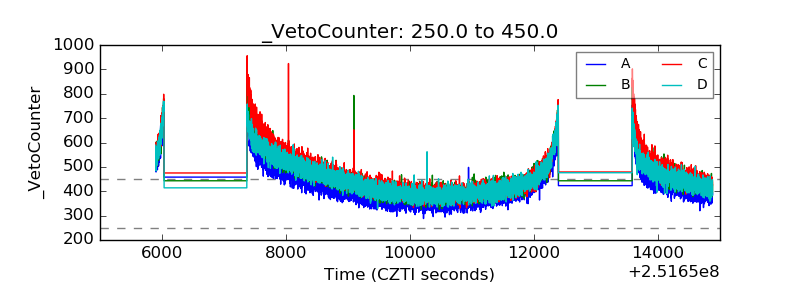 |