| Param | Original file | Final file |
|---|---|---|
| Filename | modeM0/AS1G08_065T01_9000001796_12088cztM0_level2.evt | modeM0/AS1G08_065T01_9000001796_12088cztM0_level2_quad_clean.evt |
| Size (bytes) | 527,261,760 | 103,930,560 |
| Size | 502.8 MB | 99.1 MB |
| Events in quadrant A | 3,649,784 | 681,396 |
| Events in quadrant B | 4,179,147 | 675,817 |
| Events in quadrant C | 3,131,258 | 679,272 |
| Events in quadrant D | 4,553,538 | 644,155 |
| Mode M0 | |||
|---|---|---|---|
| Quadrant | BADHDUFLAG | Total packets | Discarded packets |
| A | 0 | 15356 | 3 |
| B | 0 | 16847 | 2 |
| C | 0 | 13865 | 2 |
| D | 0 | 18074 | 2 |
| Mode M9 | |||
|---|---|---|---|
| Quadrant | BADHDUFLAG | Total packets | Discarded packets |
| A | 0 | 22 | 0 |
| B | 0 | 22 | 0 |
| C | 0 | 22 | 0 |
| D | 0 | 22 | 0 |
| Mode SS | |||
|---|---|---|---|
| Quadrant | BADHDUFLAG | Total packets | Discarded packets |
| A | 0 | 136 | 0 |
| B | 0 | 136 | 0 |
| C | 0 | 136 | 0 |
| D | 0 | 136 | 0 |
| Quadrant | Total seconds | Saturated seconds | Saturation percentage |
|---|---|---|---|
| A | 6705 | 210 | 3.131991% |
| B | 6705 | 348 | 5.190157% |
| C | 6705 | 81 | 1.208054% |
| D | 6705 | 224 | 3.340790% |
Noise dominated data is calculated using 1-second bins in cleaned event files. If a bin has >2000 counts, and if more than 50% of those come from <1% of pixels, then it is considered to be noise-dominated and hence unusable.
| Quadrant | # 1 sec bins | Bins with >0 counts | Bins with >2000 counts | High rate bins dominated by noise | Noise dominated (total time) | Noise dominated (detector-on time) | Marked lightcurve |
|---|---|---|---|---|---|---|---|
| A | 8836 | 6707 | 36 | 36 | 0.41% | 0.54% | 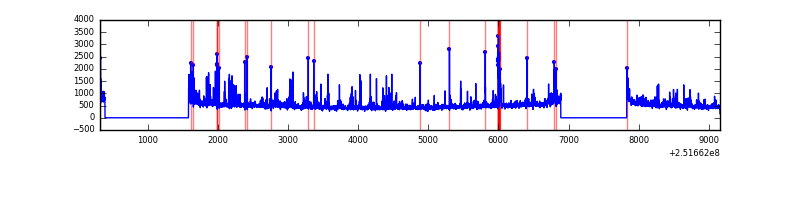 |
| B | 8836 | 6707 | 103 | 103 | 1.17% | 1.54% | 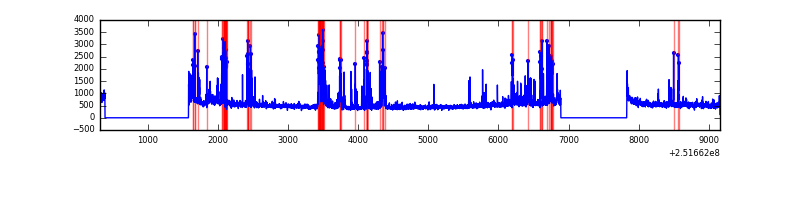 |
| C | 8836 | 6708 | 0 | 0 | 0.00% | 0.00% |  |
| D | 8836 | 6708 | 113 | 113 | 1.28% | 1.68% | 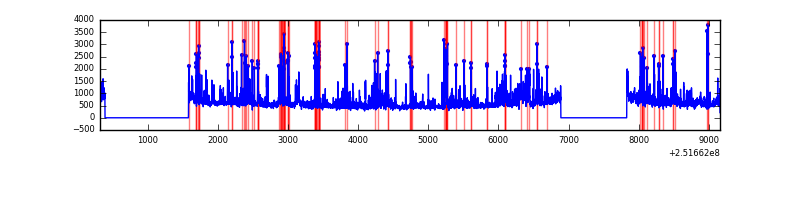 |
Top three noisy pixels from each quadrant. If the there are fewer than three noisy pixels in the level2.evt file, extra rows are filled as -1
| Pixel properties | Quadrant properties | ||||||
|---|---|---|---|---|---|---|---|
| Quadrant | DetID | PixID | Counts | Sigma | Mean | Median | Sigma |
| A | 1 | 162 | 181134 | 1098.02 | 810 | 794 | 164.2 |
| A | 13 | 251 | 139697 | 845.73 | 810 | 794 | 164.2 |
| A | 1 | 178 | 63547 | 382.08 | 810 | 794 | 164.2 |
| B | 4 | 239 | 848022 | 5612.9 | 806 | 786 | 150.9 |
| B | 15 | 204 | 141857 | 934.59 | 806 | 786 | 150.9 |
| B | 12 | 111 | 16820 | 106.22 | 806 | 786 | 150.9 |
| C | 8 | 208 | 6627 | 31.56 | 800 | 802 | 184.6 |
| C | 13 | 61 | 5866 | 27.44 | 800 | 802 | 184.6 |
| C | 12 | 4 | 3282 | 13.44 | 800 | 802 | 184.6 |
| D | 1 | 52 | 442336 | 2354.24 | 788 | 767 | 187.6 |
| D | 8 | 195 | 352311 | 1874.27 | 788 | 767 | 187.6 |
| D | 14 | 34 | 267151 | 1420.23 | 788 | 767 | 187.6 |
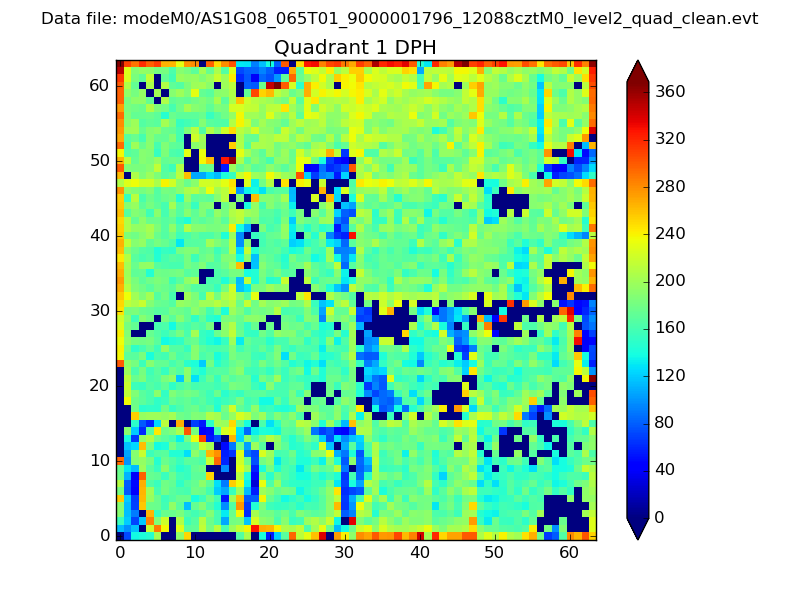
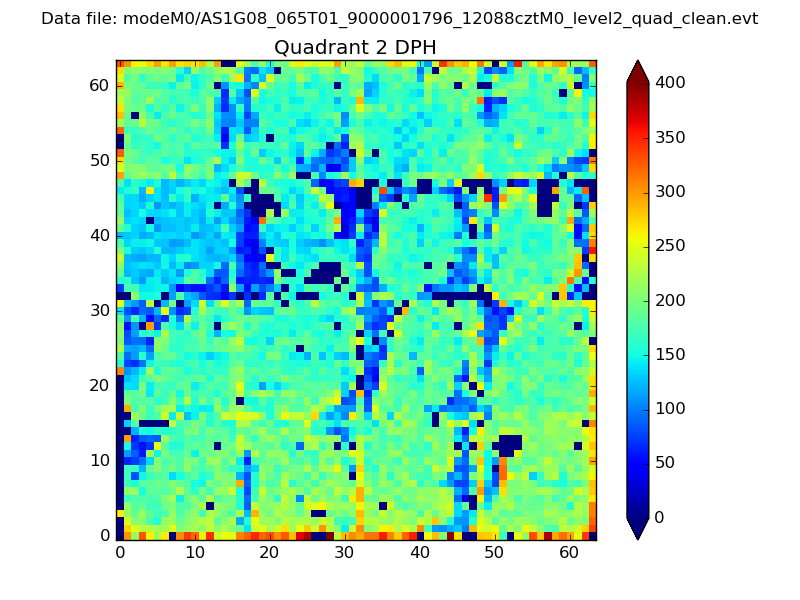
Histogram calculated using DETX and DETY for each event in the final _common_clean file
| Quadrant A |  |
 |
Quadrant B |
|---|---|---|---|
| Quadrant D | 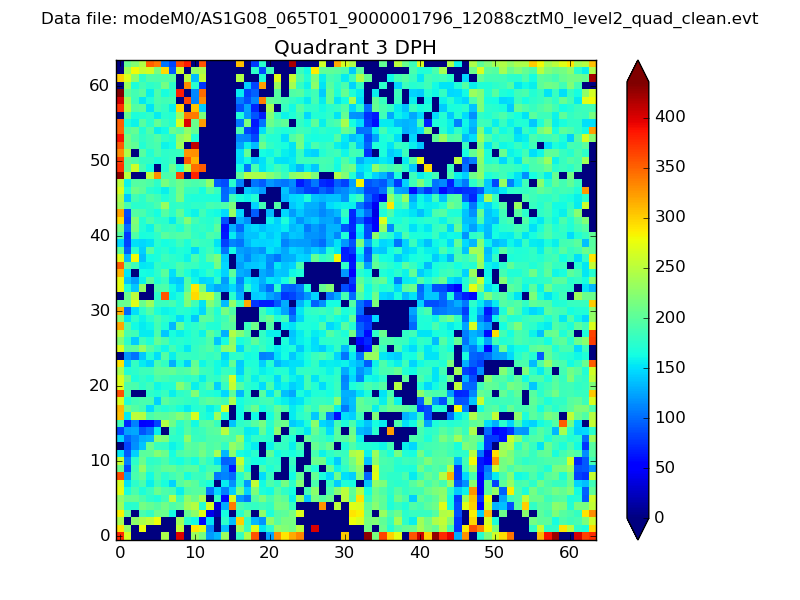 |
 |
Quadrant C |
| Plot type | Count rate plots | Images |
|---|---|---|
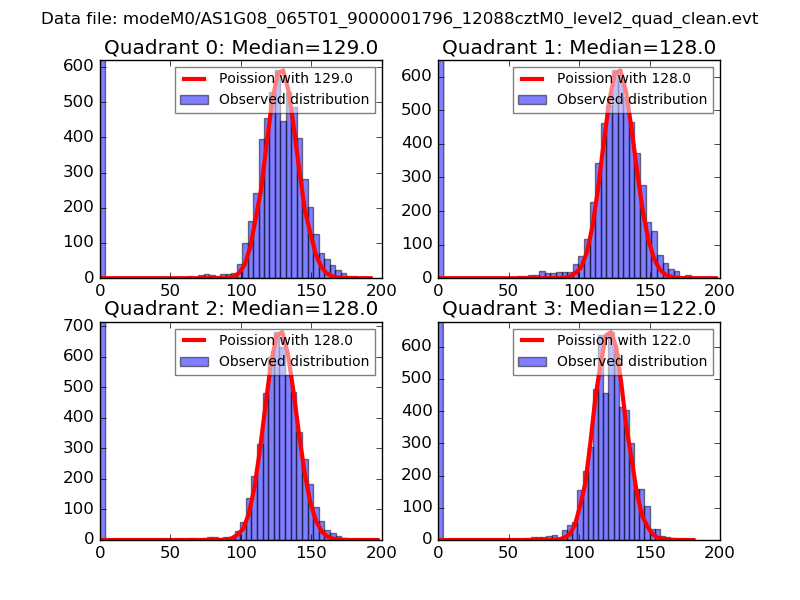
| Comparison with Poisson distribution Blue bars denote a histogram of data divided into 1 sec bins. Red curve is a Poisson curve with rate = median count rate of data. |
 |
 |
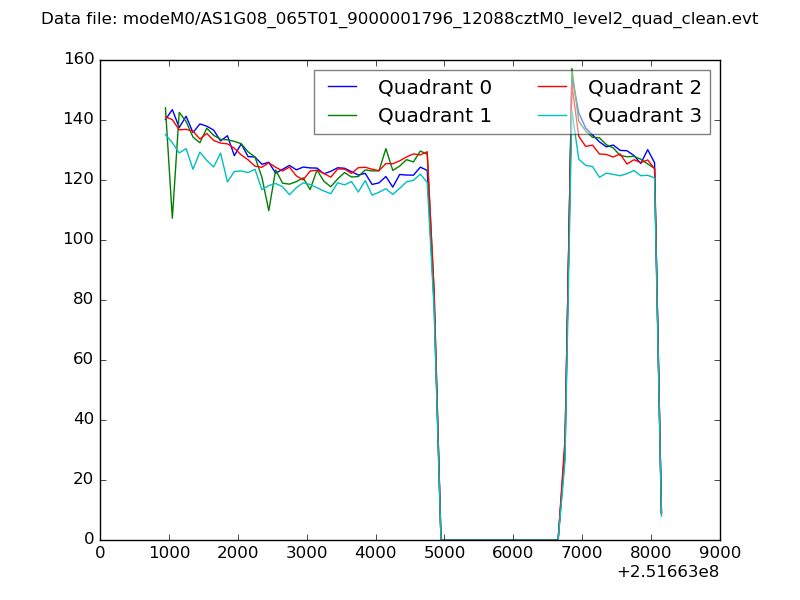
| Quadrant-wise count rates Data is divided into 100 sec bins |
 |
|
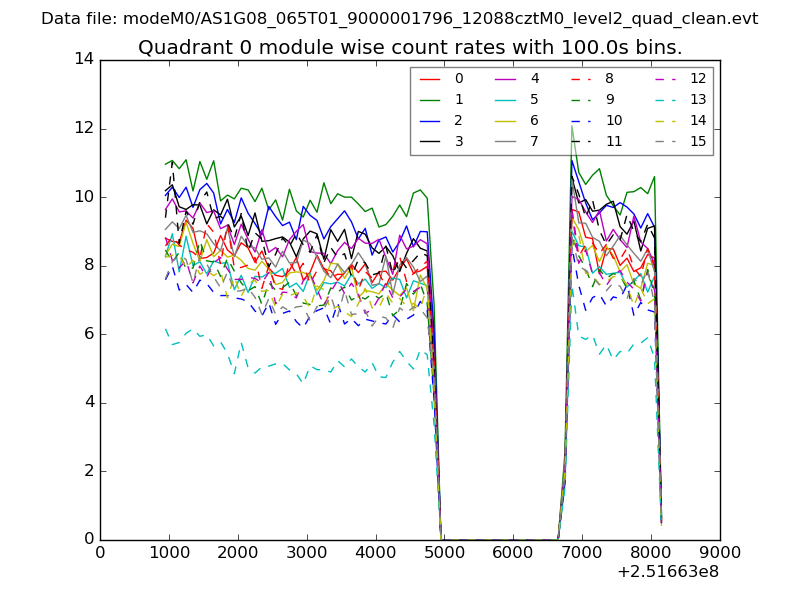
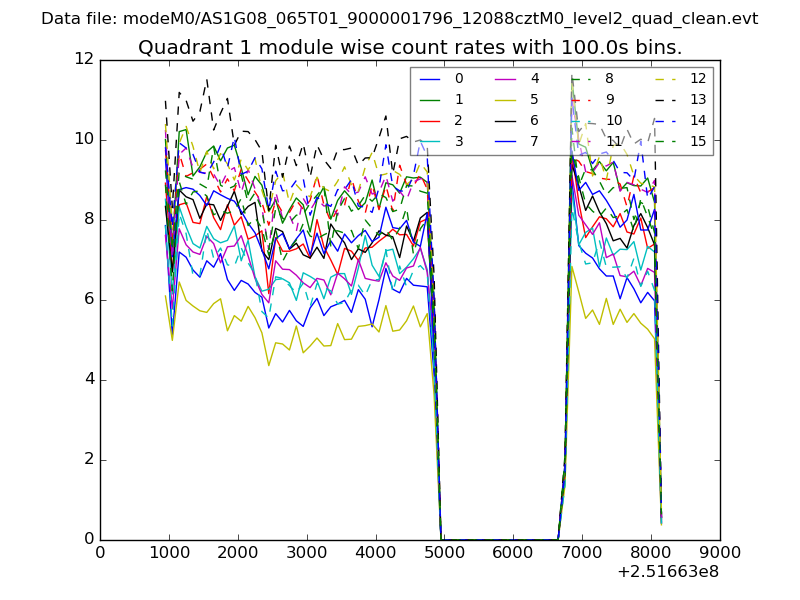
| Module-wise count rates for Quadrant A Data is divided into 100 sec bins |
 |
 |
| Module-wise count rates for Quadrant B Data is divided into 100 sec bins |
 |
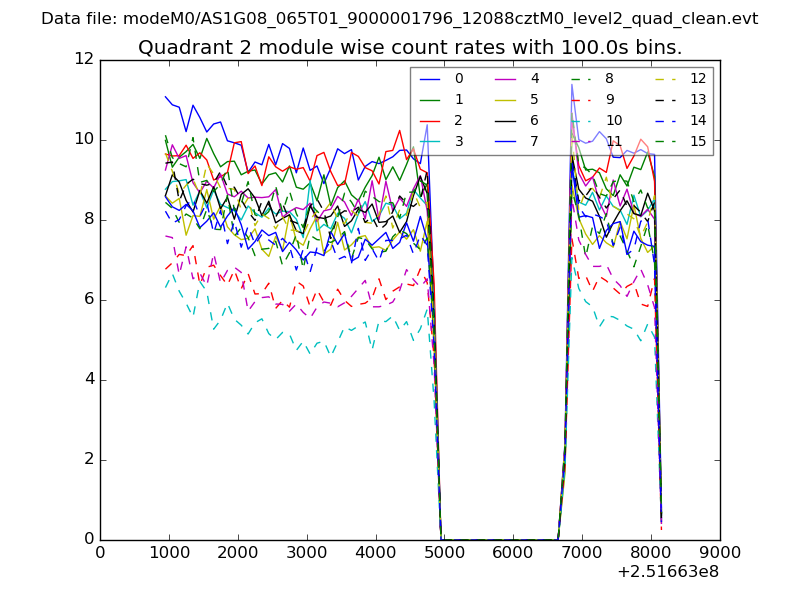
 |
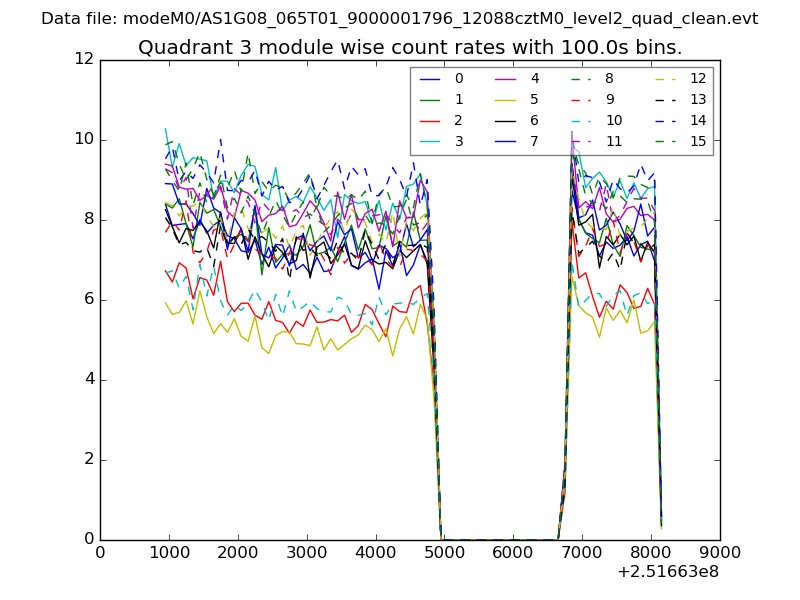
| Module-wise count rates for Quadrant C Data is divided into 100 sec bins |
 |
 |
| Module-wise count rates for Quadrant D Data is divided into 100 sec bins |
 |
 |
| Parameter | Plot |
|---|---|
| CZT HV Monitor | 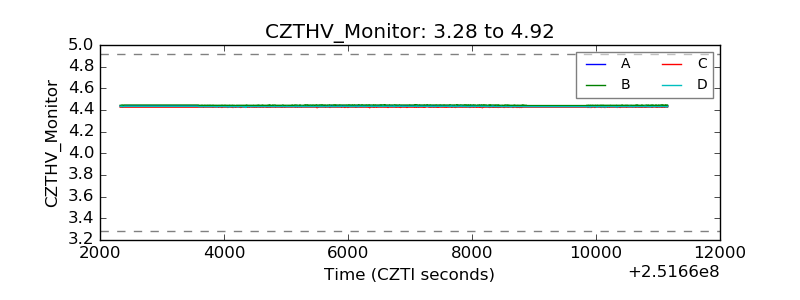 |
| D_VDD | 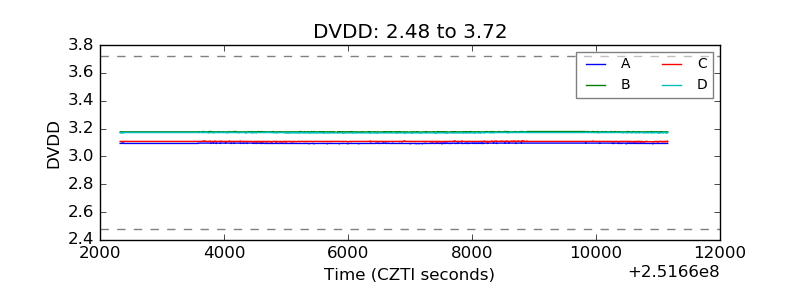 |
| Temperature 1 | 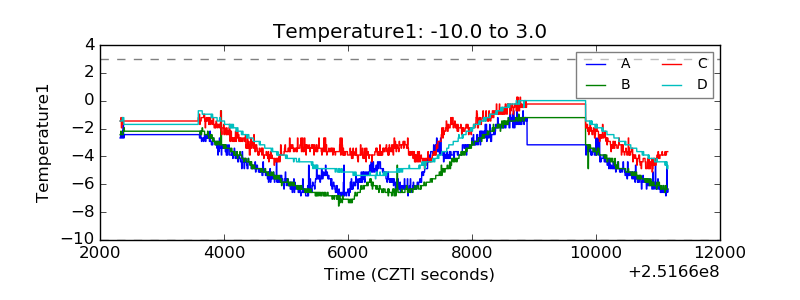 |
| Veto HV Monitor |  |
| Veto LLD | 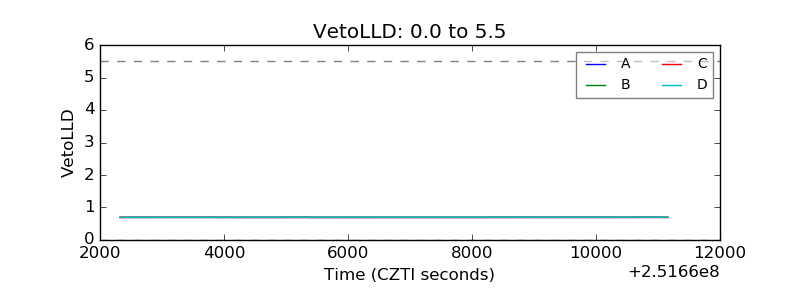 |
| Alpha Counter | 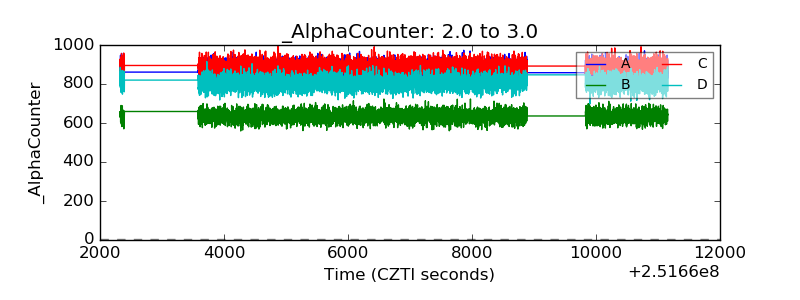 |
| _CPM_Rate | 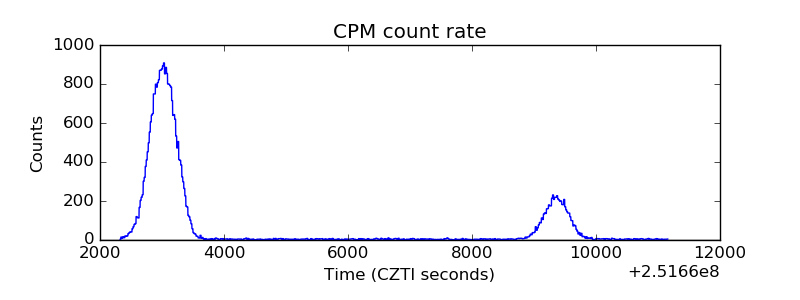 |
| CZT Counter | 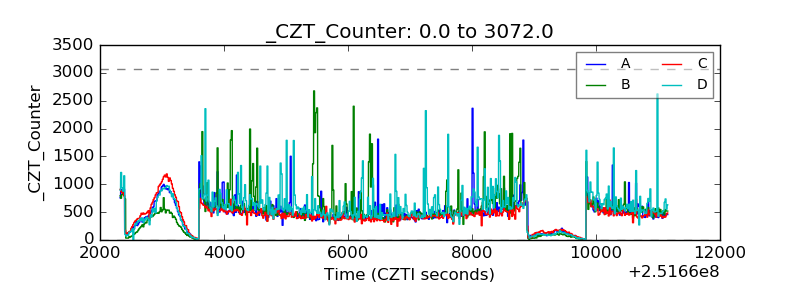 |
| +2.5 Volts monitor |  |
| +5 Volts monitor |  |
| _ROLL_ROT | 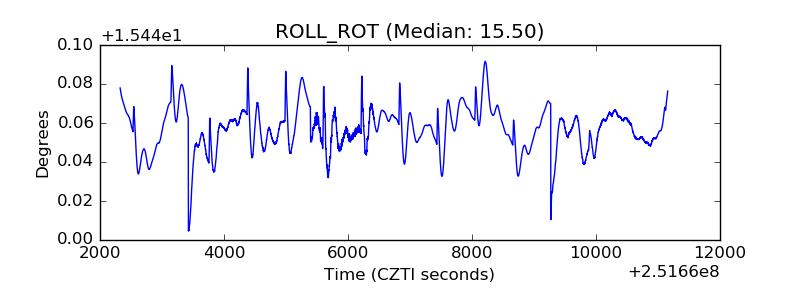 |
| _Roll_DEC | 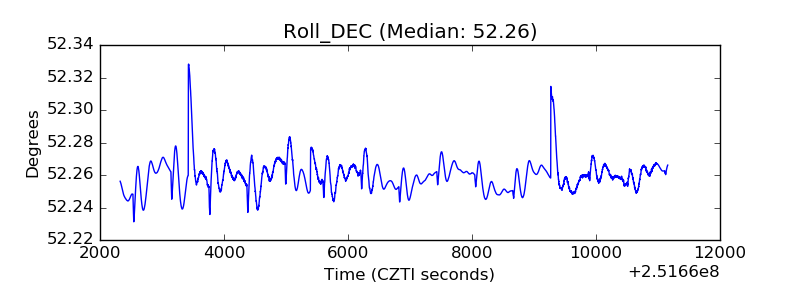 |
| _Roll_RA | 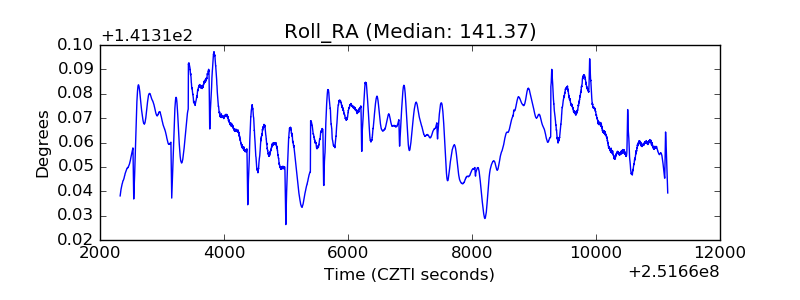 |
| Veto Counter | 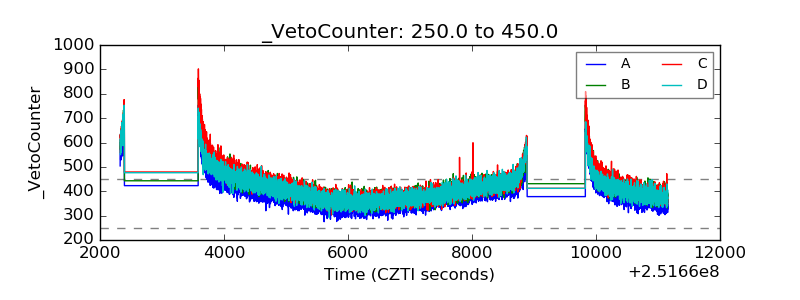 |