| Param | Original file | Final file |
|---|---|---|
| Filename | modeM0/AS1G08_065T01_9000001796_12089cztM0_level2.evt | modeM0/AS1G08_065T01_9000001796_12089cztM0_level2_quad_clean.evt |
| Size (bytes) | 575,176,320 | 102,297,600 |
| Size | 548.5 MB | 97.6 MB |
| Events in quadrant A | 4,107,052 | 661,051 |
| Events in quadrant B | 4,254,187 | 664,723 |
| Events in quadrant C | 3,253,941 | 659,997 |
| Events in quadrant D | 5,322,864 | 617,800 |
| Mode M0 | |||
|---|---|---|---|
| Quadrant | BADHDUFLAG | Total packets | Discarded packets |
| A | 0 | 16990 | 4 |
| B | 0 | 17490 | 3 |
| C | 0 | 14654 | 3 |
| D | 0 | 20672 | 3 |
| Mode M9 | |||
|---|---|---|---|
| Quadrant | BADHDUFLAG | Total packets | Discarded packets |
| A | 0 | 7 | 0 |
| B | 0 | 7 | 0 |
| C | 0 | 7 | 0 |
| D | 0 | 8 | 0 |
| Mode SS | |||
|---|---|---|---|
| Quadrant | BADHDUFLAG | Total packets | Discarded packets |
| A | 0 | 144 | 0 |
| B | 0 | 144 | 0 |
| C | 0 | 144 | 0 |
| D | 0 | 144 | 0 |
| Quadrant | Total seconds | Saturated seconds | Saturation percentage |
|---|---|---|---|
| A | 7101 | 180 | 2.534854% |
| B | 7101 | 244 | 3.436136% |
| C | 7101 | 32 | 0.450641% |
| D | 7101 | 445 | 6.266723% |
Noise dominated data is calculated using 1-second bins in cleaned event files. If a bin has >2000 counts, and if more than 50% of those come from <1% of pixels, then it is considered to be noise-dominated and hence unusable.
| Quadrant | # 1 sec bins | Bins with >0 counts | Bins with >2000 counts | High rate bins dominated by noise | Noise dominated (total time) | Noise dominated (detector-on time) | Marked lightcurve |
|---|---|---|---|---|---|---|---|
| A | 7602 | 7104 | 49 | 49 | 0.64% | 0.69% | 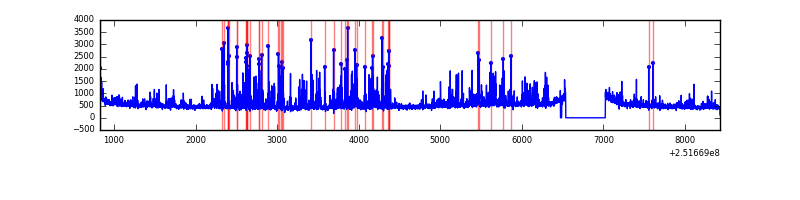 |
| B | 7602 | 7104 | 102 | 102 | 1.34% | 1.44% | 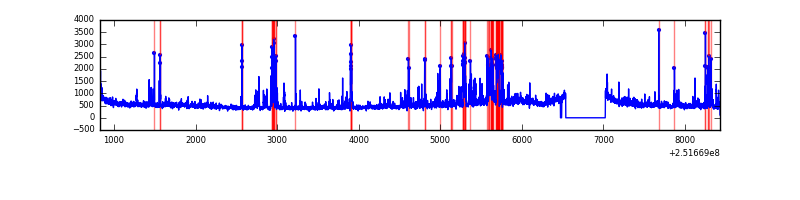 |
| C | 7602 | 7104 | 0 | 0 | 0.00% | 0.00% | 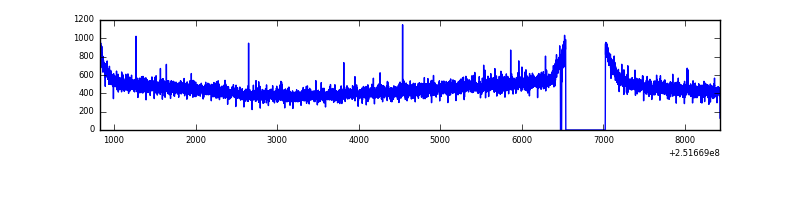 |
| D | 7602 | 7104 | 320 | 320 | 4.21% | 4.50% | 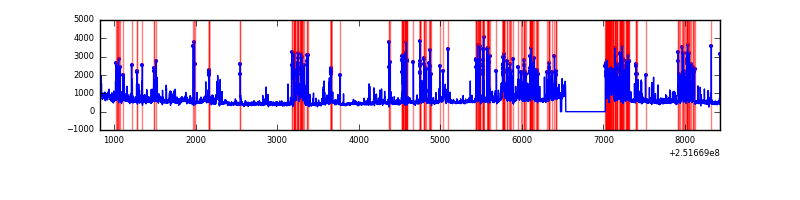 |
Top three noisy pixels from each quadrant. If the there are fewer than three noisy pixels in the level2.evt file, extra rows are filled as -1
| Pixel properties | Quadrant properties | ||||||
|---|---|---|---|---|---|---|---|
| Quadrant | DetID | PixID | Counts | Sigma | Mean | Median | Sigma |
| A | 13 | 251 | 447179 | 2607.59 | 842 | 826 | 171.2 |
| A | 1 | 162 | 156550 | 909.74 | 842 | 826 | 171.2 |
| A | 1 | 178 | 76260 | 440.69 | 842 | 826 | 171.2 |
| B | 4 | 239 | 685575 | 4269.36 | 844 | 822 | 160.4 |
| B | 15 | 204 | 135301 | 838.46 | 844 | 822 | 160.4 |
| B | 11 | 51 | 90253 | 557.59 | 844 | 822 | 160.4 |
| C | 8 | 208 | 12950 | 63.56 | 827 | 829 | 190.7 |
| C | 13 | 61 | 6167 | 27.99 | 827 | 829 | 190.7 |
| C | 12 | 4 | 5189 | 22.86 | 827 | 829 | 190.7 |
| D | 1 | 52 | 1247925 | 6453.36 | 801 | 778 | 193.3 |
| D | 8 | 195 | 391629 | 2022.46 | 801 | 778 | 193.3 |
| D | 14 | 34 | 142687 | 734.31 | 801 | 778 | 193.3 |
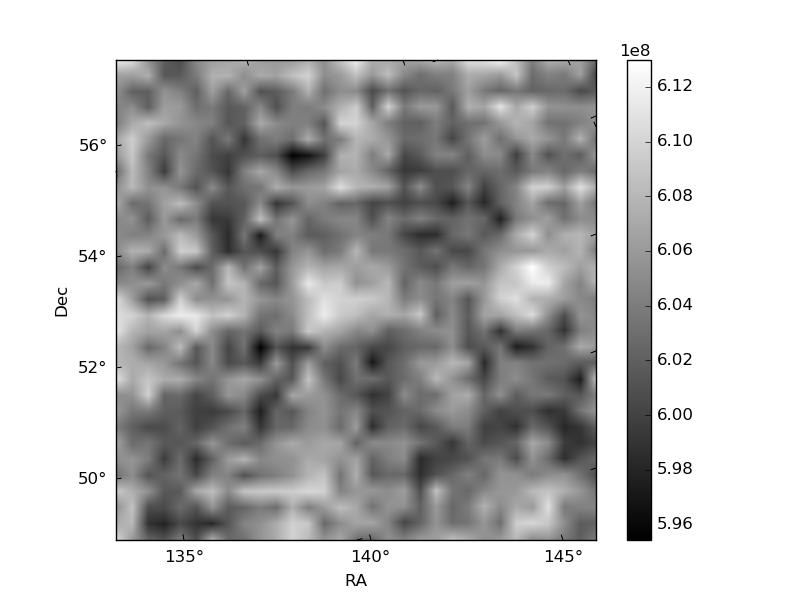
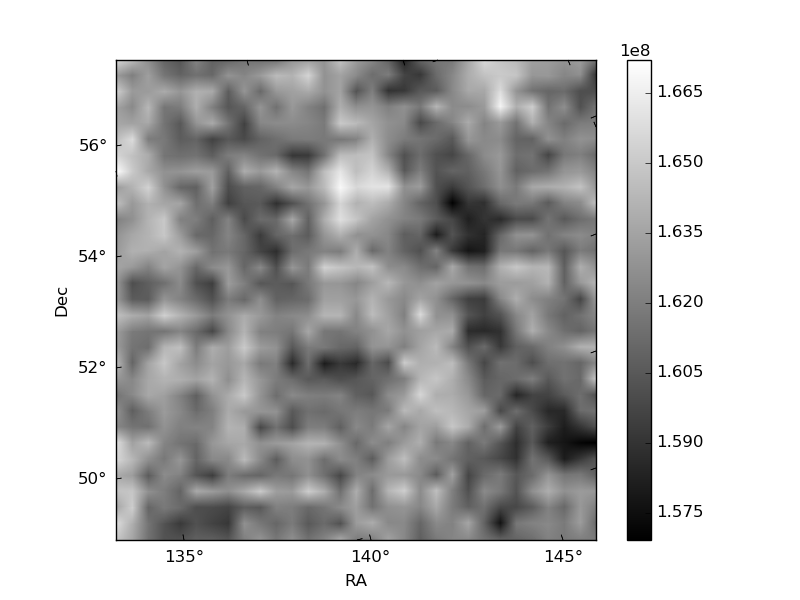
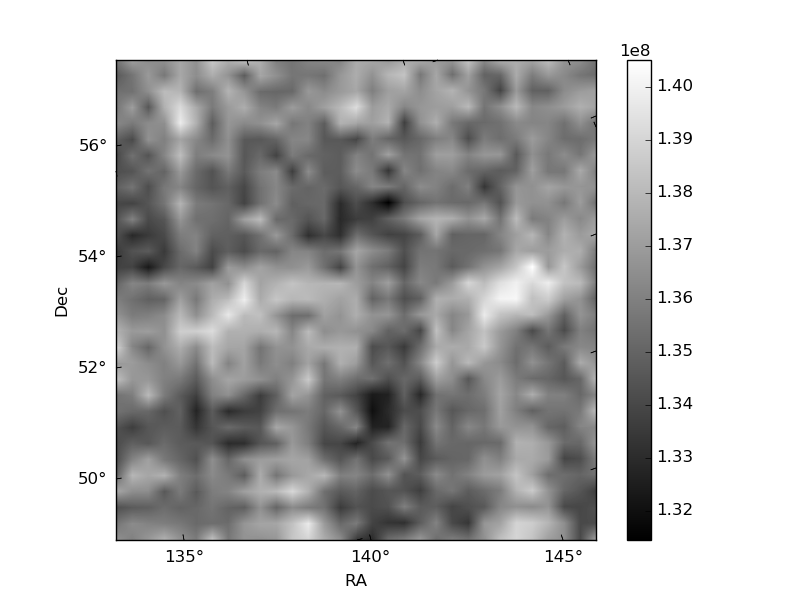
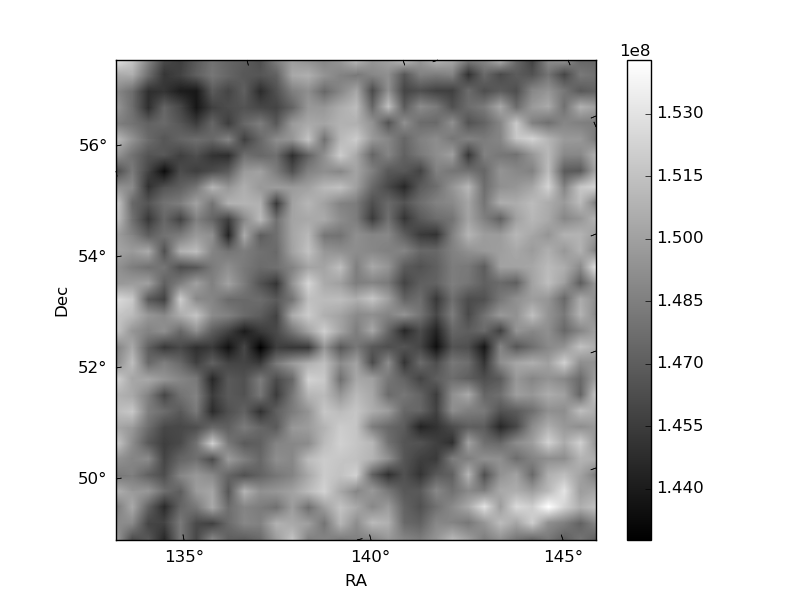
Histogram calculated using DETX and DETY for each event in the final _common_clean file
| Quadrant A | 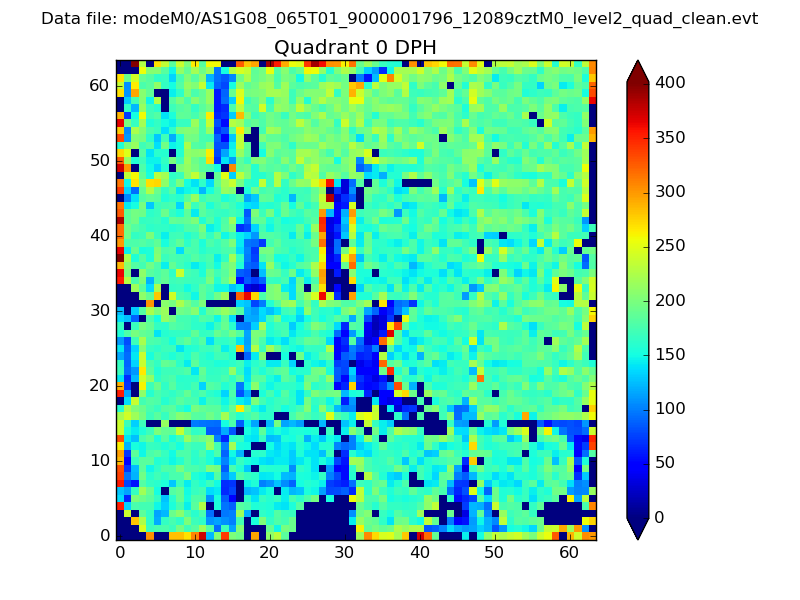 |
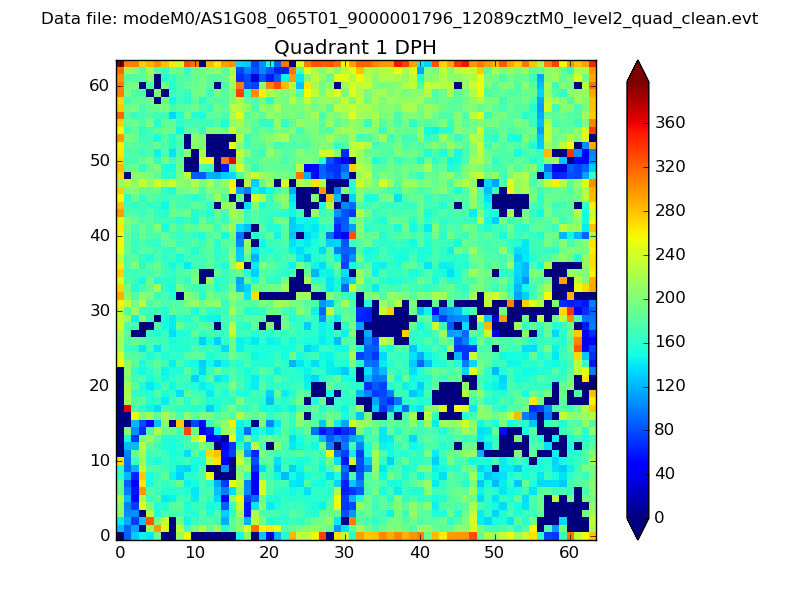 |
Quadrant B |
|---|---|---|---|
| Quadrant D | 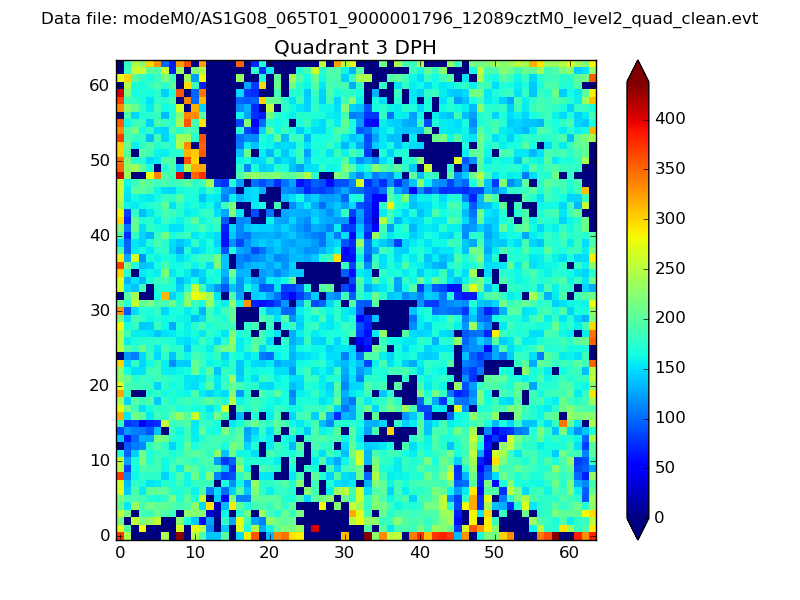 |
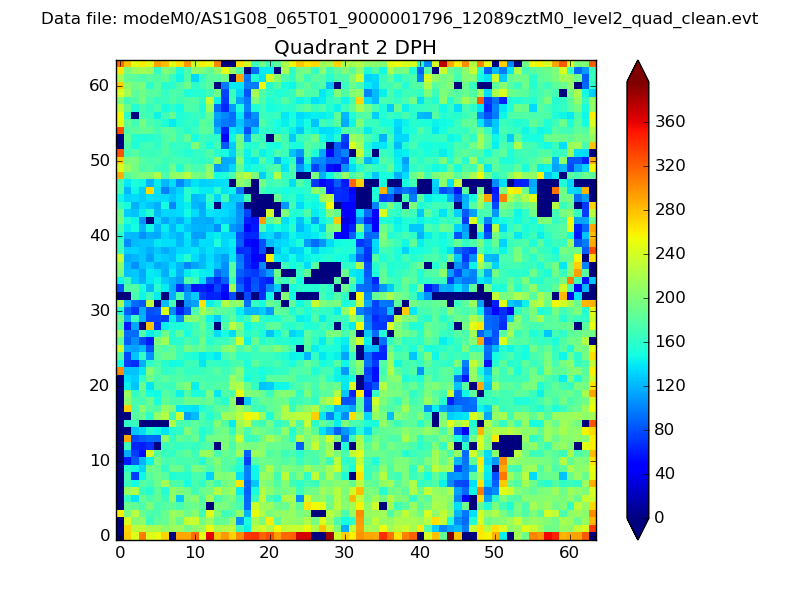 |
Quadrant C |
| Plot type | Count rate plots | Images |
|---|---|---|
| Comparison with Poisson distribution Blue bars denote a histogram of data divided into 1 sec bins. Red curve is a Poisson curve with rate = median count rate of data. |
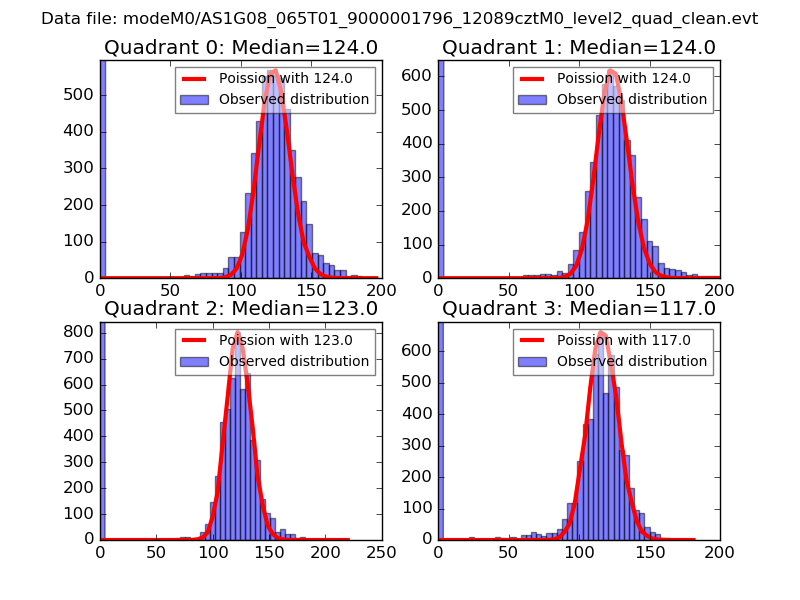 |
 |
| Quadrant-wise count rates Data is divided into 100 sec bins |
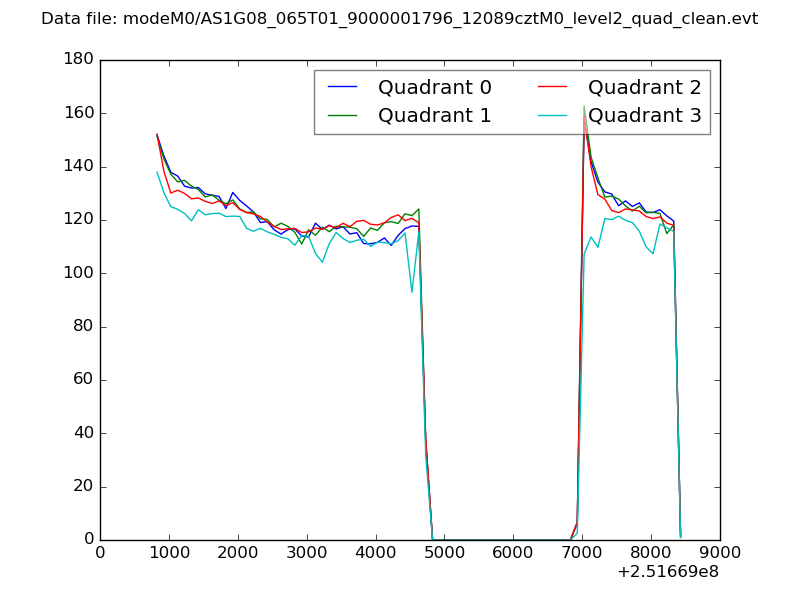 |
|
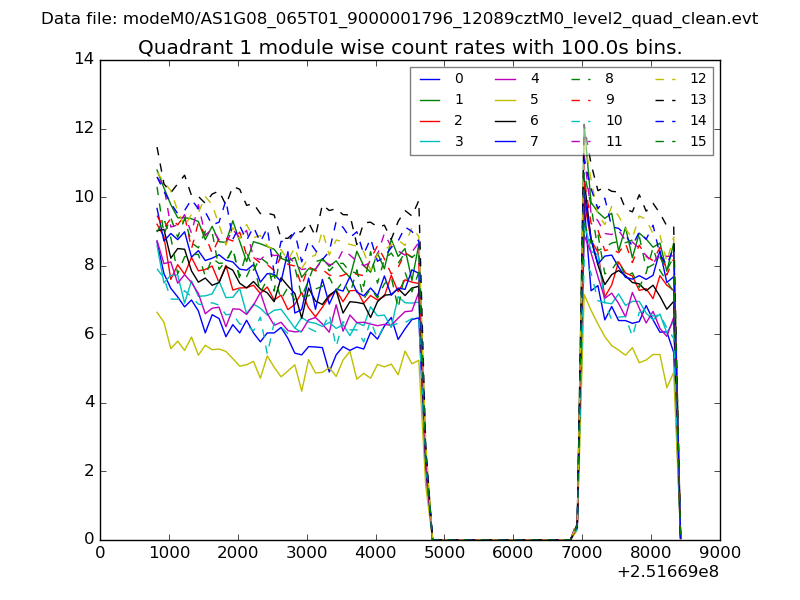
| Module-wise count rates for Quadrant A Data is divided into 100 sec bins |
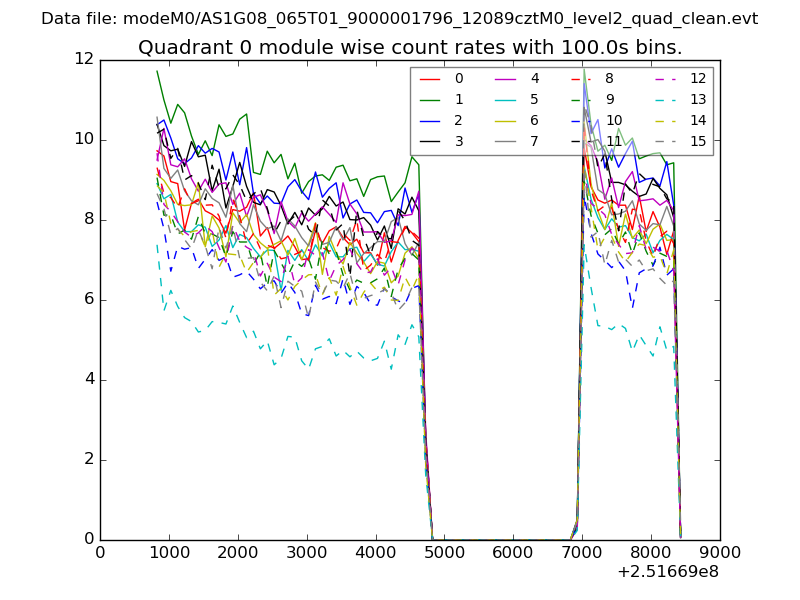 |
 |
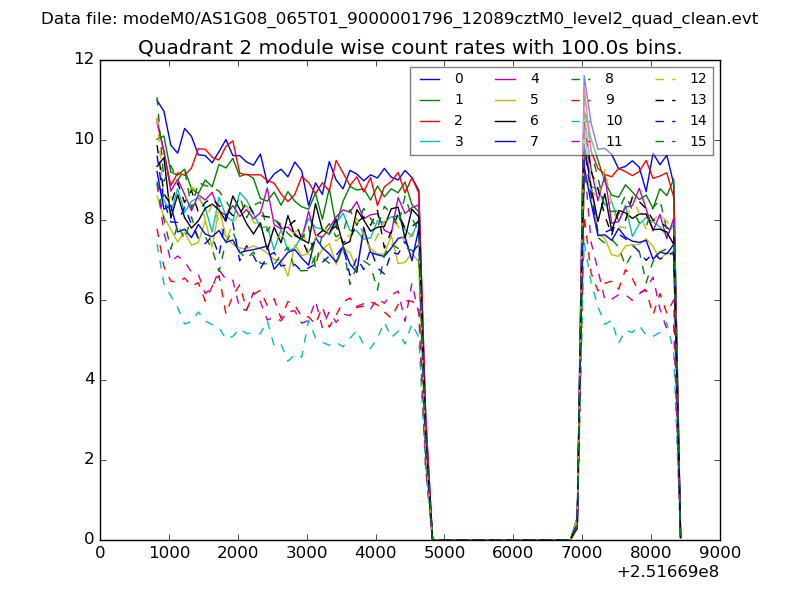
| Module-wise count rates for Quadrant B Data is divided into 100 sec bins |
 |
 |
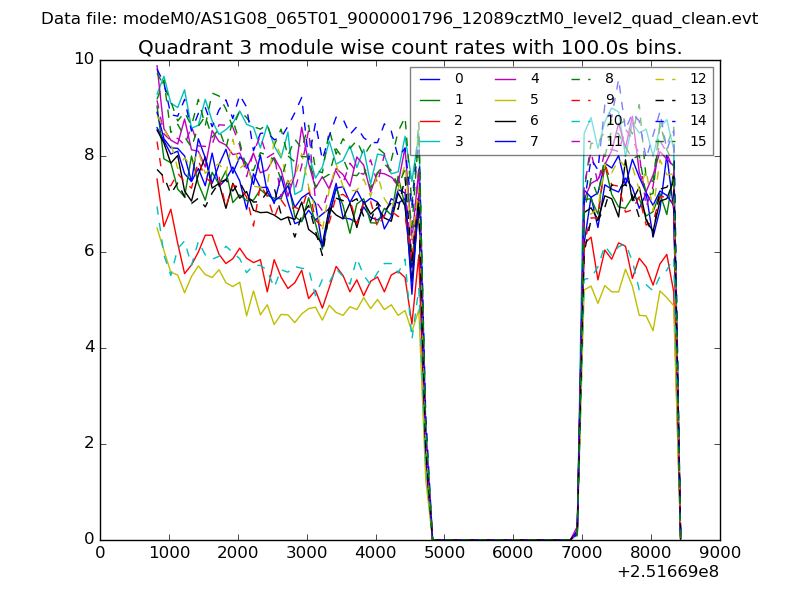
| Module-wise count rates for Quadrant C Data is divided into 100 sec bins |
 |
 |
| Module-wise count rates for Quadrant D Data is divided into 100 sec bins |
 |
 |
| Parameter | Plot |
|---|---|
| CZT HV Monitor | 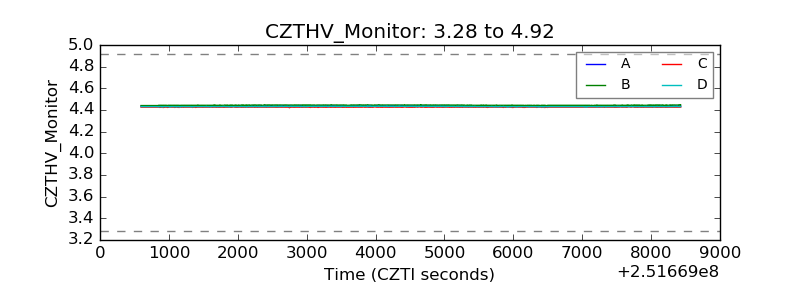 |
| D_VDD |  |
| Temperature 1 | 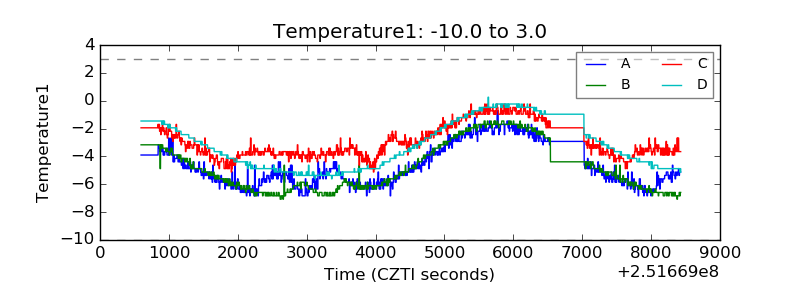 |
| Veto HV Monitor | 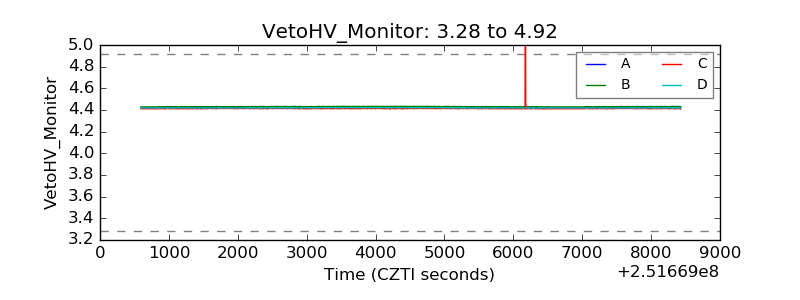 |
| Veto LLD | 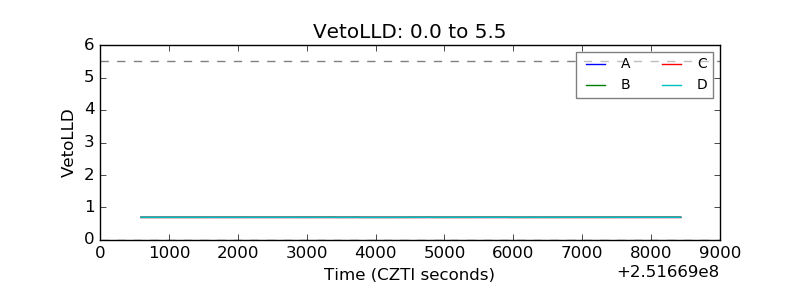 |
| Alpha Counter | 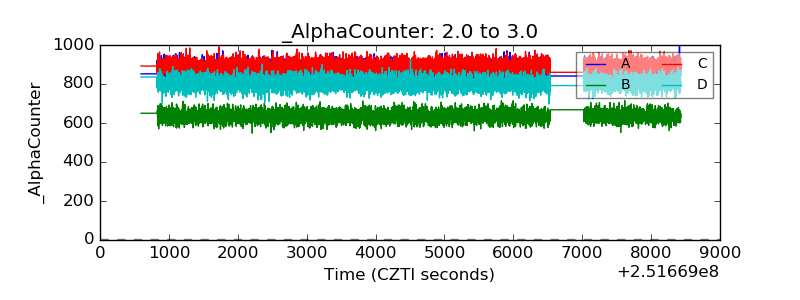 |
| _CPM_Rate | 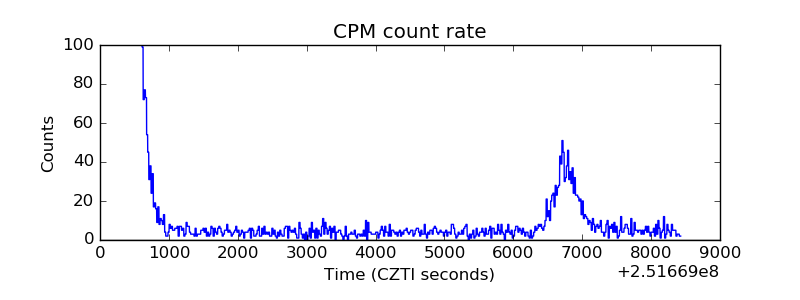 |
| CZT Counter | 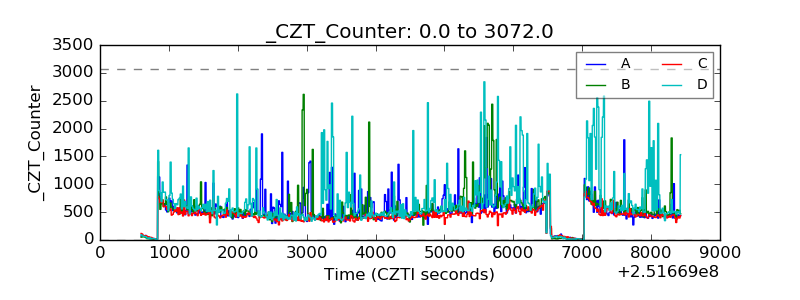 |
| +2.5 Volts monitor |  |
| +5 Volts monitor |  |
| _ROLL_ROT | 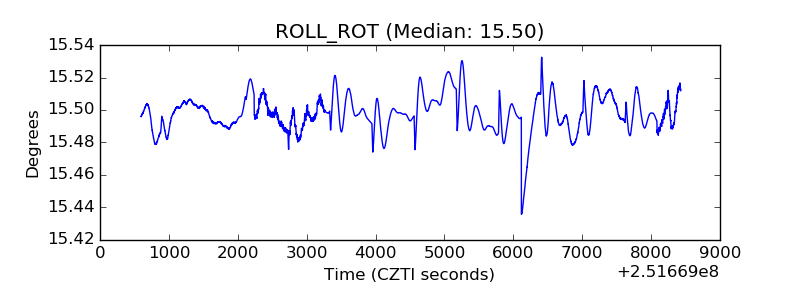 |
| _Roll_DEC | 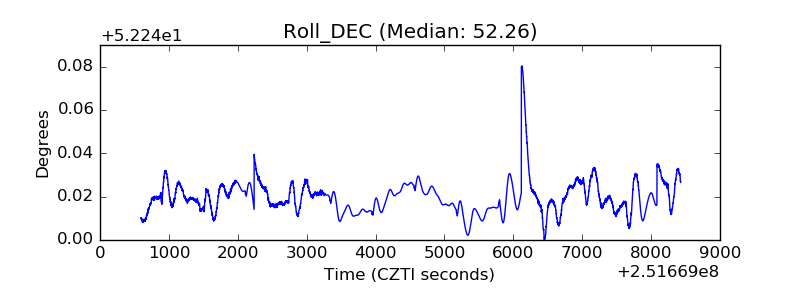 |
| _Roll_RA | 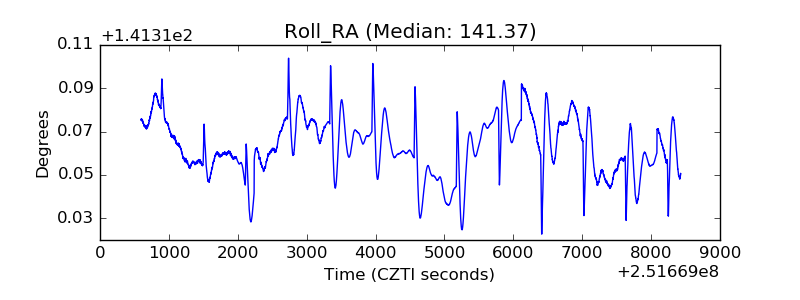 |
| Veto Counter | 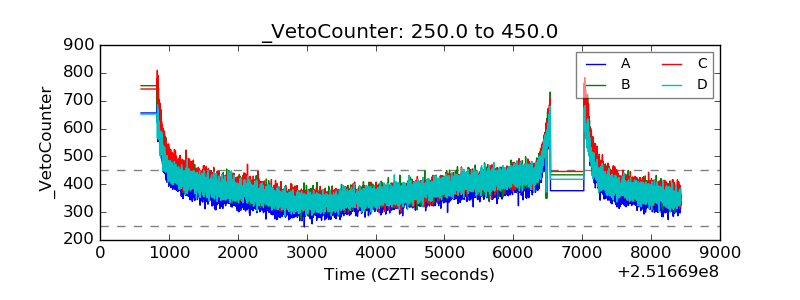 |