| Param | Original file | Final file |
|---|---|---|
| Filename | modeM0/AS1G08_065T01_9000001796_12090cztM0_level2.evt | modeM0/AS1G08_065T01_9000001796_12090cztM0_level2_quad_clean.evt |
| Size (bytes) | 716,284,800 | 111,199,680 |
| Size | 683.1 MB | 106.0 MB |
| Events in quadrant A | 4,930,884 | 705,960 |
| Events in quadrant B | 5,691,842 | 702,181 |
| Events in quadrant C | 4,053,276 | 701,036 |
| Events in quadrant D | 6,435,121 | 661,383 |
| Mode M0 | |||
|---|---|---|---|
| Quadrant | BADHDUFLAG | Total packets | Discarded packets |
| A | 0 | 20545 | 4 |
| B | 0 | 22735 | 3 |
| C | 0 | 18017 | 3 |
| D | 0 | 25013 | 3 |
| Mode M9 | |||
|---|---|---|---|
| Quadrant | BADHDUFLAG | Total packets | Discarded packets |
| A | 0 | 7 | 0 |
| B | 0 | 7 | 0 |
| C | 0 | 7 | 0 |
| D | 0 | 7 | 0 |
| Mode SS | |||
|---|---|---|---|
| Quadrant | BADHDUFLAG | Total packets | Discarded packets |
| A | 0 | 174 | 0 |
| B | 0 | 174 | 0 |
| C | 0 | 174 | 0 |
| D | 0 | 174 | 0 |
| Quadrant | Total seconds | Saturated seconds | Saturation percentage |
|---|---|---|---|
| A | 8603 | 227 | 2.638614% |
| B | 8603 | 454 | 5.277229% |
| C | 8603 | 59 | 0.685807% |
| D | 8603 | 515 | 5.986284% |
Noise dominated data is calculated using 1-second bins in cleaned event files. If a bin has >2000 counts, and if more than 50% of those come from <1% of pixels, then it is considered to be noise-dominated and hence unusable.
| Quadrant | # 1 sec bins | Bins with >0 counts | Bins with >2000 counts | High rate bins dominated by noise | Noise dominated (total time) | Noise dominated (detector-on time) | Marked lightcurve |
|---|---|---|---|---|---|---|---|
| A | 9249 | 8607 | 71 | 71 | 0.77% | 0.82% | 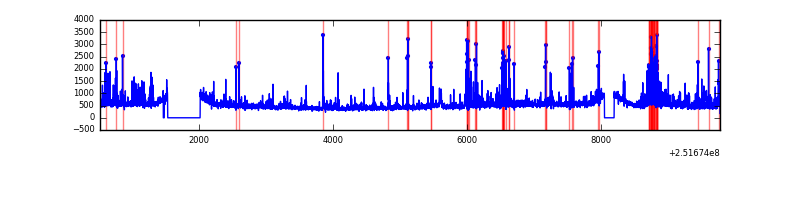 |
| B | 9249 | 8607 | 222 | 222 | 2.40% | 2.58% | 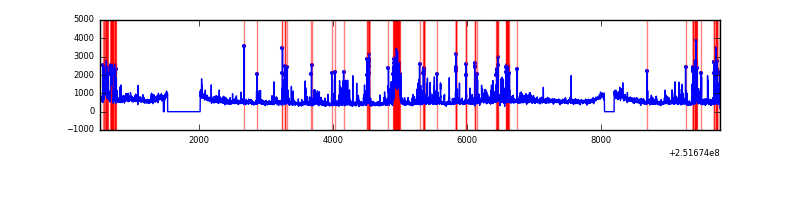 |
| C | 9249 | 8607 | 1 | 1 | 0.01% | 0.01% | 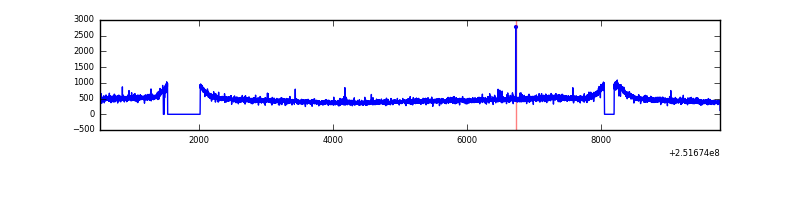 |
| D | 9249 | 8607 | 336 | 336 | 3.63% | 3.90% | 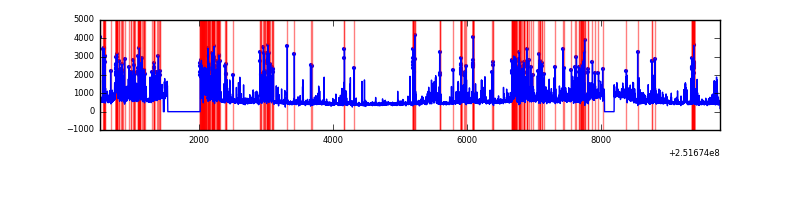 |
Top three noisy pixels from each quadrant. If the there are fewer than three noisy pixels in the level2.evt file, extra rows are filled as -1
| Pixel properties | Quadrant properties | ||||||
|---|---|---|---|---|---|---|---|
| Quadrant | DetID | PixID | Counts | Sigma | Mean | Median | Sigma |
| A | 13 | 251 | 525822 | 2460.41 | 1047 | 1025 | 213.3 |
| A | 1 | 162 | 161950 | 754.47 | 1047 | 1025 | 213.3 |
| A | 1 | 178 | 63270 | 291.82 | 1047 | 1025 | 213.3 |
| B | 4 | 239 | 1201896 | 6035.98 | 1042 | 1017 | 199.0 |
| B | 11 | 51 | 168575 | 842.2 | 1042 | 1017 | 199.0 |
| B | 15 | 204 | 153062 | 764.22 | 1042 | 1017 | 199.0 |
| C | 8 | 208 | 19625 | 78.4 | 1026 | 1027 | 237.2 |
| C | 15 | 208 | 14008 | 54.72 | 1026 | 1027 | 237.2 |
| C | 13 | 61 | 7610 | 27.75 | 1026 | 1027 | 237.2 |
| D | 1 | 52 | 1157482 | 4759.27 | 1000 | 971 | 243.0 |
| D | 8 | 195 | 525795 | 2159.75 | 1000 | 971 | 243.0 |
| D | 14 | 34 | 357183 | 1465.88 | 1000 | 971 | 243.0 |
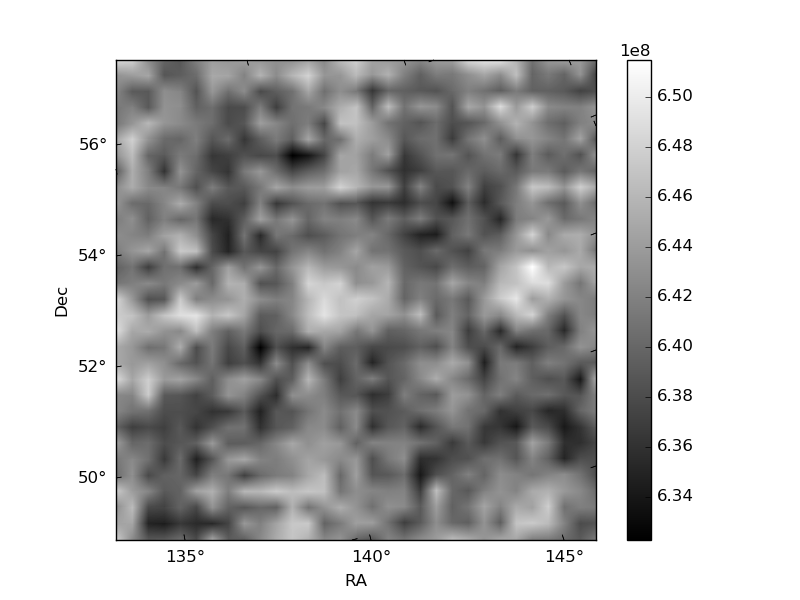
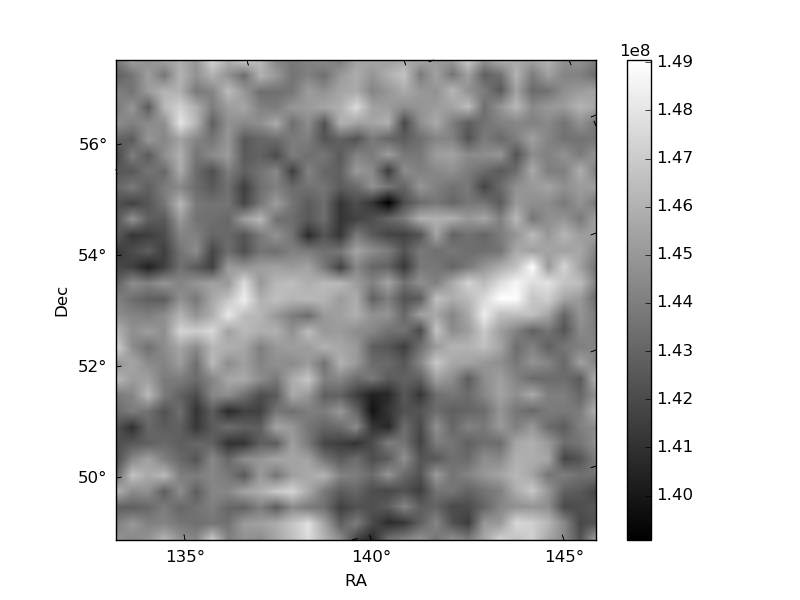
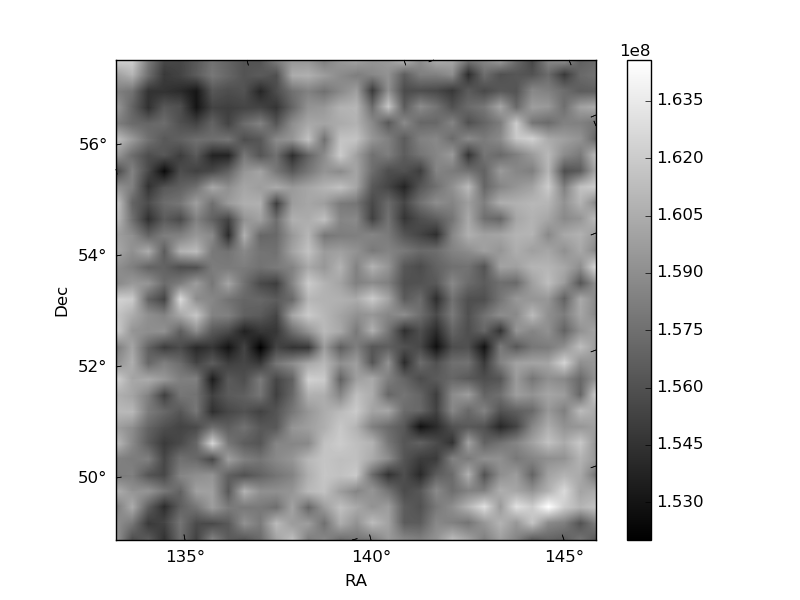
Histogram calculated using DETX and DETY for each event in the final _common_clean file
| Quadrant A | 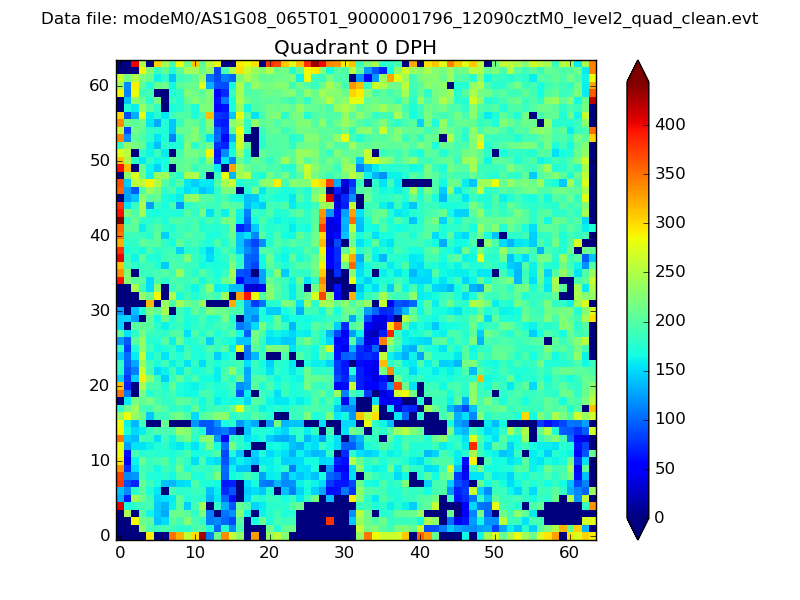 |
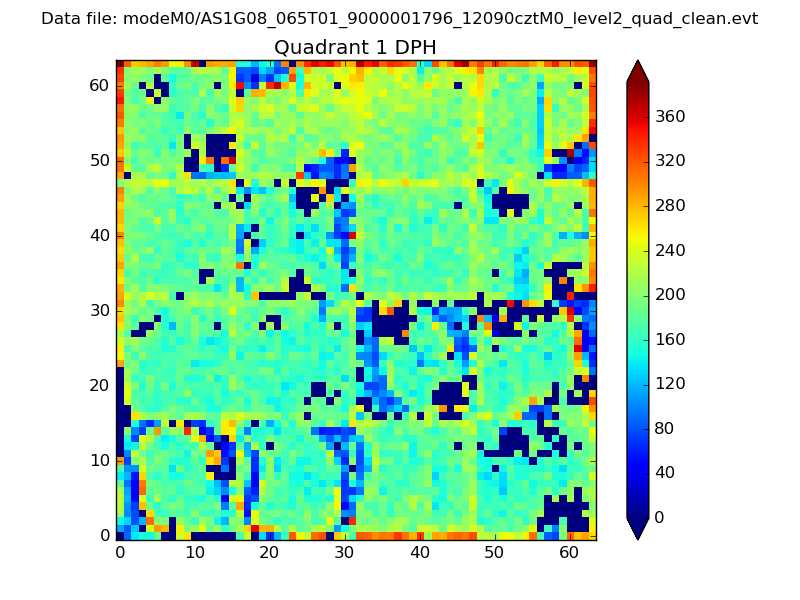 |
Quadrant B |
|---|---|---|---|
| Quadrant D | 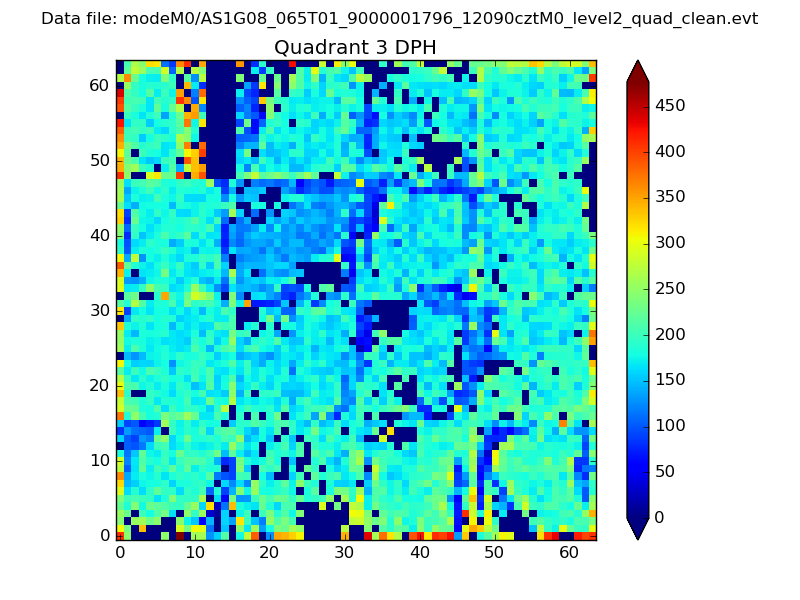 |
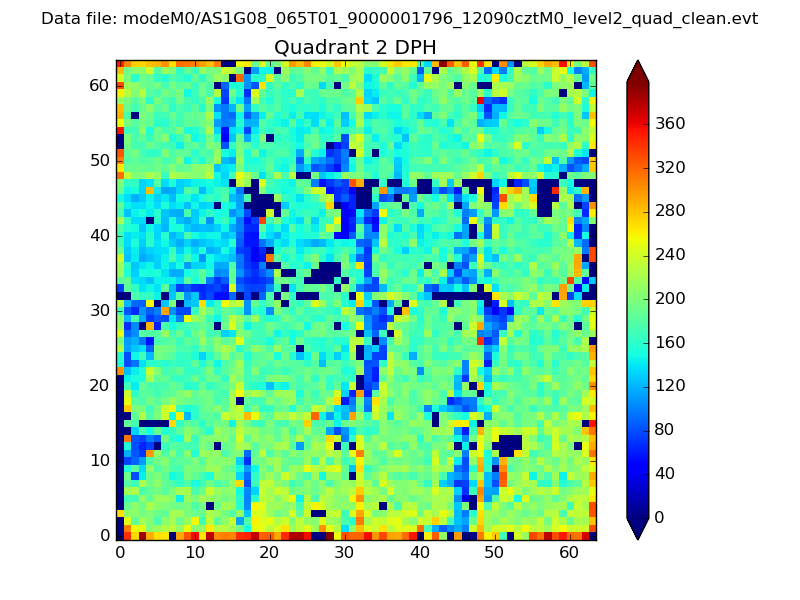 |
Quadrant C |
| Plot type | Count rate plots | Images |
|---|---|---|
| Comparison with Poisson distribution Blue bars denote a histogram of data divided into 1 sec bins. Red curve is a Poisson curve with rate = median count rate of data. |
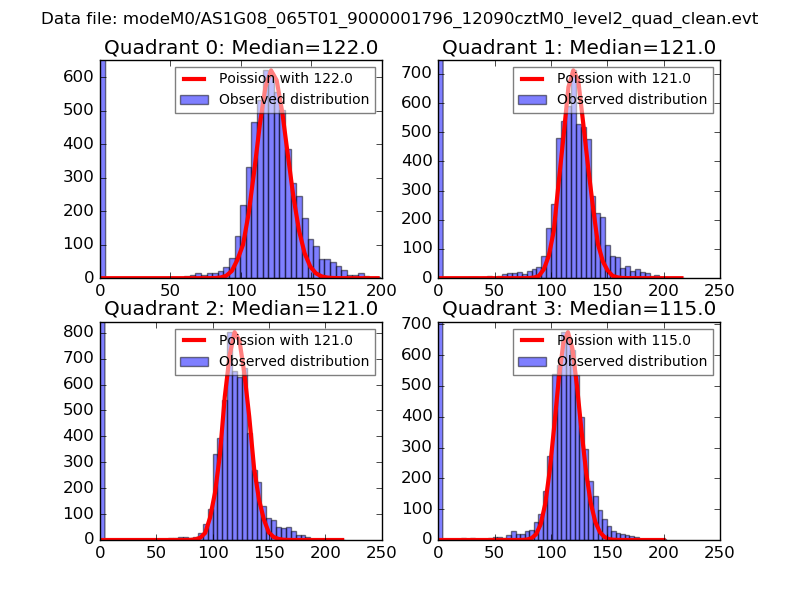 |
 |
| Quadrant-wise count rates Data is divided into 100 sec bins |
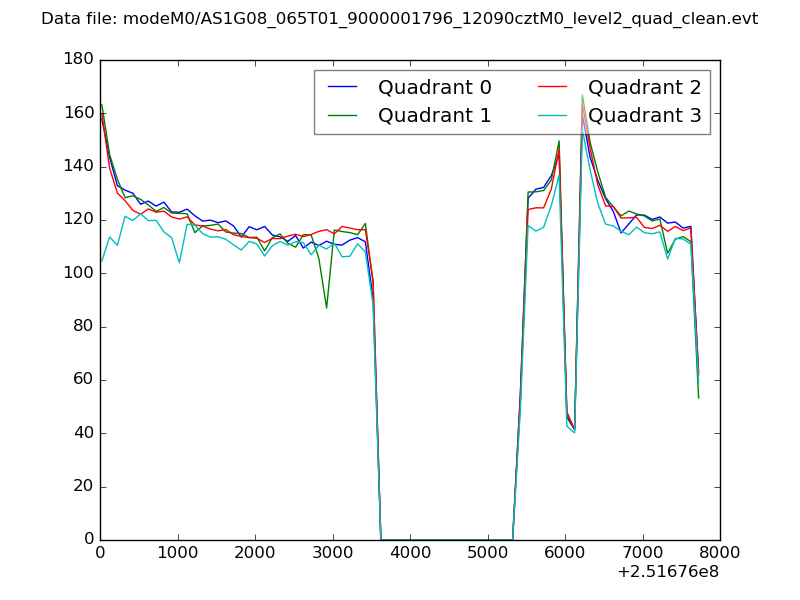 |
|
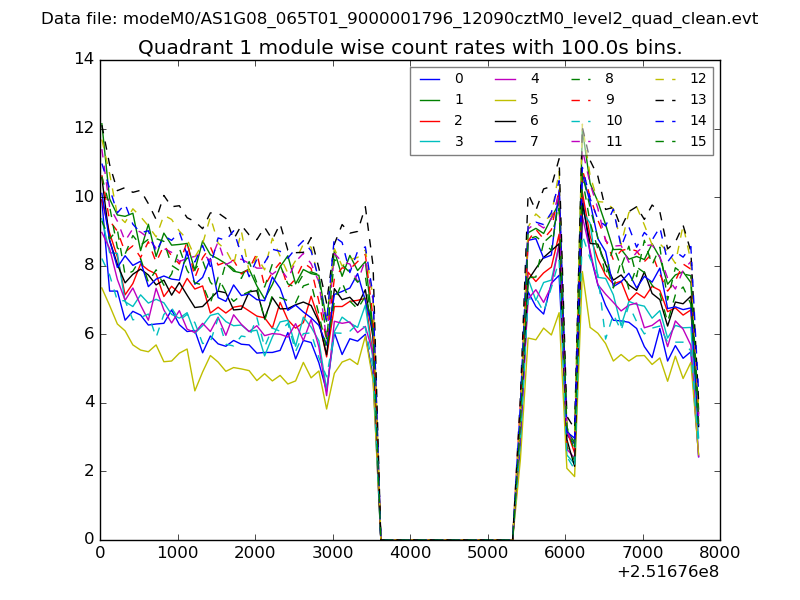
| Module-wise count rates for Quadrant A Data is divided into 100 sec bins |
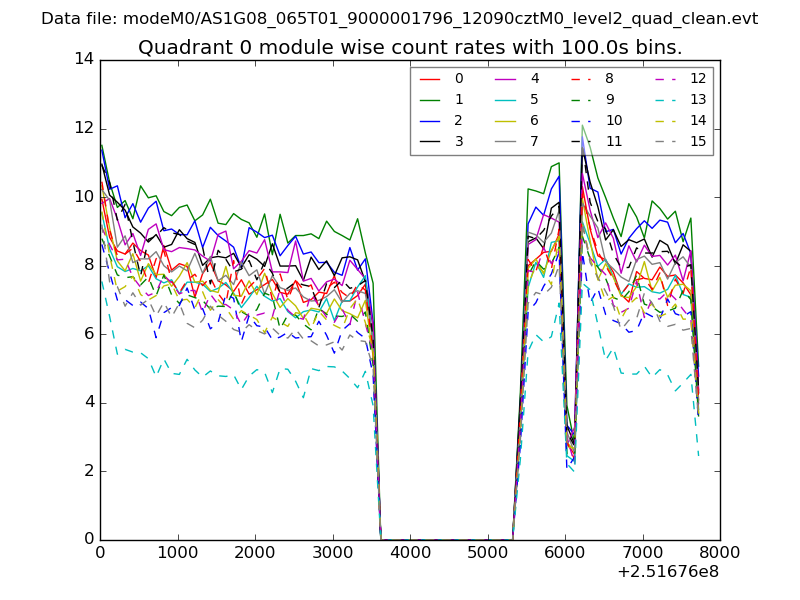 |
 |
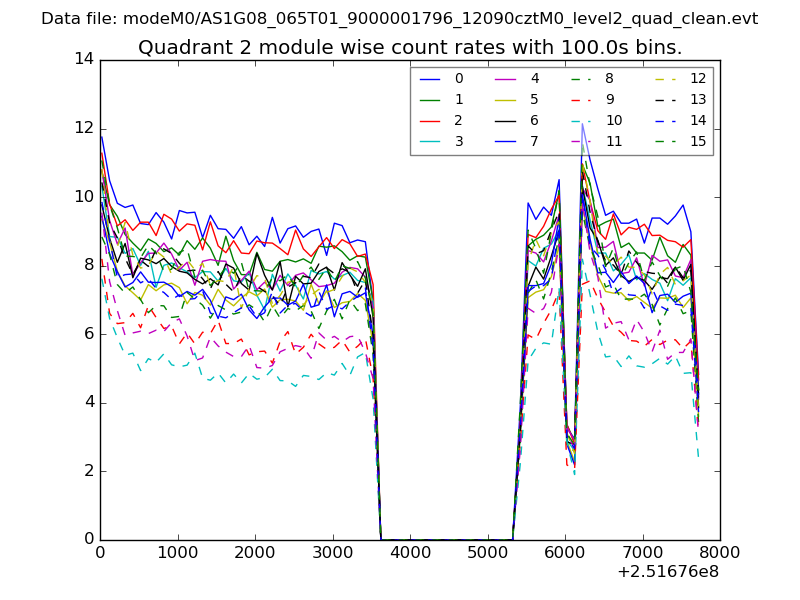
| Module-wise count rates for Quadrant B Data is divided into 100 sec bins |
 |
 |
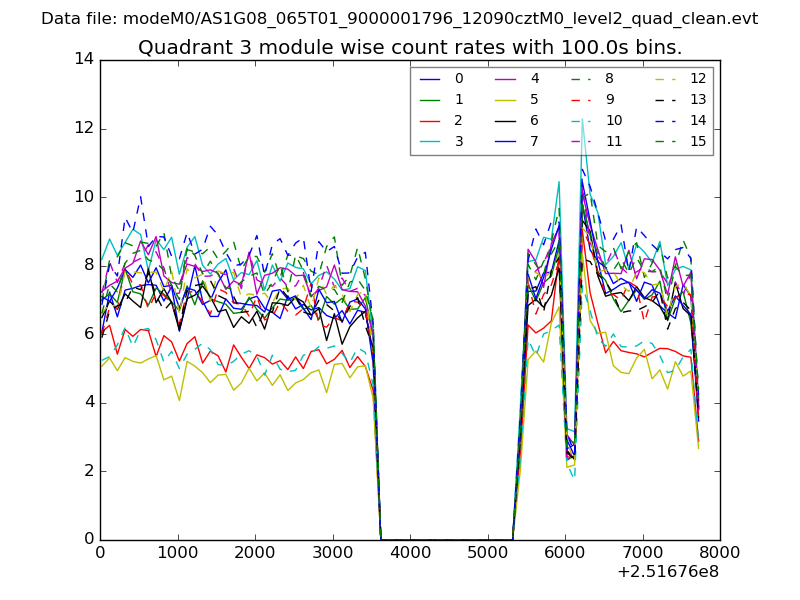
| Module-wise count rates for Quadrant C Data is divided into 100 sec bins |
 |
 |
| Module-wise count rates for Quadrant D Data is divided into 100 sec bins |
 |
 |
| Parameter | Plot |
|---|---|
| CZT HV Monitor | 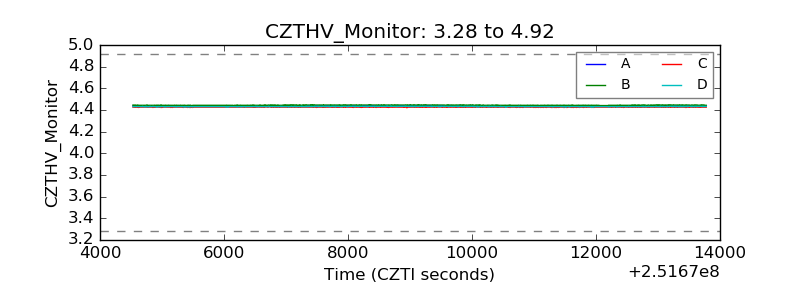 |
| D_VDD |  |
| Temperature 1 | 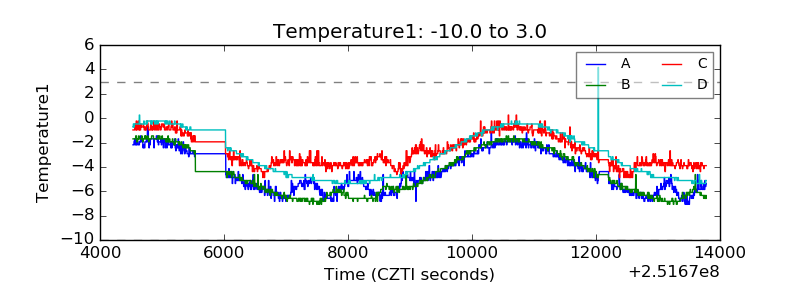 |
| Veto HV Monitor | 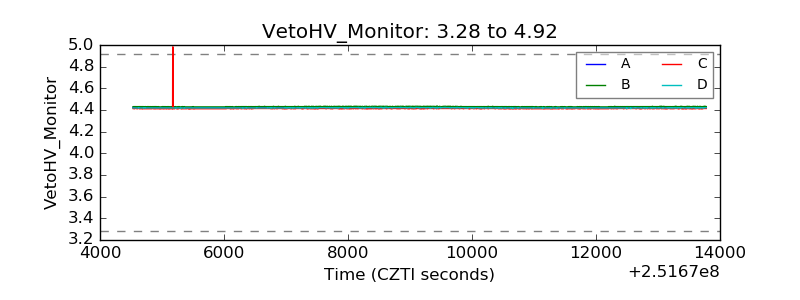 |
| Veto LLD | 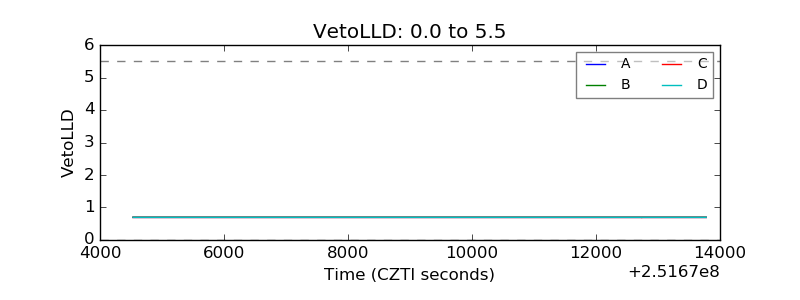 |
| Alpha Counter | 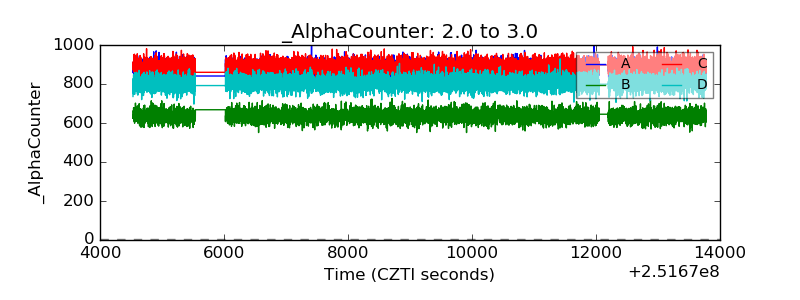 |
| _CPM_Rate | 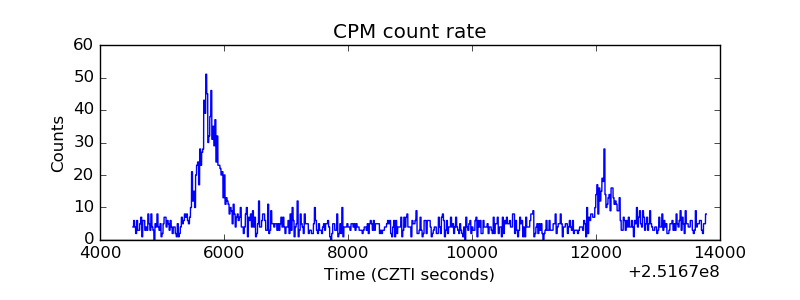 |
| CZT Counter | 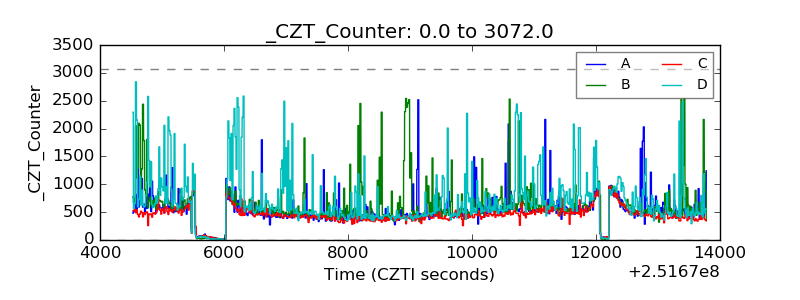 |
| +2.5 Volts monitor | 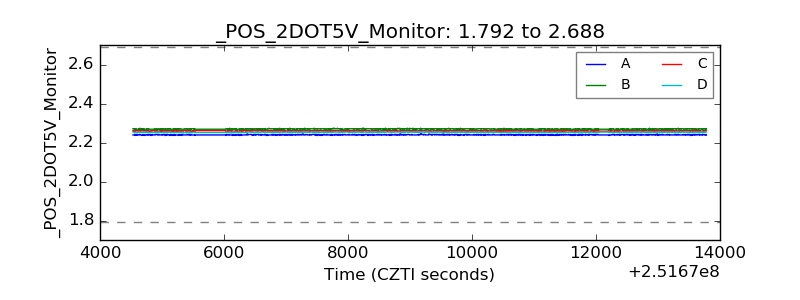 |
| +5 Volts monitor |  |
| _ROLL_ROT | 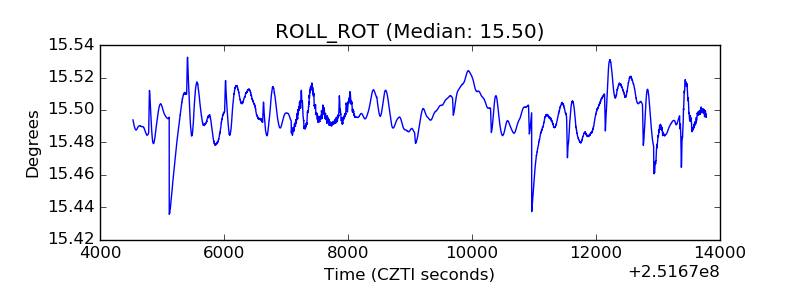 |
| _Roll_DEC | 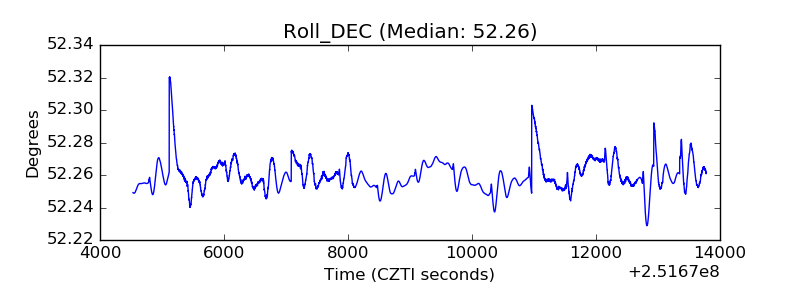 |
| _Roll_RA | 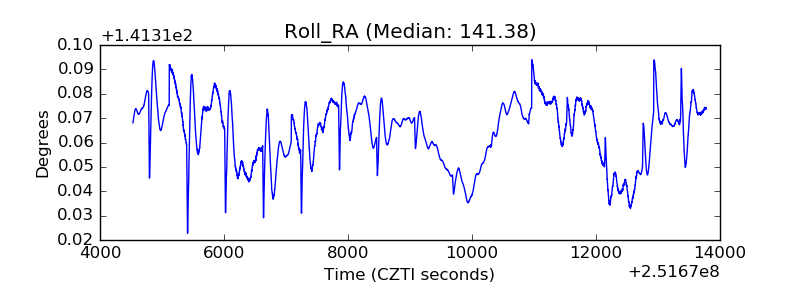 |
| Veto Counter | 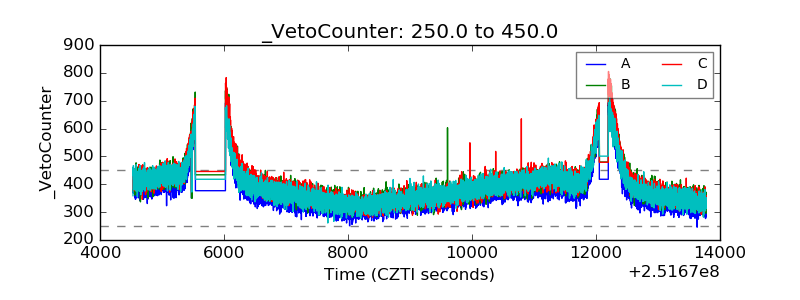 |