| Param | Original file | Final file |
|---|---|---|
| Filename | modeM0/AS1G08_065T01_9000001796_12091cztM0_level2.evt | modeM0/AS1G08_065T01_9000001796_12091cztM0_level2_quad_clean.evt |
| Size (bytes) | 704,761,920 | 127,062,720 |
| Size | 672.1 MB | 121.2 MB |
| Events in quadrant A | 5,187,504 | 818,099 |
| Events in quadrant B | 5,702,851 | 812,977 |
| Events in quadrant C | 4,211,754 | 815,167 |
| Events in quadrant D | 5,635,381 | 780,438 |
| Mode M0 | |||
|---|---|---|---|
| Quadrant | BADHDUFLAG | Total packets | Discarded packets |
| A | 0 | 21301 | 3 |
| B | 0 | 23002 | 2 |
| C | 0 | 18860 | 2 |
| D | 0 | 22987 | 2 |
| Mode M9 | |||
|---|---|---|---|
| Quadrant | BADHDUFLAG | Total packets | Discarded packets |
| A | 0 | 3 | 0 |
| B | 0 | 3 | 0 |
| C | 0 | 3 | 0 |
| D | 0 | 3 | 0 |
| Mode SS | |||
|---|---|---|---|
| Quadrant | BADHDUFLAG | Total packets | Discarded packets |
| A | 0 | 184 | 0 |
| B | 0 | 184 | 0 |
| C | 0 | 184 | 0 |
| D | 0 | 184 | 0 |
| Quadrant | Total seconds | Saturated seconds | Saturation percentage |
|---|---|---|---|
| A | 8948 | 283 | 3.162718% |
| B | 8948 | 460 | 5.140814% |
| C | 8948 | 104 | 1.162271% |
| D | 8948 | 217 | 2.425123% |
Noise dominated data is calculated using 1-second bins in cleaned event files. If a bin has >2000 counts, and if more than 50% of those come from <1% of pixels, then it is considered to be noise-dominated and hence unusable.
| Quadrant | # 1 sec bins | Bins with >0 counts | Bins with >2000 counts | High rate bins dominated by noise | Noise dominated (total time) | Noise dominated (detector-on time) | Marked lightcurve |
|---|---|---|---|---|---|---|---|
| A | 9264 | 8951 | 78 | 78 | 0.84% | 0.87% | 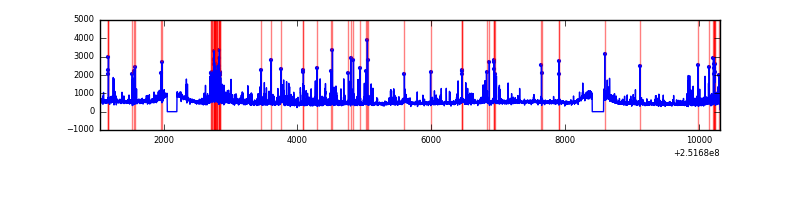 |
| B | 9264 | 8951 | 164 | 164 | 1.77% | 1.83% | 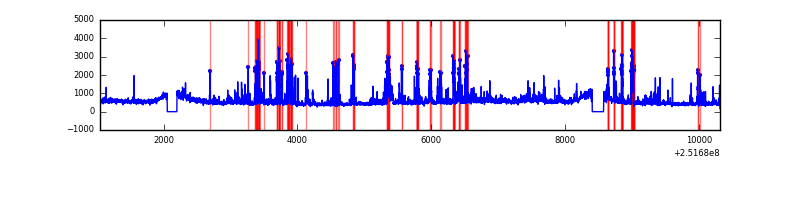 |
| C | 9264 | 8951 | 1 | 1 | 0.01% | 0.01% | 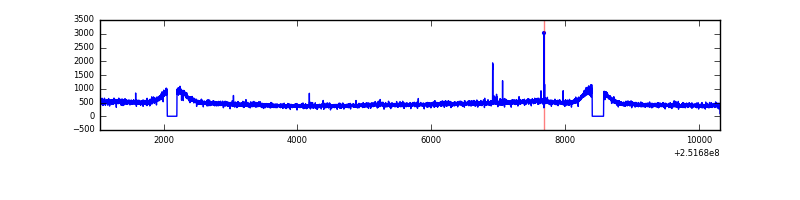 |
| D | 9264 | 8951 | 85 | 85 | 0.92% | 0.95% |  |
Top three noisy pixels from each quadrant. If the there are fewer than three noisy pixels in the level2.evt file, extra rows are filled as -1
| Pixel properties | Quadrant properties | ||||||
|---|---|---|---|---|---|---|---|
| Quadrant | DetID | PixID | Counts | Sigma | Mean | Median | Sigma |
| A | 13 | 251 | 540638 | 2425.87 | 1088 | 1065 | 222.4 |
| A | 1 | 162 | 153203 | 684.0 | 1088 | 1065 | 222.4 |
| A | 7 | 144 | 76940 | 341.13 | 1088 | 1065 | 222.4 |
| B | 4 | 239 | 1099253 | 5269.4 | 1084 | 1055 | 208.4 |
| B | 15 | 204 | 165462 | 788.86 | 1084 | 1055 | 208.4 |
| B | 11 | 51 | 124972 | 594.58 | 1084 | 1055 | 208.4 |
| C | 8 | 208 | 12537 | 46.45 | 1065 | 1067 | 246.9 |
| C | 5 | 96 | 11010 | 40.27 | 1065 | 1067 | 246.9 |
| C | 8 | 128 | 10797 | 39.4 | 1065 | 1067 | 246.9 |
| D | 8 | 195 | 597925 | 2314.57 | 1053 | 1020 | 257.9 |
| D | 1 | 52 | 502257 | 1943.6 | 1053 | 1020 | 257.9 |
| D | 14 | 34 | 130532 | 502.2 | 1053 | 1020 | 257.9 |
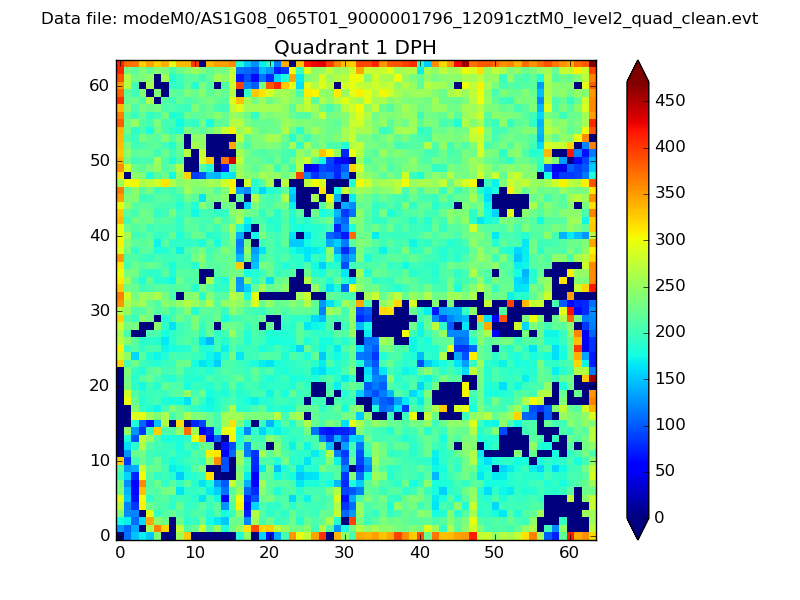
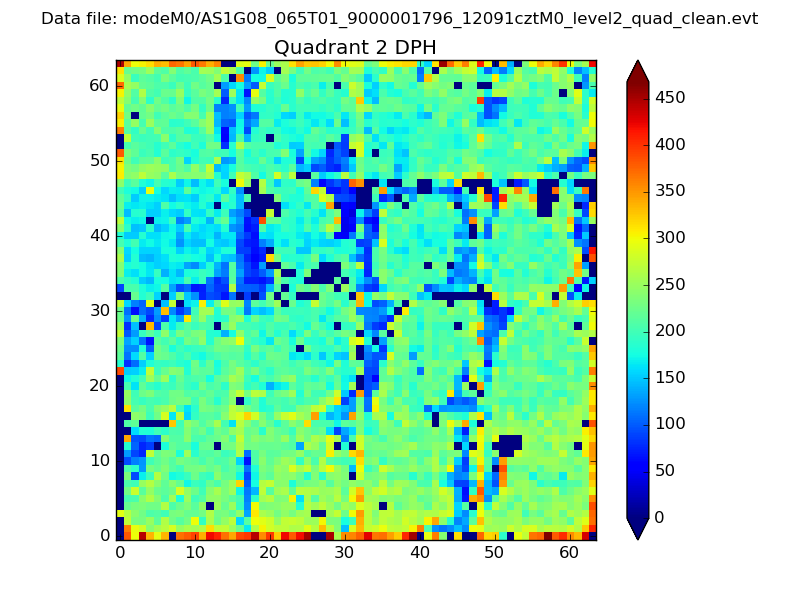
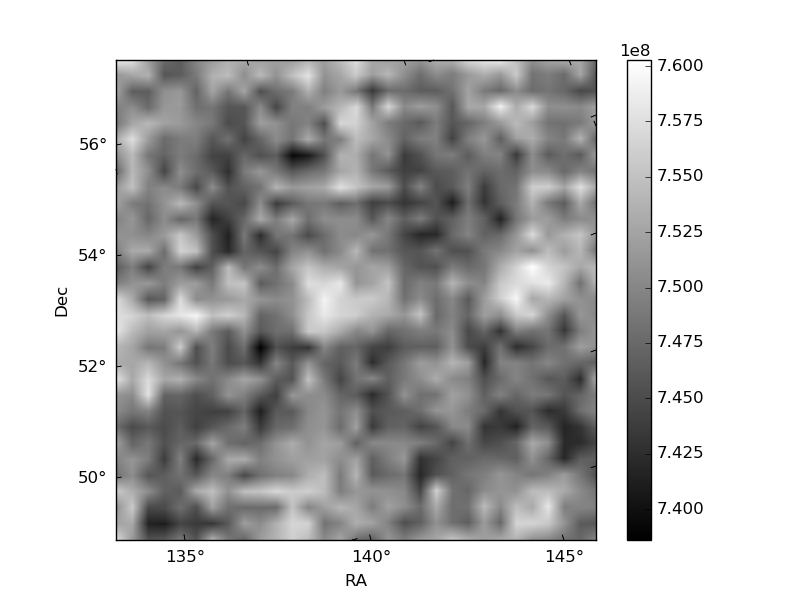
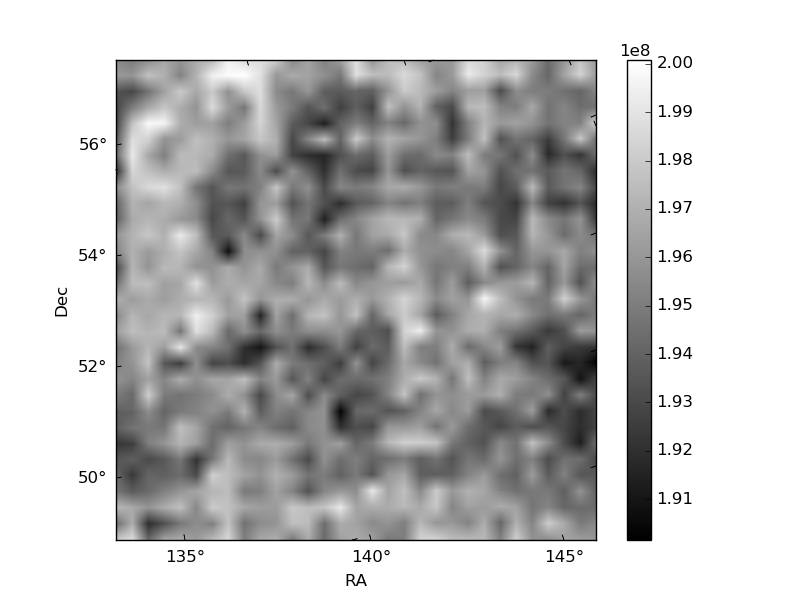
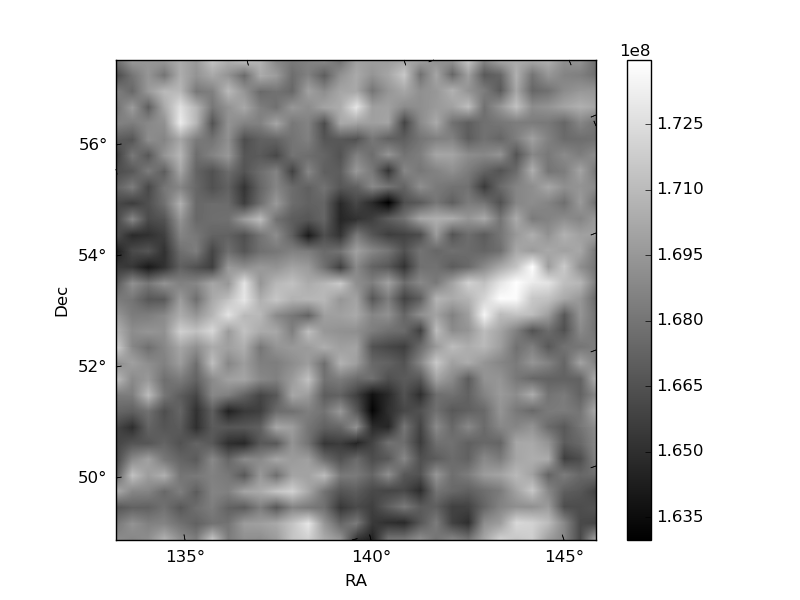
Histogram calculated using DETX and DETY for each event in the final _common_clean file
| Quadrant A | 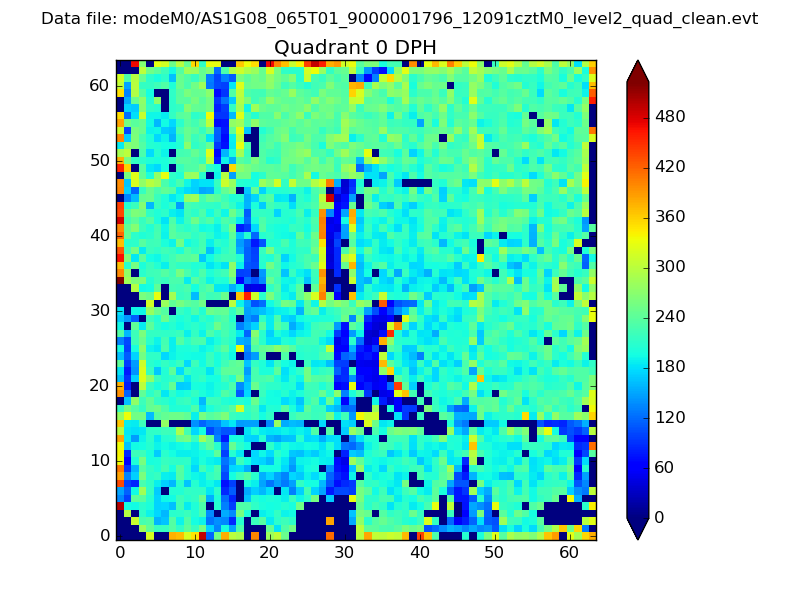 |
 |
Quadrant B |
|---|---|---|---|
| Quadrant D | 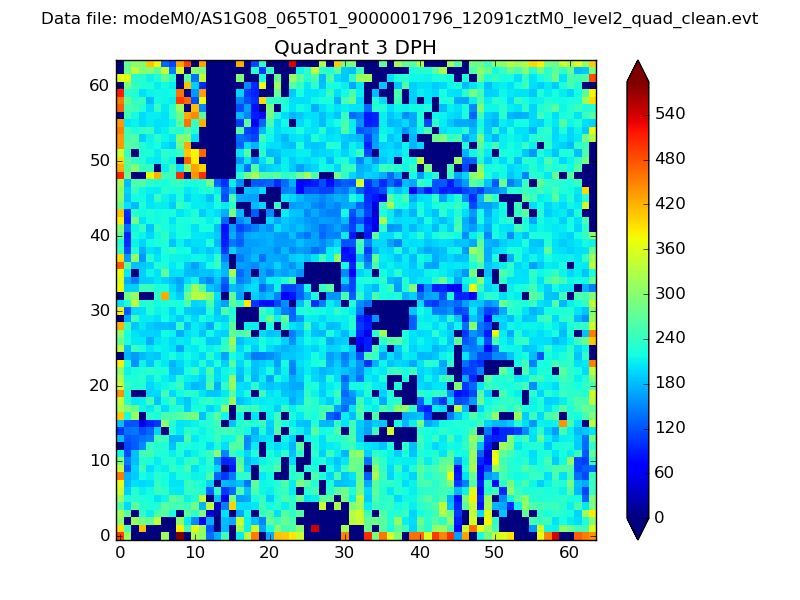 |
 |
Quadrant C |
| Plot type | Count rate plots | Images |
|---|---|---|
| Comparison with Poisson distribution Blue bars denote a histogram of data divided into 1 sec bins. Red curve is a Poisson curve with rate = median count rate of data. |
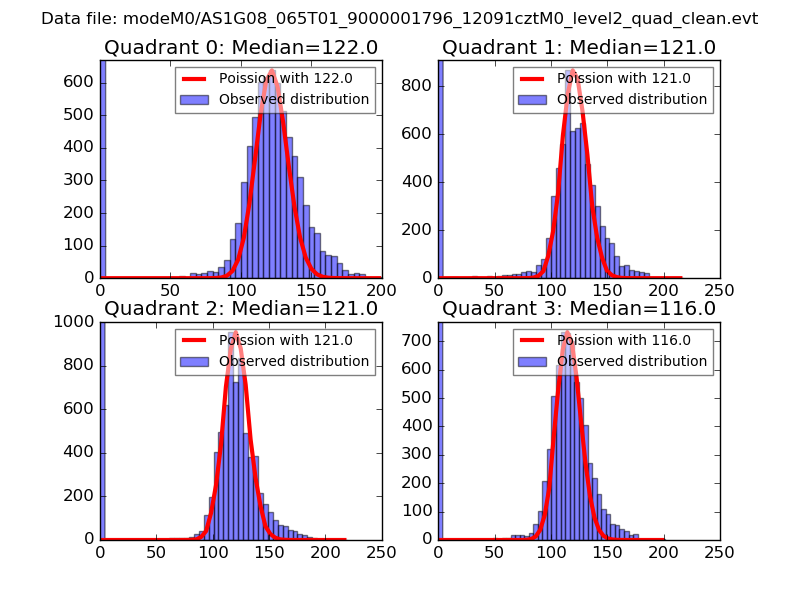 |
 |
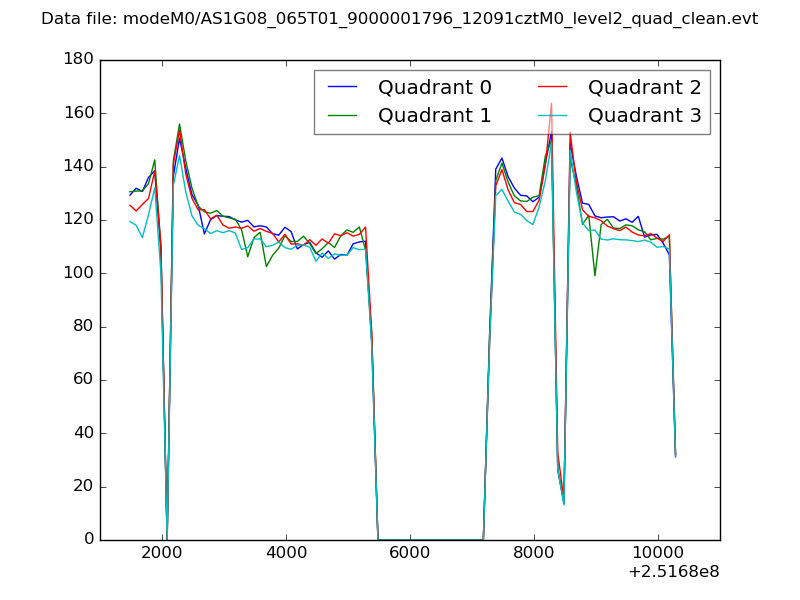
| Quadrant-wise count rates Data is divided into 100 sec bins |
 |
|
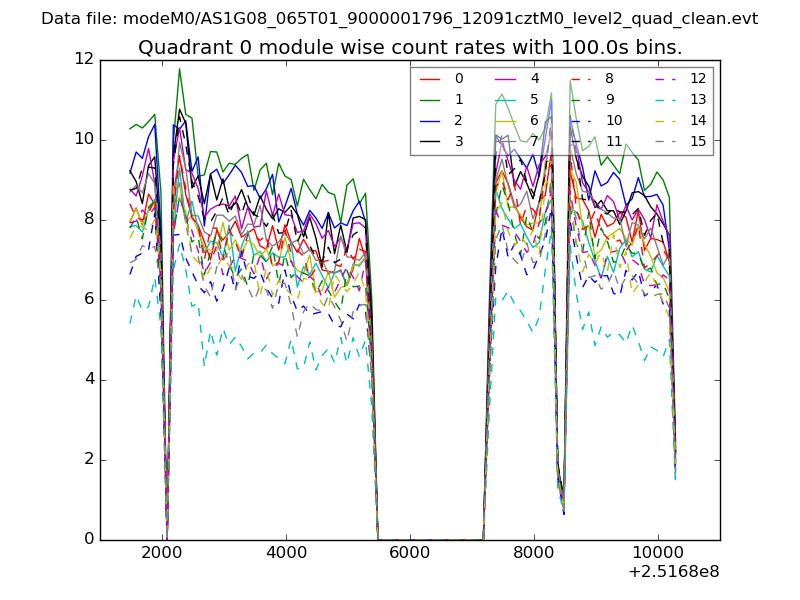
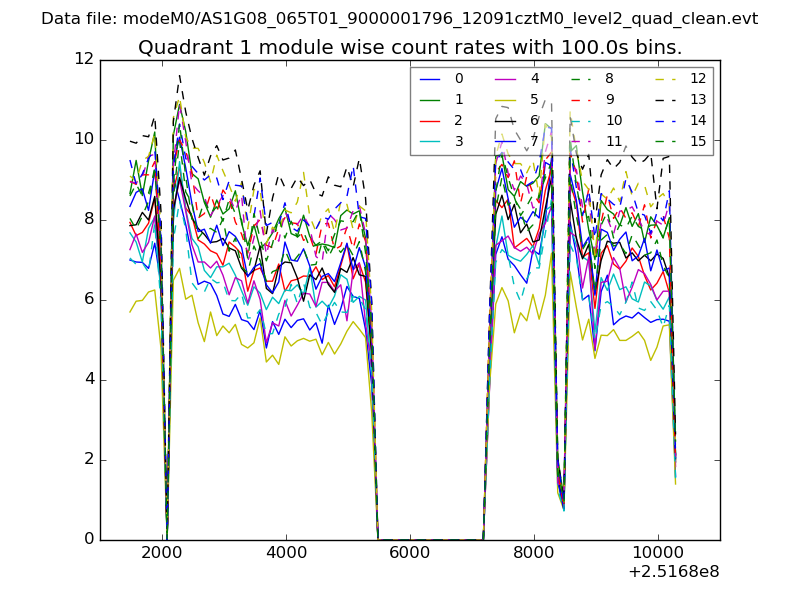
| Module-wise count rates for Quadrant A Data is divided into 100 sec bins |
 |
 |
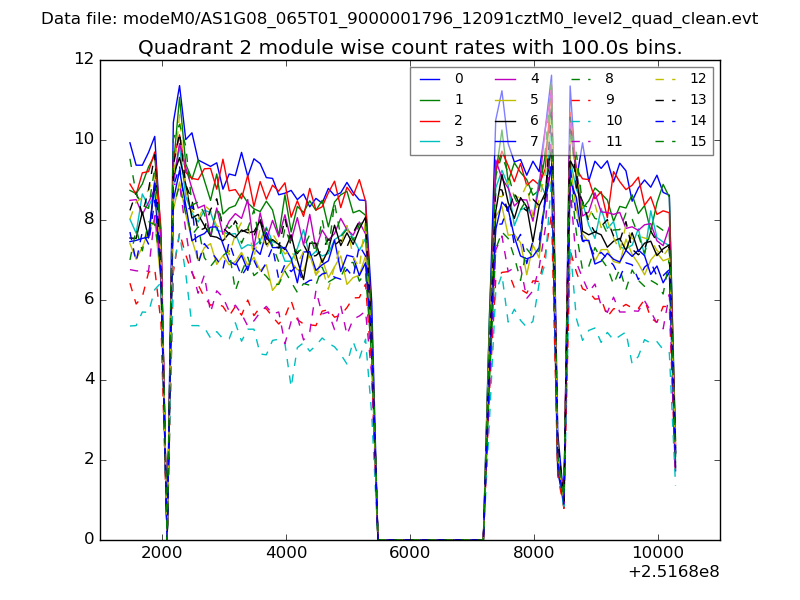
| Module-wise count rates for Quadrant B Data is divided into 100 sec bins |
 |
 |
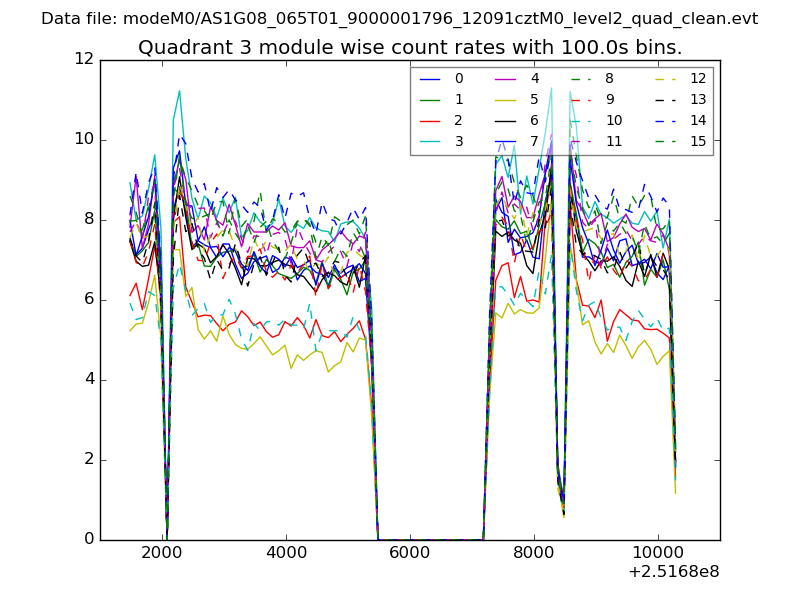
| Module-wise count rates for Quadrant C Data is divided into 100 sec bins |
 |
 |
| Module-wise count rates for Quadrant D Data is divided into 100 sec bins |
 |
 |
| Parameter | Plot |
|---|---|
| CZT HV Monitor | 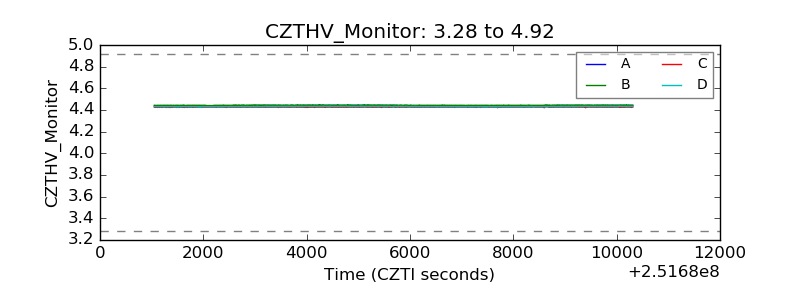 |
| D_VDD |  |
| Temperature 1 | 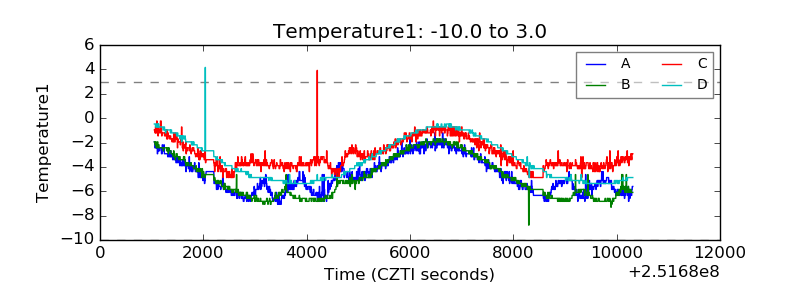 |
| Veto HV Monitor | 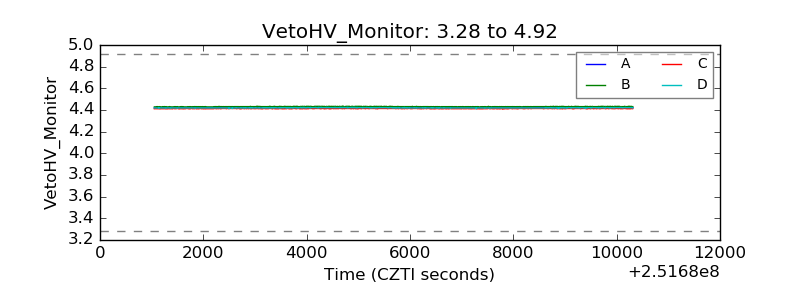 |
| Veto LLD | 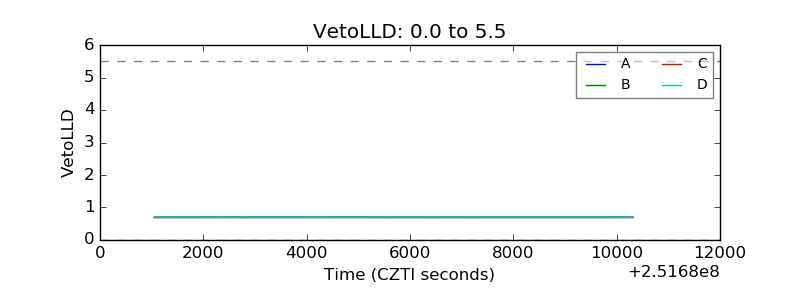 |
| Alpha Counter | 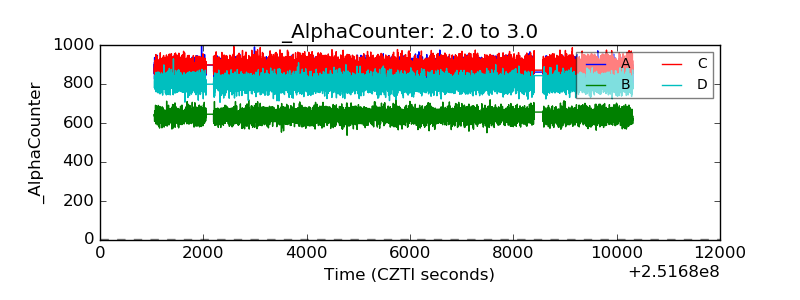 |
| _CPM_Rate | 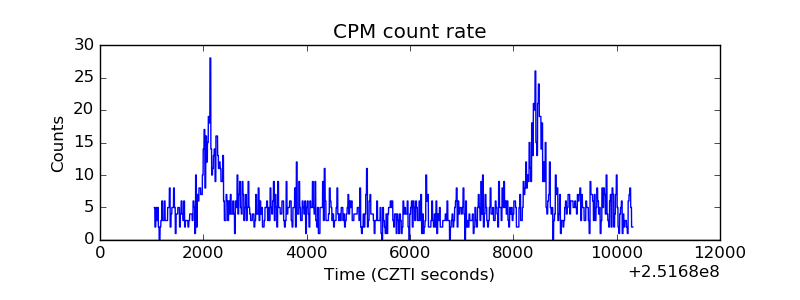 |
| CZT Counter | 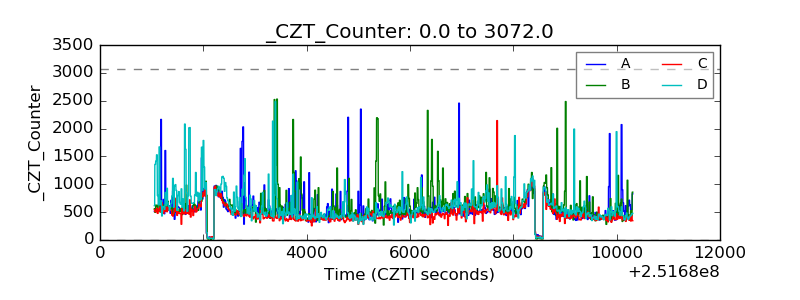 |
| +2.5 Volts monitor |  |
| +5 Volts monitor |  |
| _ROLL_ROT | 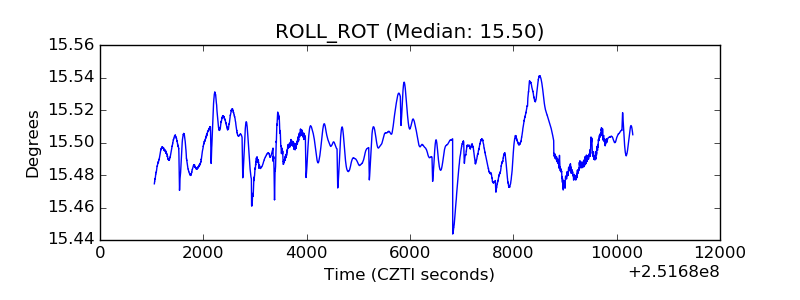 |
| _Roll_DEC | 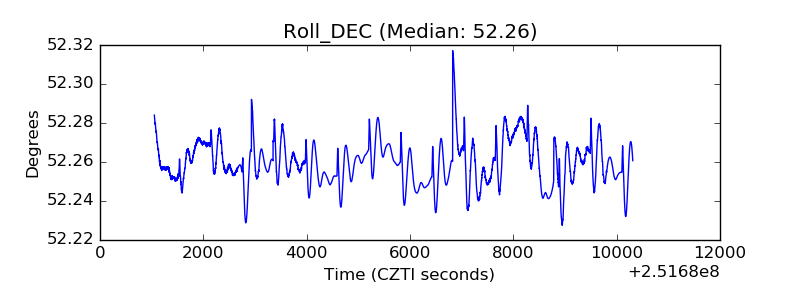 |
| _Roll_RA | 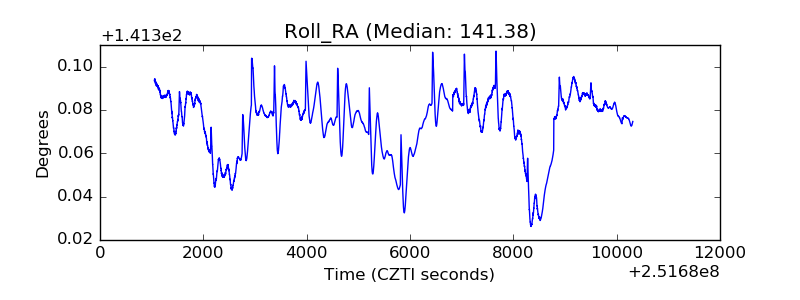 |
| Veto Counter | 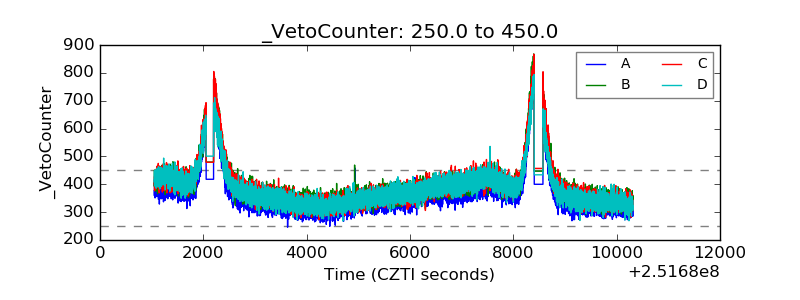 |