| Param | Original file | Final file |
|---|---|---|
| Filename | modeM0/AS1G08_065T01_9000001796_12095cztM0_level2.evt | modeM0/AS1G08_065T01_9000001796_12095cztM0_level2_quad_clean.evt |
| Size (bytes) | 685,077,120 | 98,611,200 |
| Size | 653.3 MB | 94.0 MB |
| Events in quadrant A | 4,565,073 | 597,783 |
| Events in quadrant B | 5,846,708 | 592,917 |
| Events in quadrant C | 4,019,676 | 597,365 |
| Events in quadrant D | 5,700,314 | 567,243 |
| Mode M0 | |||
|---|---|---|---|
| Quadrant | BADHDUFLAG | Total packets | Discarded packets |
| A | 0 | 19357 | 3 |
| B | 0 | 23121 | 1 |
| C | 0 | 18462 | 1 |
| D | 0 | 22833 | 1 |
| Mode M9 | |||
|---|---|---|---|
| Quadrant | BADHDUFLAG | Total packets | Discarded packets |
| A | 0 | 9 | 0 |
| B | 0 | 9 | 0 |
| C | 0 | 9 | 0 |
| D | 0 | 9 | 0 |
| Mode SS | |||
|---|---|---|---|
| Quadrant | BADHDUFLAG | Total packets | Discarded packets |
| A | 0 | 182 | 0 |
| B | 0 | 182 | 0 |
| C | 0 | 182 | 0 |
| D | 0 | 182 | 0 |
| Quadrant | Total seconds | Saturated seconds | Saturation percentage |
|---|---|---|---|
| A | 9097 | 124 | 1.363087% |
| B | 9097 | 415 | 4.561943% |
| C | 9097 | 70 | 0.769484% |
| D | 9097 | 247 | 2.715181% |
Noise dominated data is calculated using 1-second bins in cleaned event files. If a bin has >2000 counts, and if more than 50% of those come from <1% of pixels, then it is considered to be noise-dominated and hence unusable.
| Quadrant | # 1 sec bins | Bins with >0 counts | Bins with >2000 counts | High rate bins dominated by noise | Noise dominated (total time) | Noise dominated (detector-on time) | Marked lightcurve |
|---|---|---|---|---|---|---|---|
| A | 25166 | 9098 | 23 | 23 | 0.09% | 0.25% | 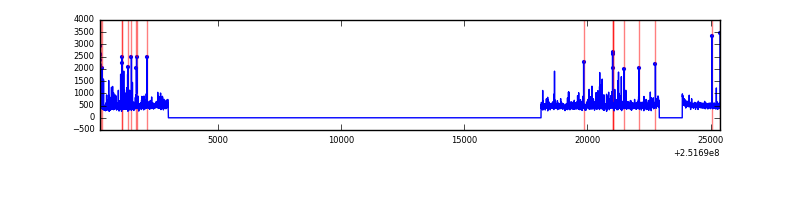 |
| B | 25167 | 9099 | 207 | 207 | 0.82% | 2.27% | 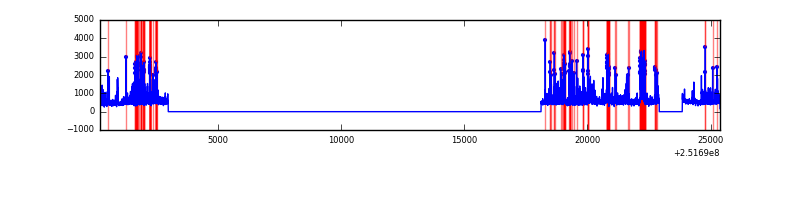 |
| C | 25167 | 9099 | 9 | 9 | 0.04% | 0.10% | 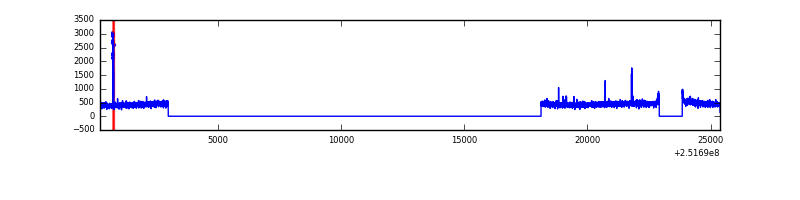 |
| D | 25167 | 9099 | 158 | 158 | 0.63% | 1.74% |  |
Top three noisy pixels from each quadrant. If the there are fewer than three noisy pixels in the level2.evt file, extra rows are filled as -1
| Pixel properties | Quadrant properties | ||||||
|---|---|---|---|---|---|---|---|
| Quadrant | DetID | PixID | Counts | Sigma | Mean | Median | Sigma |
| A | 1 | 162 | 127899 | 587.67 | 1063 | 1042 | 215.9 |
| A | 13 | 251 | 90939 | 416.45 | 1063 | 1042 | 215.9 |
| A | 1 | 178 | 51652 | 234.45 | 1063 | 1042 | 215.9 |
| B | 4 | 239 | 1315138 | 6633.21 | 1041 | 1017 | 198.1 |
| B | 15 | 204 | 148826 | 746.08 | 1041 | 1017 | 198.1 |
| B | 11 | 51 | 113542 | 567.98 | 1041 | 1017 | 198.1 |
| C | 14 | 234 | 33945 | 140.23 | 1017 | 1020 | 234.8 |
| C | 15 | 208 | 15581 | 62.02 | 1017 | 1020 | 234.8 |
| C | 13 | 61 | 7645 | 28.22 | 1017 | 1020 | 234.8 |
| D | 8 | 195 | 574040 | 2353.85 | 1014 | 985 | 243.5 |
| D | 1 | 52 | 540260 | 2215.1 | 1014 | 985 | 243.5 |
| D | 10 | 50 | 217401 | 888.94 | 1014 | 985 | 243.5 |
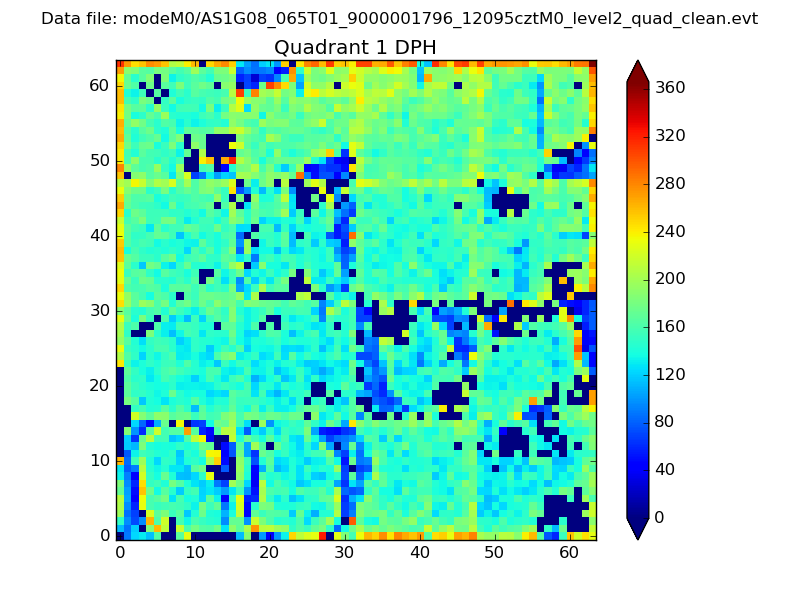
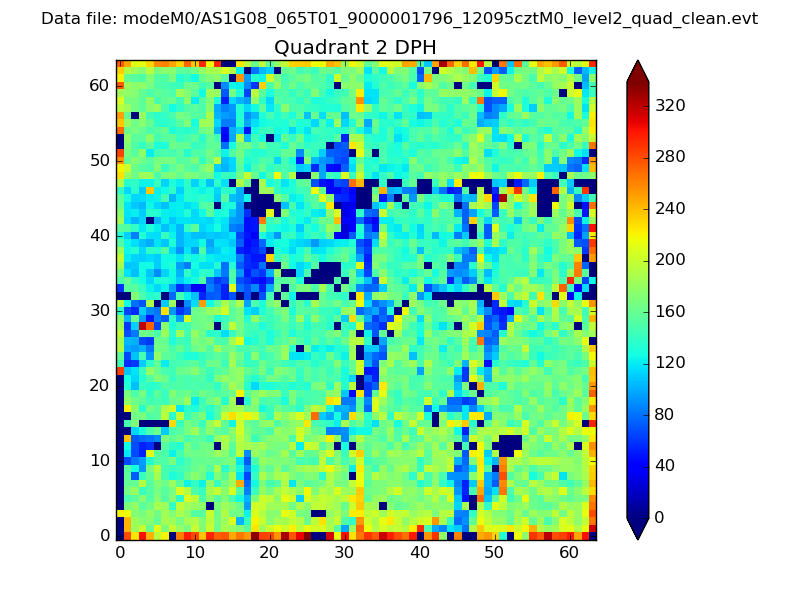
Histogram calculated using DETX and DETY for each event in the final _common_clean file
| Quadrant A | 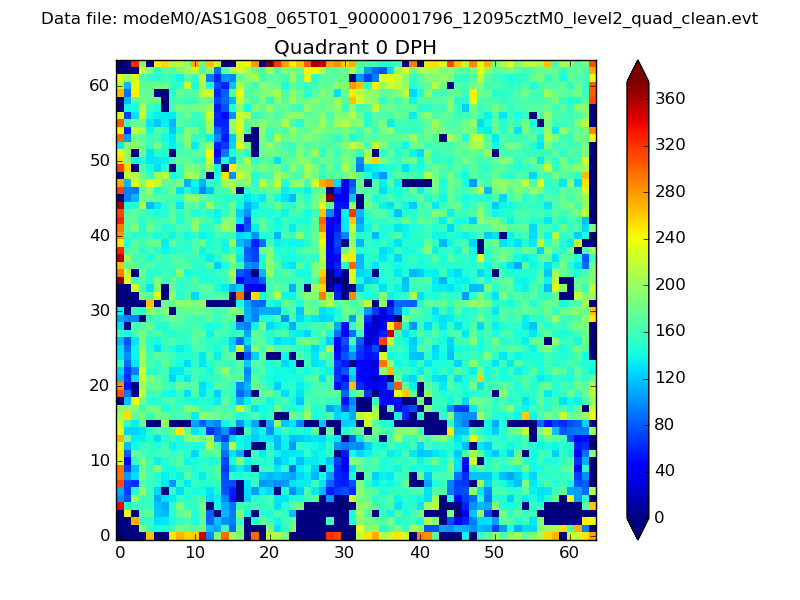 |
 |
Quadrant B |
|---|---|---|---|
| Quadrant D | 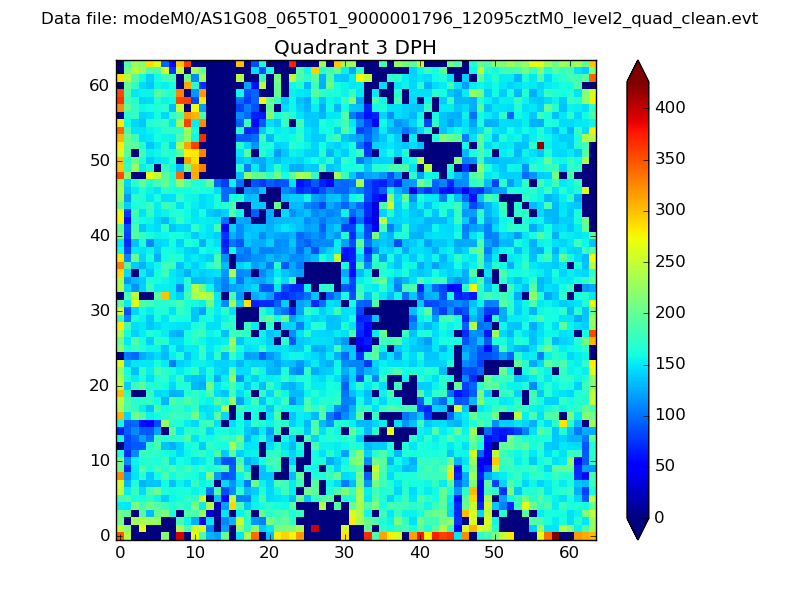 |
 |
Quadrant C |
| Plot type | Count rate plots | Images |
|---|---|---|
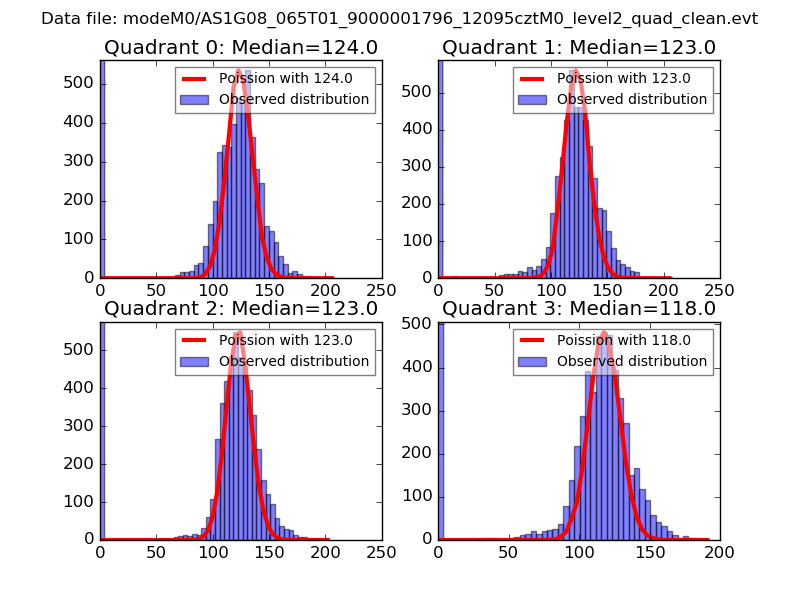
| Comparison with Poisson distribution Blue bars denote a histogram of data divided into 1 sec bins. Red curve is a Poisson curve with rate = median count rate of data. |
 |
 |
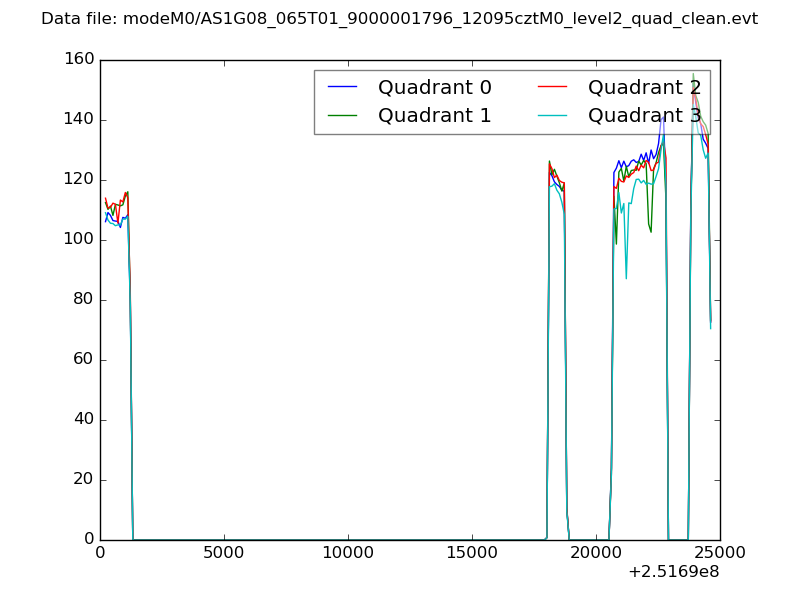
| Quadrant-wise count rates Data is divided into 100 sec bins |
 |
|
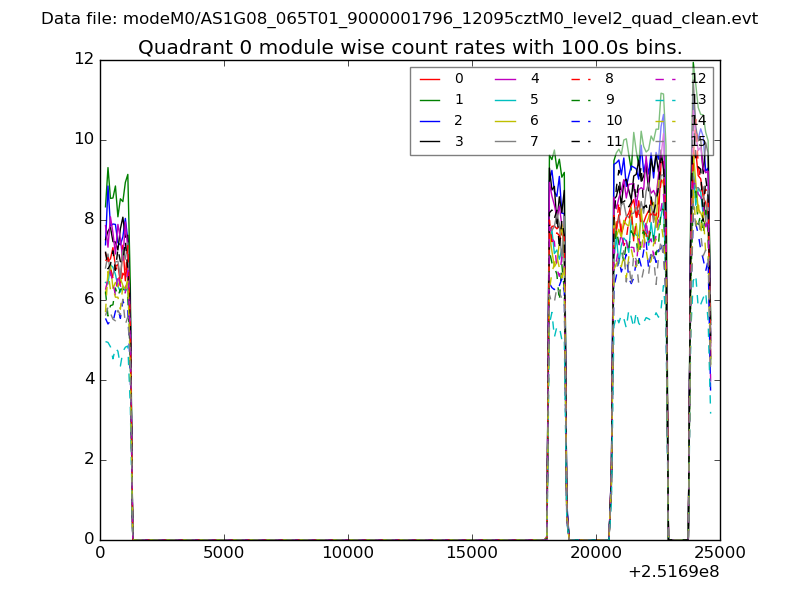
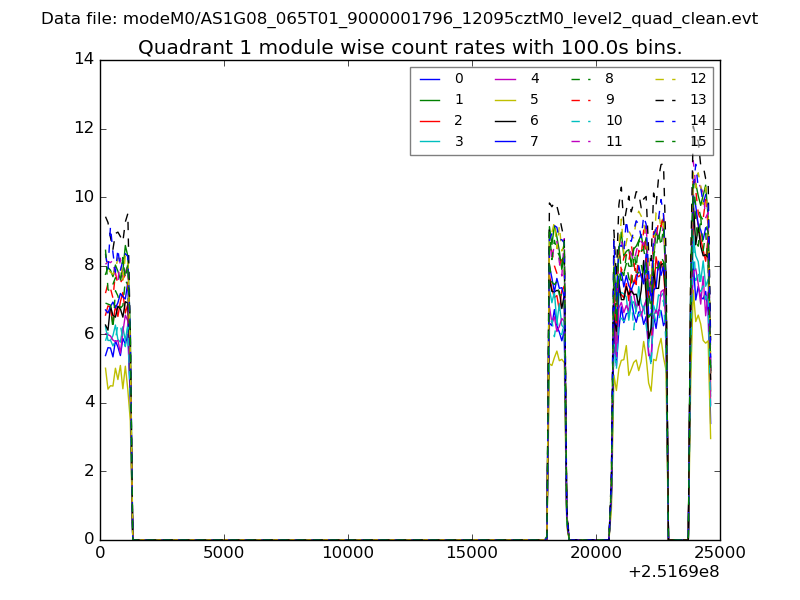
| Module-wise count rates for Quadrant A Data is divided into 100 sec bins |
 |
 |
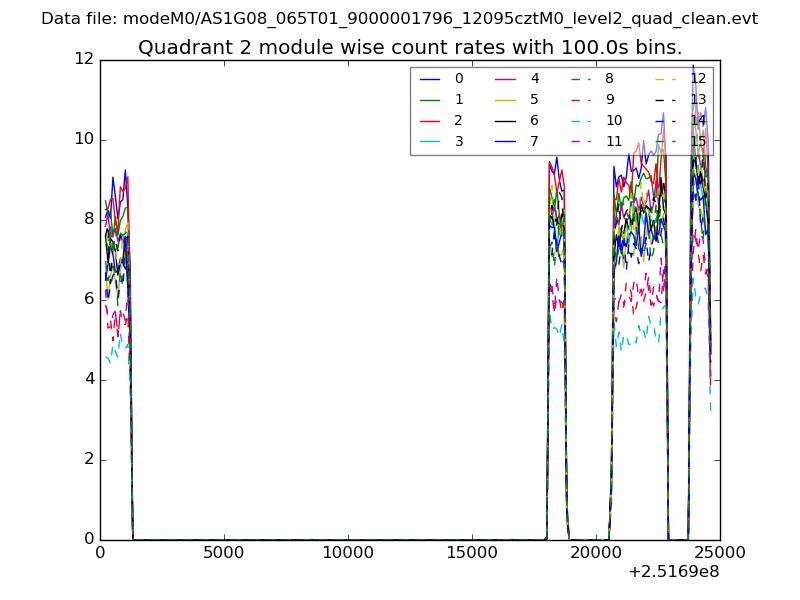
| Module-wise count rates for Quadrant B Data is divided into 100 sec bins |
 |
 |
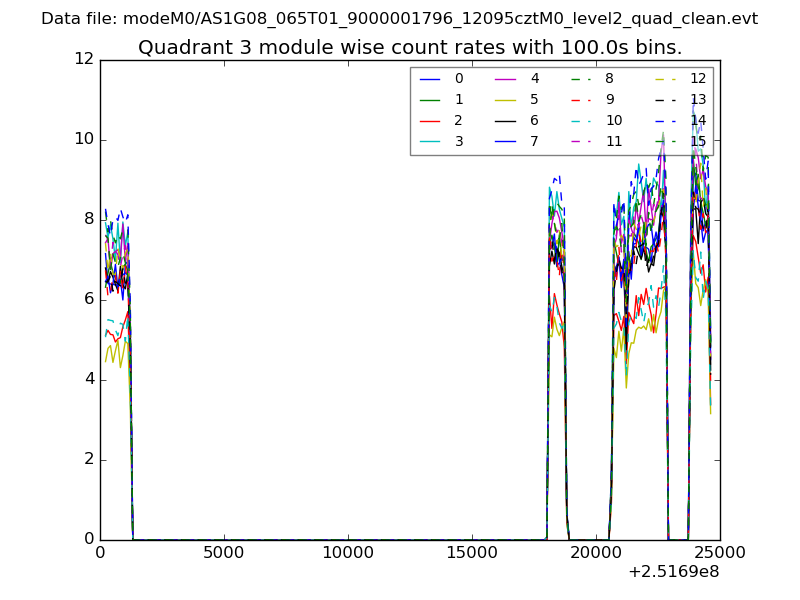
| Module-wise count rates for Quadrant C Data is divided into 100 sec bins |
 |
 |
| Module-wise count rates for Quadrant D Data is divided into 100 sec bins |
 |
 |
| Parameter | Plot |
|---|---|
| CZT HV Monitor | 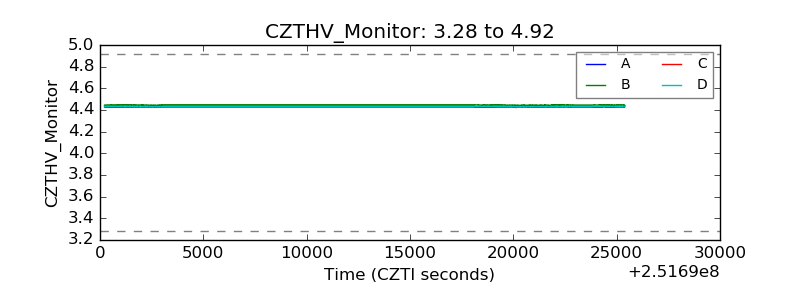 |
| D_VDD | 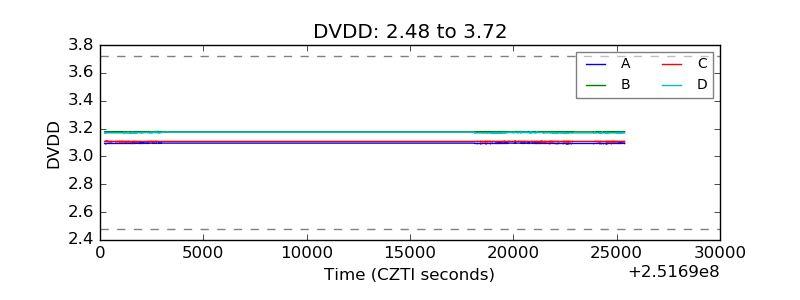 |
| Temperature 1 | 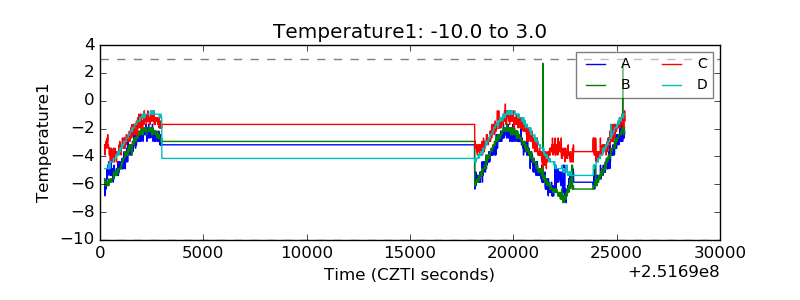 |
| Veto HV Monitor | 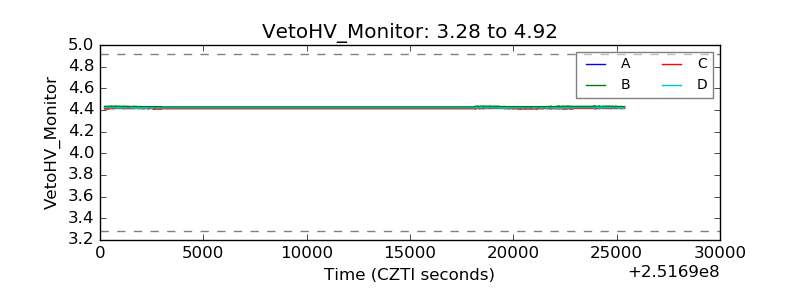 |
| Veto LLD | 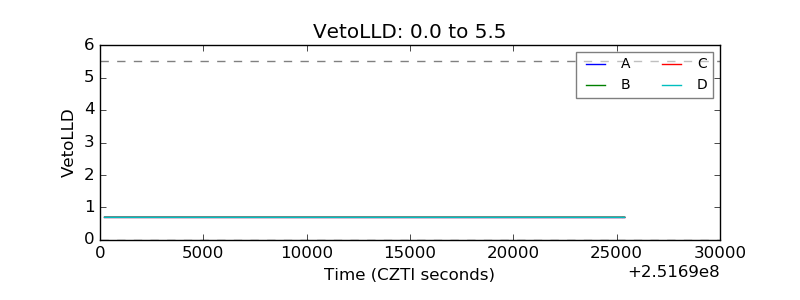 |
| Alpha Counter | 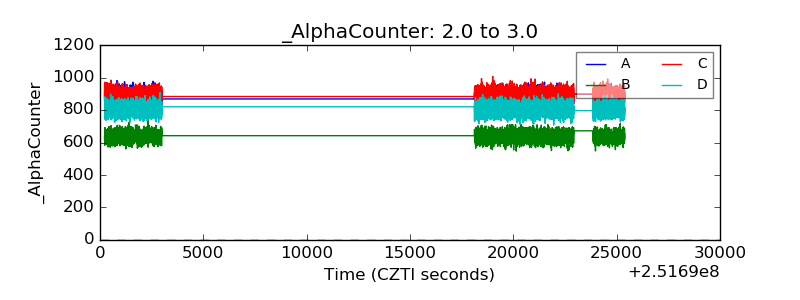 |
| _CPM_Rate | 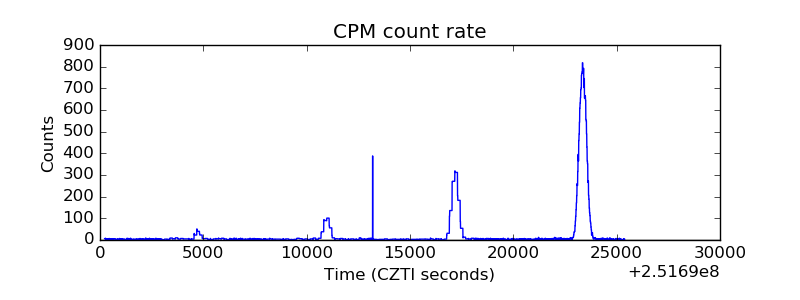 |
| CZT Counter | 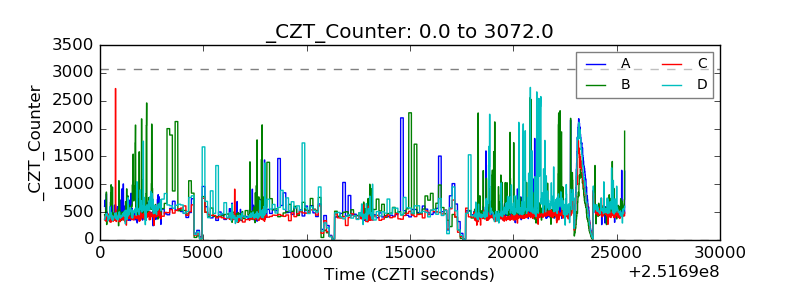 |
| +2.5 Volts monitor |  |
| +5 Volts monitor |  |
| _ROLL_ROT | 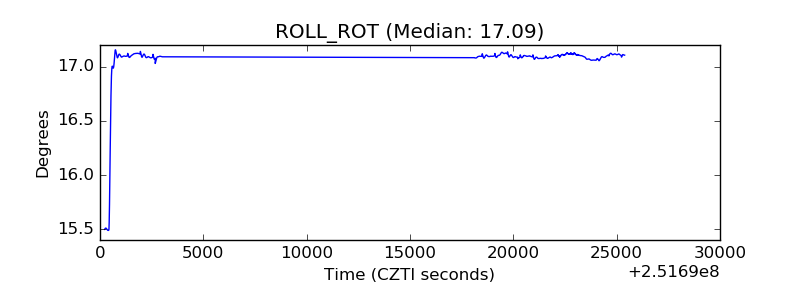 |
| _Roll_DEC | 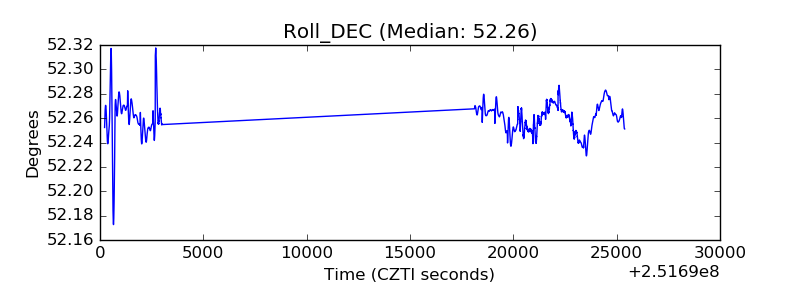 |
| _Roll_RA | 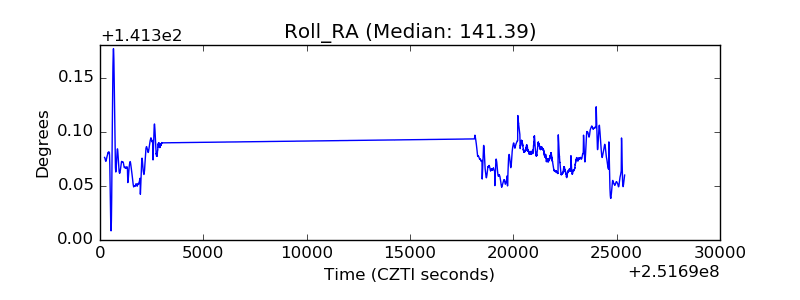 |
| Veto Counter | 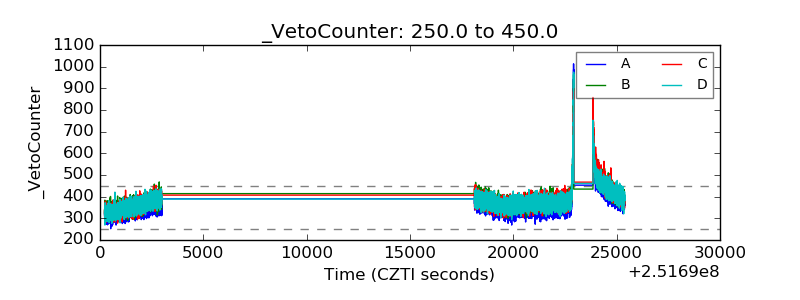 |