| Param | Original file | Final file |
|---|---|---|
| Filename | modeM0/AS1G08_065T01_9000001796_12097cztM0_level2.evt | modeM0/AS1G08_065T01_9000001796_12097cztM0_level2_quad_clean.evt |
| Size (bytes) | 2,083,227,840 | 340,024,320 |
| Size | 1.9 GB | 324.3 MB |
| Events in quadrant A | 14,431,599 | 2,138,187 |
| Events in quadrant B | 17,721,472 | 2,106,164 |
| Events in quadrant C | 12,466,043 | 2,121,457 |
| Events in quadrant D | 16,612,532 | 2,037,429 |
| Mode M0 | |||
|---|---|---|---|
| Quadrant | BADHDUFLAG | Total packets | Discarded packets |
| A | 0 | 60886 | 6 |
| B | 0 | 70373 | 5 |
| C | 0 | 56244 | 5 |
| D | 0 | 67378 | 5 |
| Mode M9 | |||
|---|---|---|---|
| Quadrant | BADHDUFLAG | Total packets | Discarded packets |
| A | 0 | 38 | 0 |
| B | 0 | 38 | 0 |
| C | 0 | 38 | 0 |
| D | 0 | 38 | 0 |
| Mode SS | |||
|---|---|---|---|
| Quadrant | BADHDUFLAG | Total packets | Discarded packets |
| A | 0 | 562 | 0 |
| B | 0 | 562 | 0 |
| C | 0 | 562 | 0 |
| D | 0 | 562 | 0 |
| Quadrant | Total seconds | Saturated seconds | Saturation percentage |
|---|---|---|---|
| A | 27553 | 528 | 1.916307% |
| B | 27553 | 1352 | 4.906907% |
| C | 27553 | 202 | 0.733133% |
| D | 27553 | 580 | 2.105034% |
Noise dominated data is calculated using 1-second bins in cleaned event files. If a bin has >2000 counts, and if more than 50% of those come from <1% of pixels, then it is considered to be noise-dominated and hence unusable.
| Quadrant | # 1 sec bins | Bins with >0 counts | Bins with >2000 counts | High rate bins dominated by noise | Noise dominated (total time) | Noise dominated (detector-on time) | Marked lightcurve |
|---|---|---|---|---|---|---|---|
| A | 31424 | 27554 | 84 | 84 | 0.27% | 0.30% | 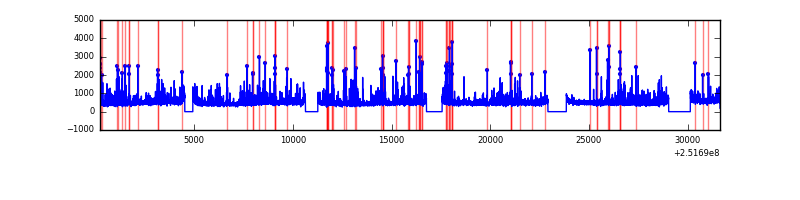 |
| B | 31424 | 27556 | 633 | 633 | 2.01% | 2.30% | 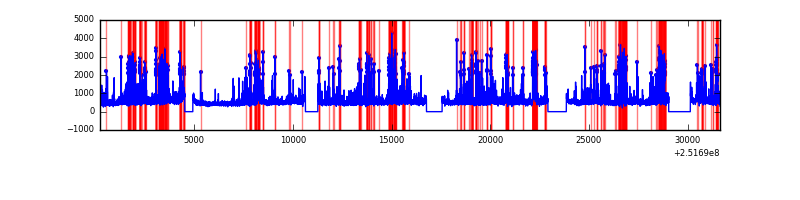 |
| C | 31424 | 27557 | 18 | 18 | 0.06% | 0.07% | 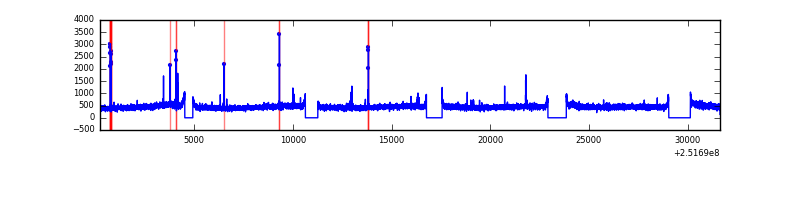 |
| D | 31424 | 27556 | 320 | 320 | 1.02% | 1.16% | 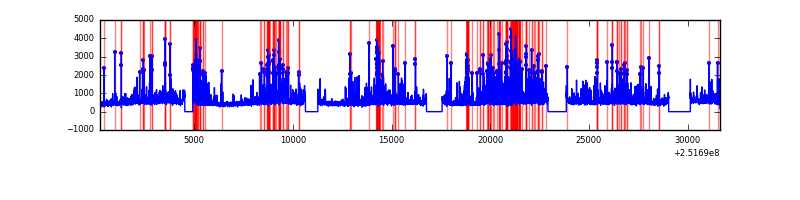 |
Top three noisy pixels from each quadrant. If the there are fewer than three noisy pixels in the level2.evt file, extra rows are filled as -1
| Pixel properties | Quadrant properties | ||||||
|---|---|---|---|---|---|---|---|
| Quadrant | DetID | PixID | Counts | Sigma | Mean | Median | Sigma |
| A | 1 | 162 | 489521 | 743.9 | 3266 | 3203 | 653.7 |
| A | 13 | 251 | 303523 | 459.39 | 3266 | 3203 | 653.7 |
| A | 1 | 178 | 194607 | 292.78 | 3266 | 3203 | 653.7 |
| B | 4 | 239 | 3854531 | 6357.42 | 3216 | 3140 | 605.8 |
| B | 15 | 204 | 487569 | 799.64 | 3216 | 3140 | 605.8 |
| B | 11 | 51 | 409151 | 670.2 | 3216 | 3140 | 605.8 |
| C | 15 | 208 | 66221 | 87.23 | 3157 | 3169 | 722.8 |
| C | 14 | 234 | 60689 | 79.58 | 3157 | 3169 | 722.8 |
| C | 13 | 61 | 23434 | 28.04 | 3157 | 3169 | 722.8 |
| D | 8 | 195 | 1559812 | 2072.04 | 3147 | 3062 | 751.3 |
| D | 1 | 52 | 1143822 | 1518.36 | 3147 | 3062 | 751.3 |
| D | 14 | 34 | 683568 | 905.76 | 3147 | 3062 | 751.3 |
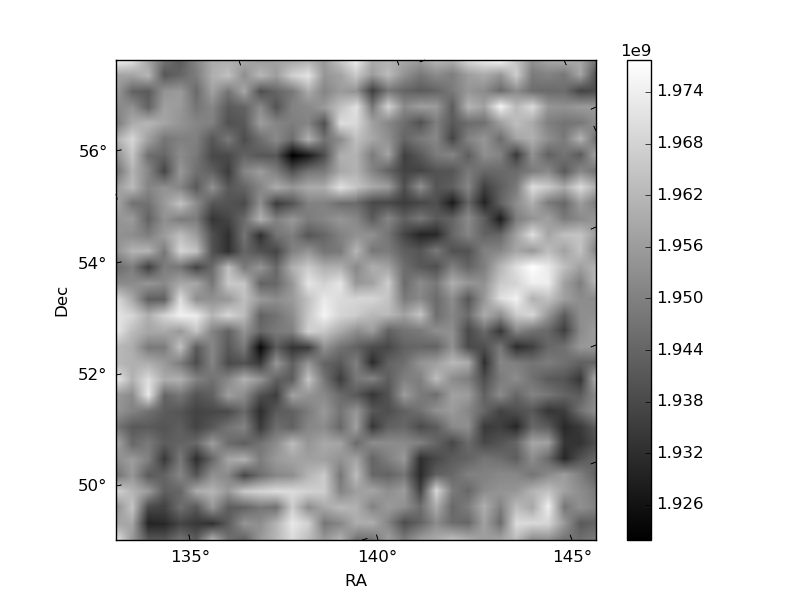
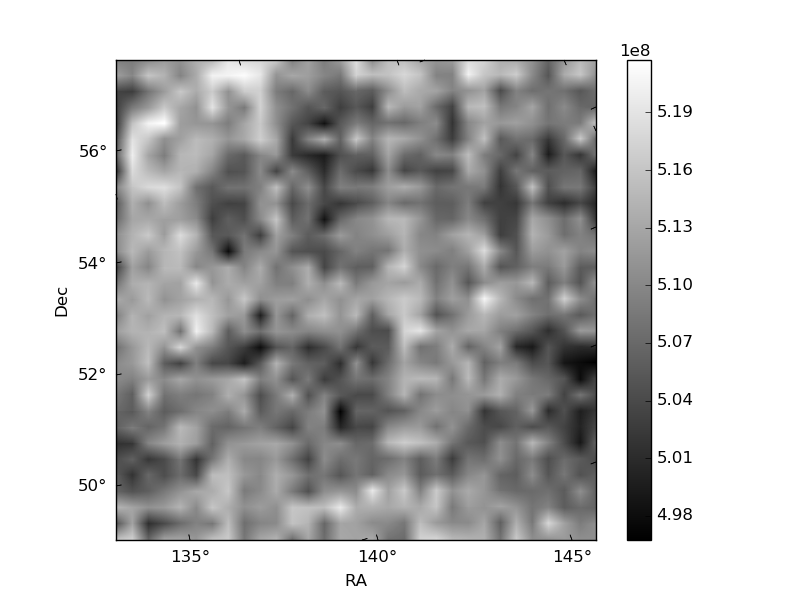
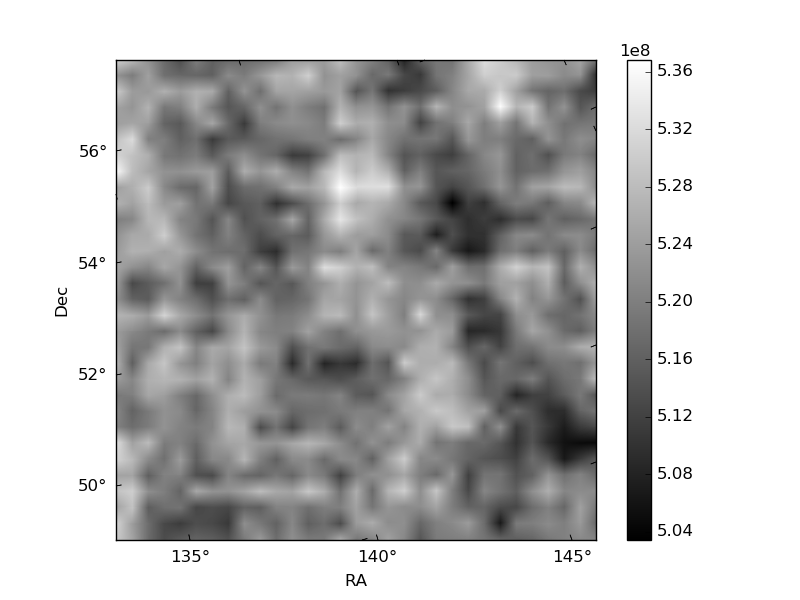
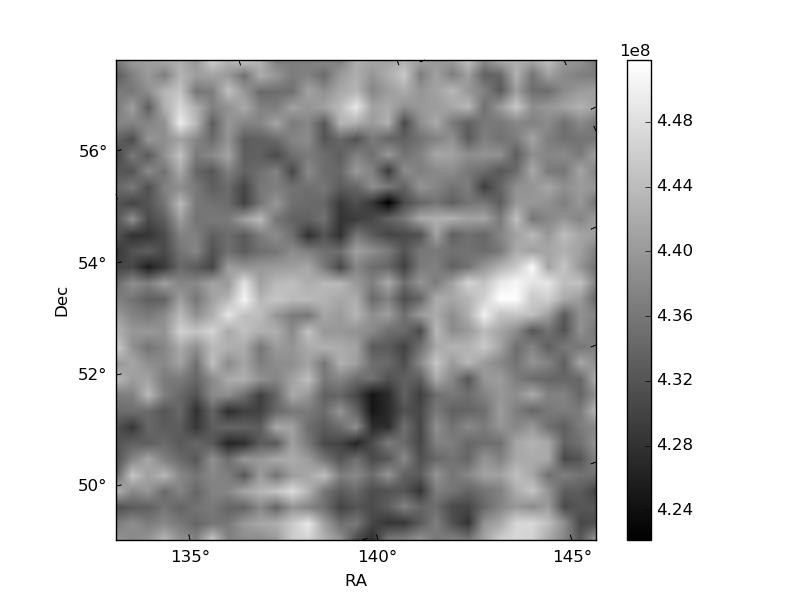
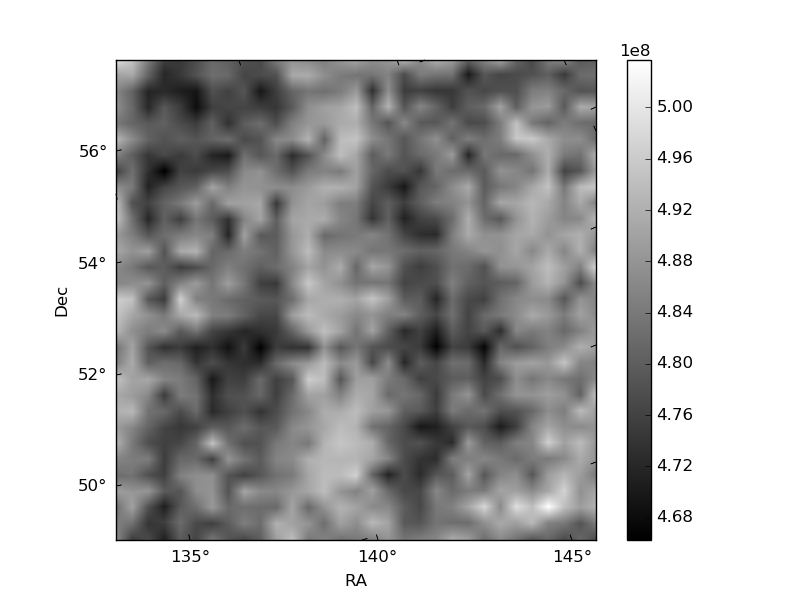
Histogram calculated using DETX and DETY for each event in the final _common_clean file
| Quadrant A | 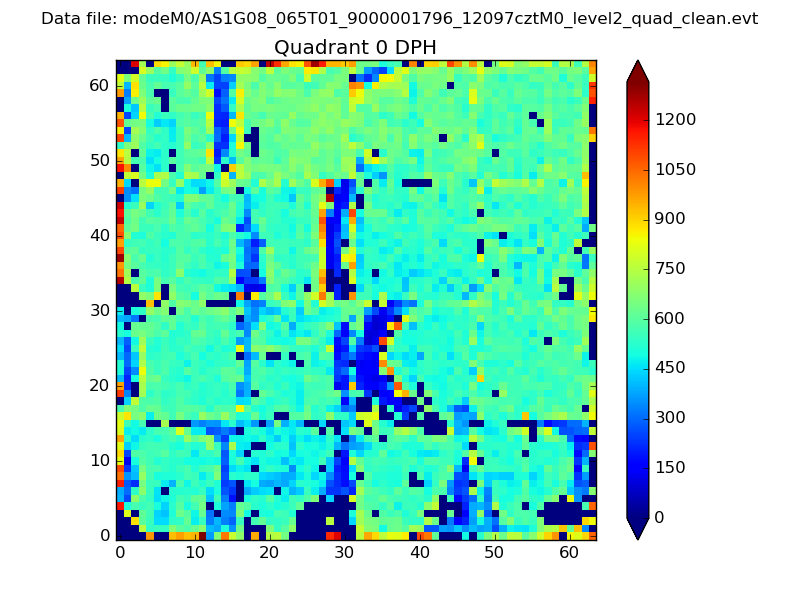 |
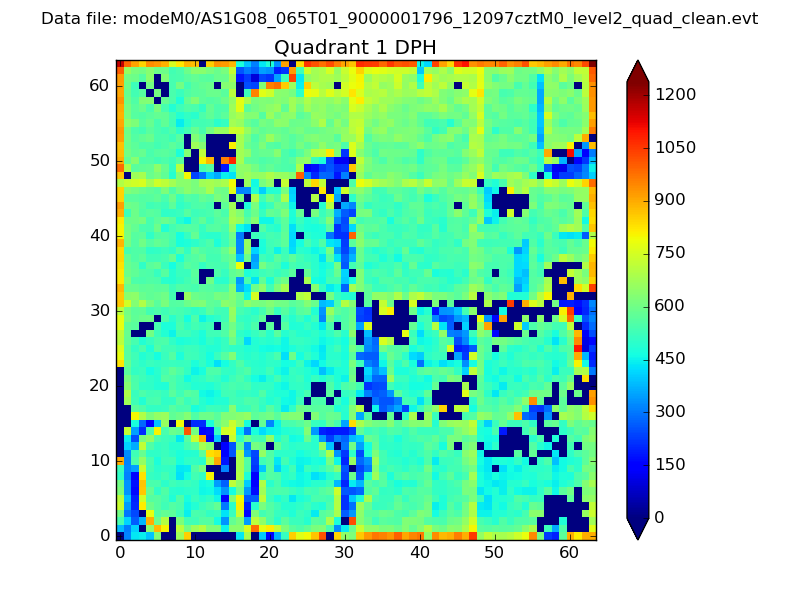 |
Quadrant B |
|---|---|---|---|
| Quadrant D | 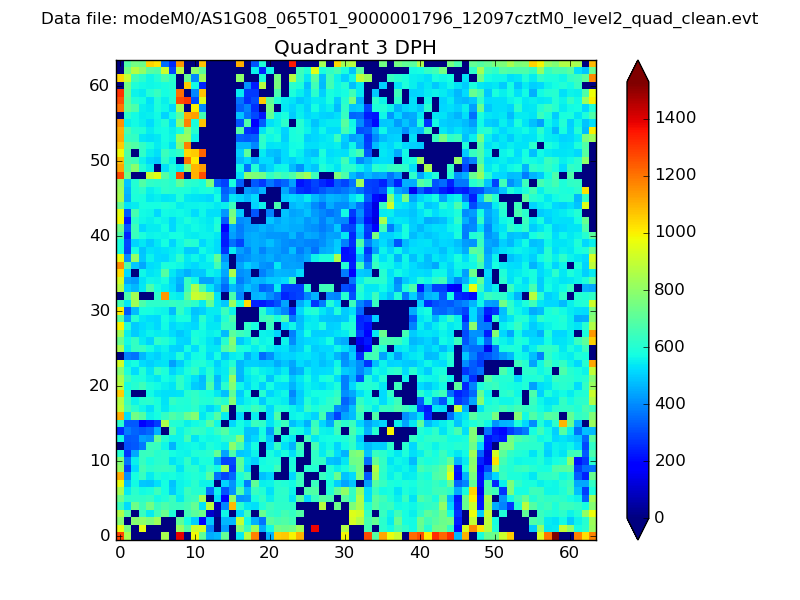 |
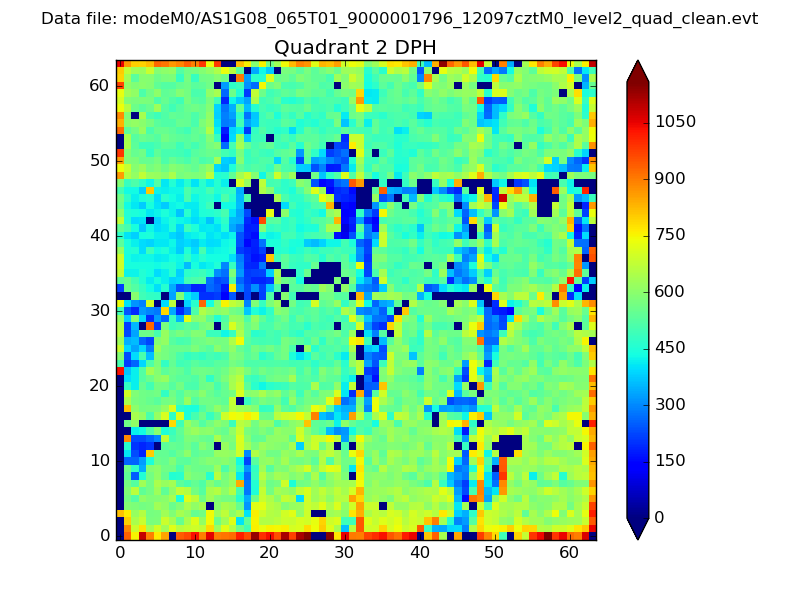 |
Quadrant C |
| Plot type | Count rate plots | Images |
|---|---|---|
| Comparison with Poisson distribution Blue bars denote a histogram of data divided into 1 sec bins. Red curve is a Poisson curve with rate = median count rate of data. |
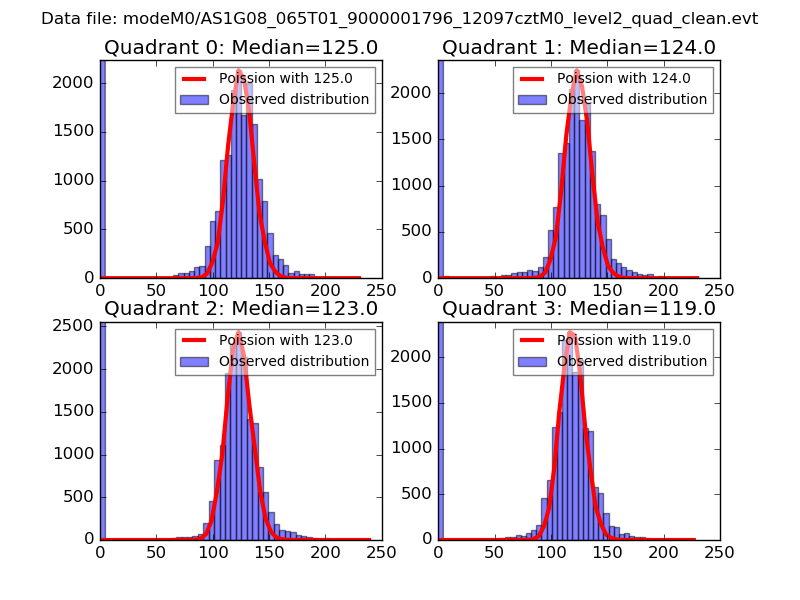 |
 |
| Quadrant-wise count rates Data is divided into 100 sec bins |
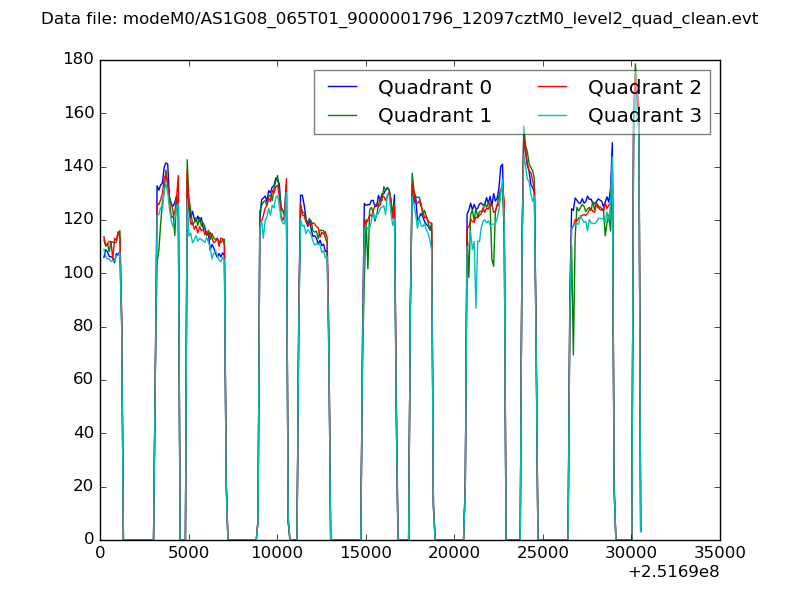 |
|
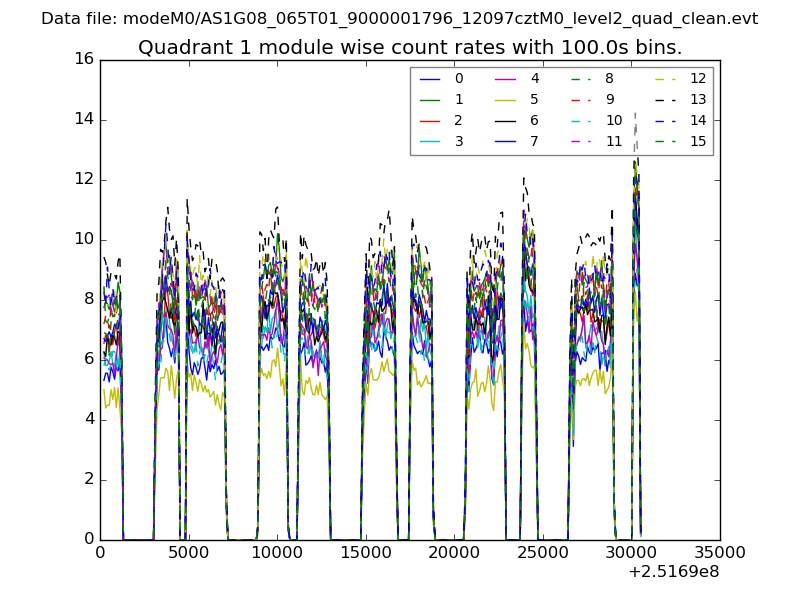
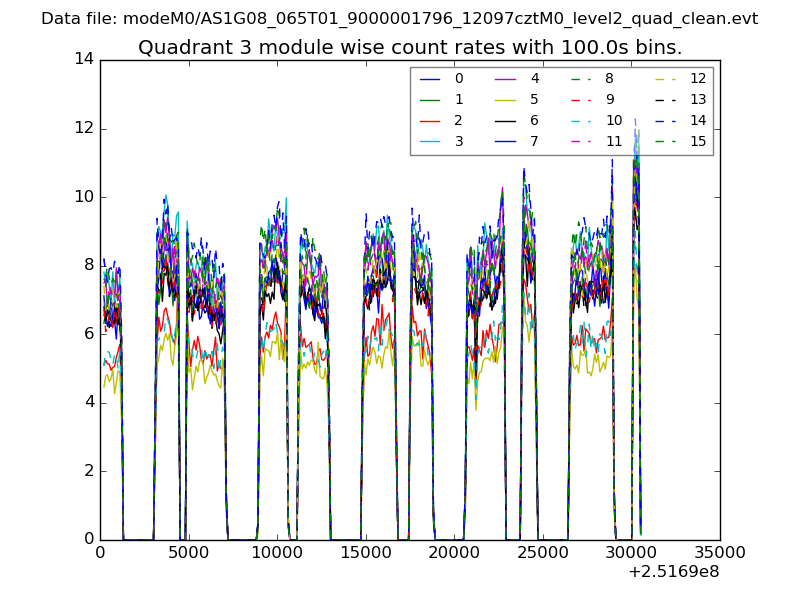
| Module-wise count rates for Quadrant A Data is divided into 100 sec bins |
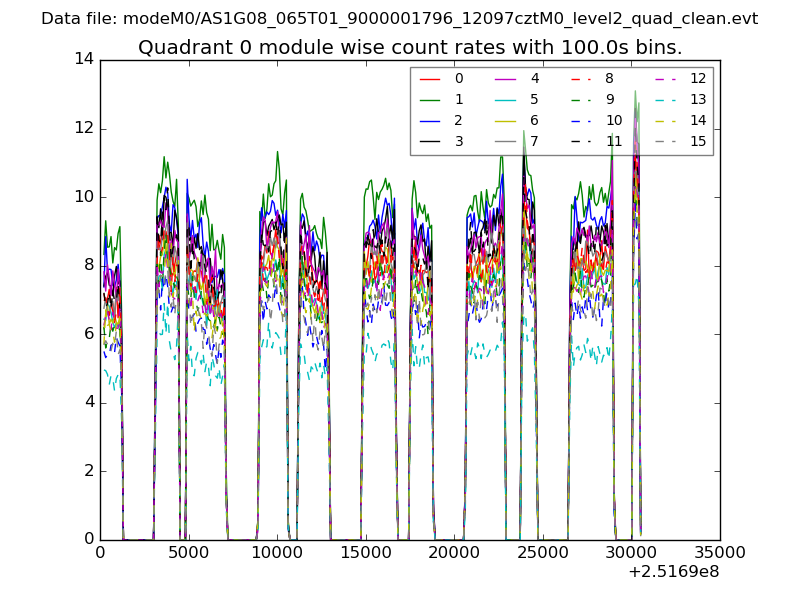 |
 |
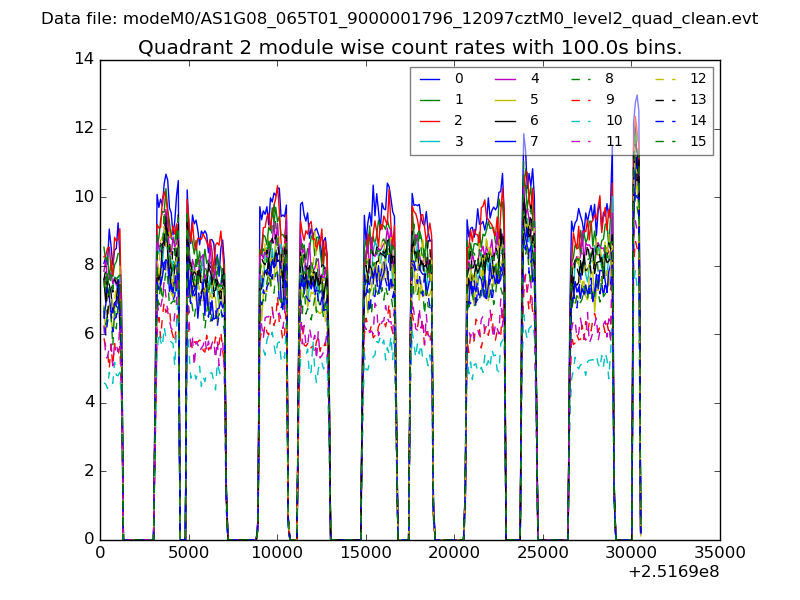
| Module-wise count rates for Quadrant B Data is divided into 100 sec bins |
 |
 |
| Module-wise count rates for Quadrant C Data is divided into 100 sec bins |
 |
 |
| Module-wise count rates for Quadrant D Data is divided into 100 sec bins |
 |
 |
| Parameter | Plot |
|---|---|
| CZT HV Monitor | 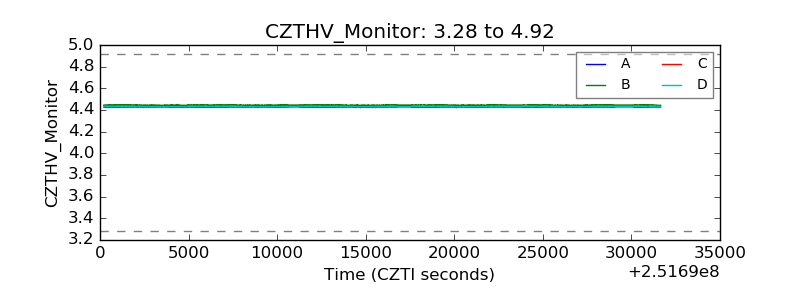 |
| D_VDD |  |
| Temperature 1 | 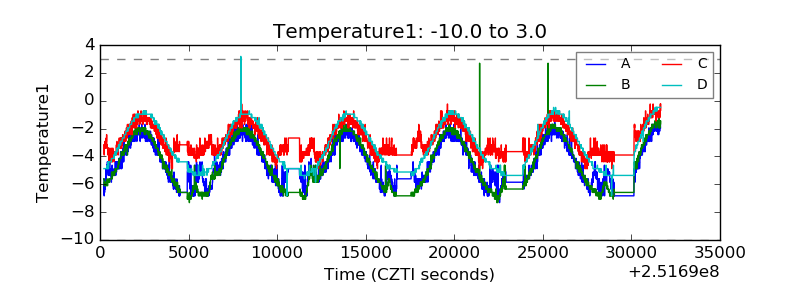 |
| Veto HV Monitor | 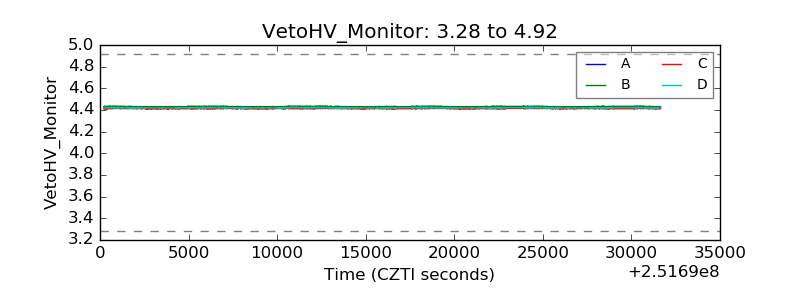 |
| Veto LLD | 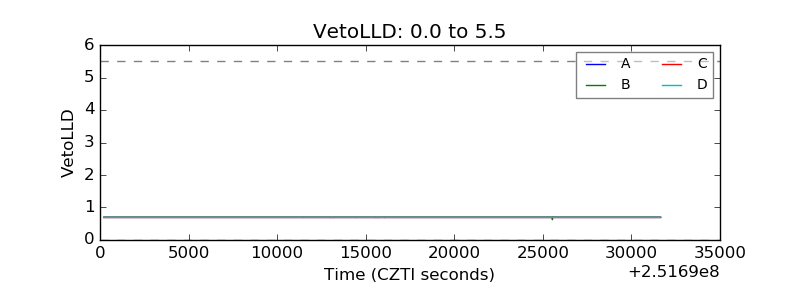 |
| Alpha Counter | 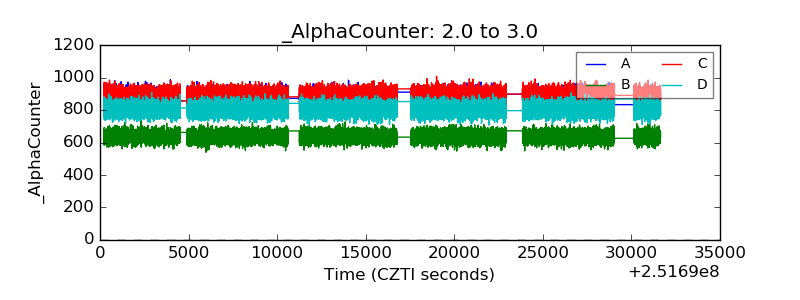 |
| _CPM_Rate | 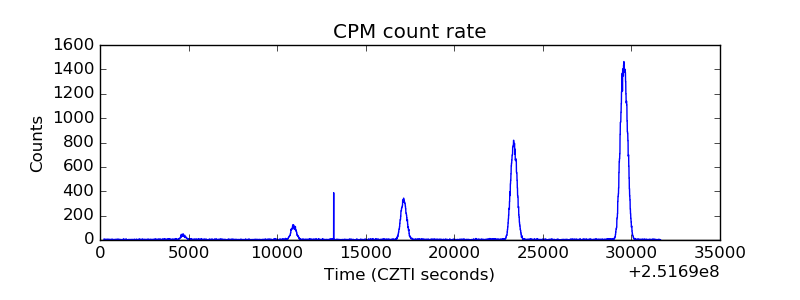 |
| CZT Counter | 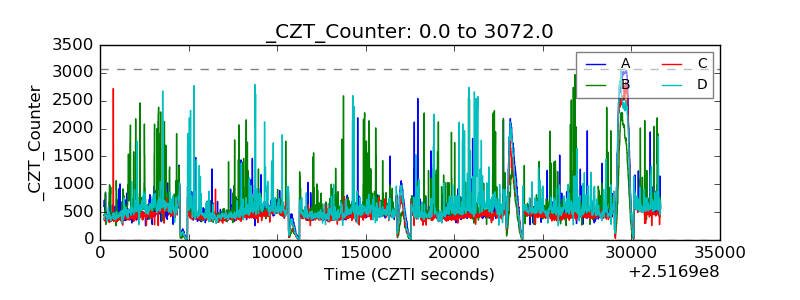 |
| +2.5 Volts monitor |  |
| +5 Volts monitor |  |
| _ROLL_ROT | 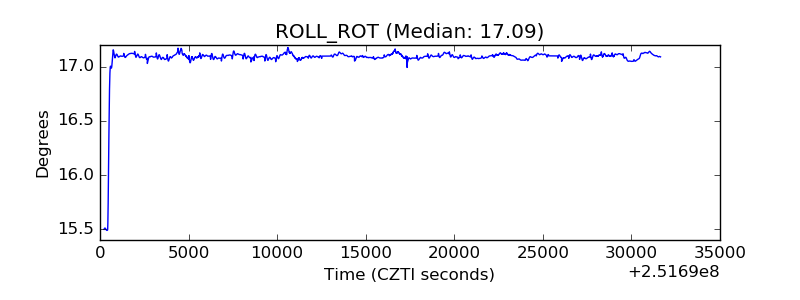 |
| _Roll_DEC | 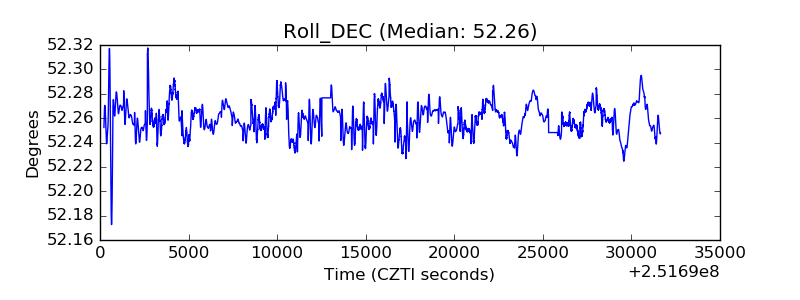 |
| _Roll_RA | 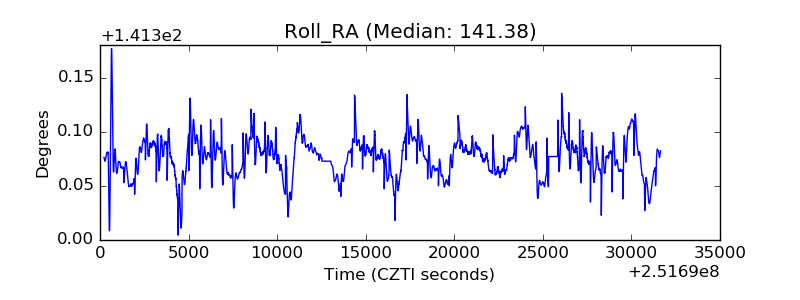 |
| Veto Counter | 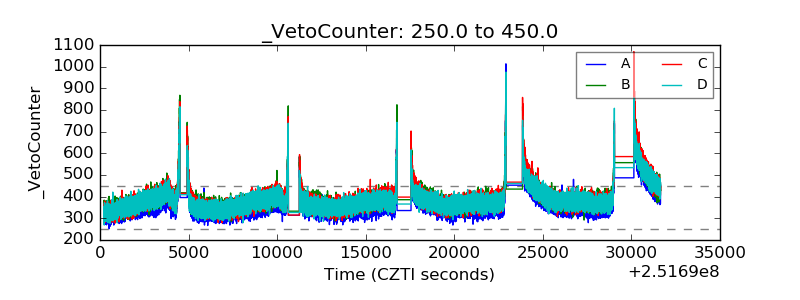 |