| Param | Original file | Final file |
|---|---|---|
| Filename | modeM0/AS1G08_065T01_9000001796_12099cztM0_level2.evt | modeM0/AS1G08_065T01_9000001796_12099cztM0_level2_quad_clean.evt |
| Size (bytes) | 535,504,320 | 69,762,240 |
| Size | 510.7 MB | 66.5 MB |
| Events in quadrant A | 3,545,324 | 431,491 |
| Events in quadrant B | 4,321,372 | 412,173 |
| Events in quadrant C | 3,265,240 | 421,256 |
| Events in quadrant D | 4,655,833 | 404,615 |
| Mode M0 | |||
|---|---|---|---|
| Quadrant | BADHDUFLAG | Total packets | Discarded packets |
| A | 0 | 14800 | 3 |
| B | 0 | 17118 | 2 |
| C | 0 | 13746 | 2 |
| D | 0 | 18277 | 2 |
| Mode M9 | |||
|---|---|---|---|
| Quadrant | BADHDUFLAG | Total packets | Discarded packets |
| A | 0 | 14 | 0 |
| B | 0 | 14 | 0 |
| C | 0 | 14 | 0 |
| D | 0 | 15 | 0 |
| Mode SS | |||
|---|---|---|---|
| Quadrant | BADHDUFLAG | Total packets | Discarded packets |
| A | 0 | 128 | 0 |
| B | 0 | 128 | 0 |
| C | 0 | 128 | 0 |
| D | 0 | 128 | 0 |
| Quadrant | Total seconds | Saturated seconds | Saturation percentage |
|---|---|---|---|
| A | 6346 | 131 | 2.064292% |
| B | 6346 | 360 | 5.672865% |
| C | 6346 | 89 | 1.402458% |
| D | 6346 | 239 | 3.766152% |
Noise dominated data is calculated using 1-second bins in cleaned event files. If a bin has >2000 counts, and if more than 50% of those come from <1% of pixels, then it is considered to be noise-dominated and hence unusable.
| Quadrant | # 1 sec bins | Bins with >0 counts | Bins with >2000 counts | High rate bins dominated by noise | Noise dominated (total time) | Noise dominated (detector-on time) | Marked lightcurve |
|---|---|---|---|---|---|---|---|
| A | 7622 | 6347 | 7 | 7 | 0.09% | 0.11% | 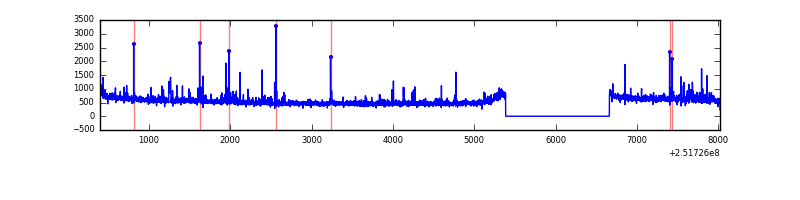 |
| B | 7622 | 6347 | 161 | 161 | 2.11% | 2.54% |  |
| C | 7622 | 6347 | 0 | 0 | 0.00% | 0.00% | 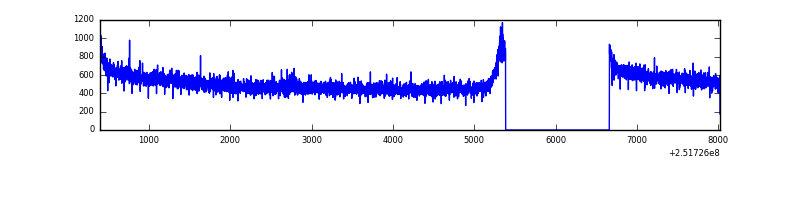 |
| D | 7622 | 6347 | 116 | 116 | 1.52% | 1.83% | 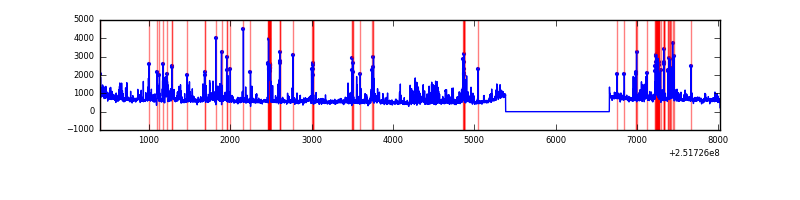 |
Top three noisy pixels from each quadrant. If the there are fewer than three noisy pixels in the level2.evt file, extra rows are filled as -1
| Pixel properties | Quadrant properties | ||||||
|---|---|---|---|---|---|---|---|
| Quadrant | DetID | PixID | Counts | Sigma | Mean | Median | Sigma |
| A | 1 | 162 | 67806 | 391.84 | 861 | 845 | 170.9 |
| A | 14 | 63 | 31820 | 181.26 | 861 | 845 | 170.9 |
| A | 1 | 178 | 27530 | 156.15 | 861 | 845 | 170.9 |
| B | 4 | 239 | 698467 | 4485.45 | 840 | 821 | 155.5 |
| B | 11 | 51 | 137038 | 875.79 | 840 | 821 | 155.5 |
| B | 15 | 204 | 118110 | 754.1 | 840 | 821 | 155.5 |
| C | 14 | 67 | 11449 | 56.25 | 833 | 838 | 188.6 |
| C | 13 | 61 | 6236 | 28.62 | 833 | 838 | 188.6 |
| C | 15 | 208 | 2945 | 11.17 | 833 | 838 | 188.6 |
| D | 1 | 52 | 652838 | 3317.72 | 828 | 807 | 196.5 |
| D | 8 | 195 | 410334 | 2083.79 | 828 | 807 | 196.5 |
| D | 14 | 34 | 140591 | 711.26 | 828 | 807 | 196.5 |
Histogram calculated using DETX and DETY for each event in the final _common_clean file
| Quadrant A | 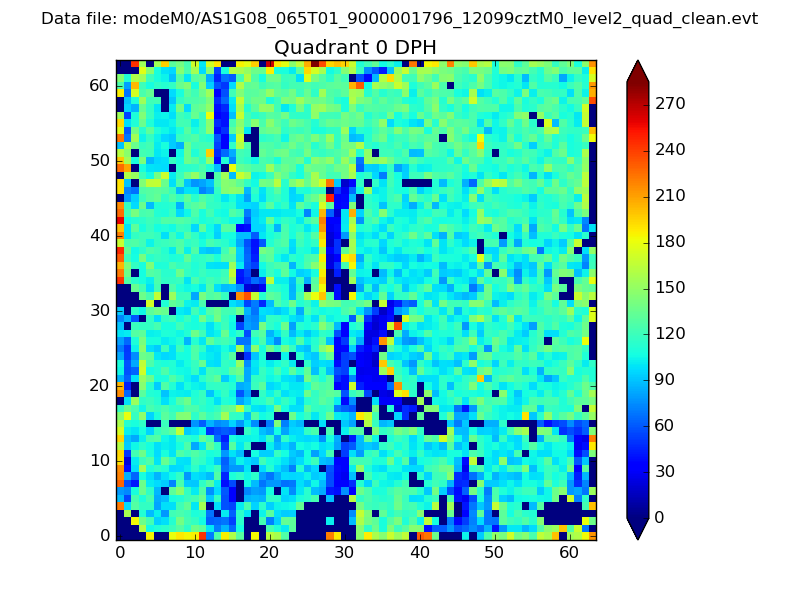 |
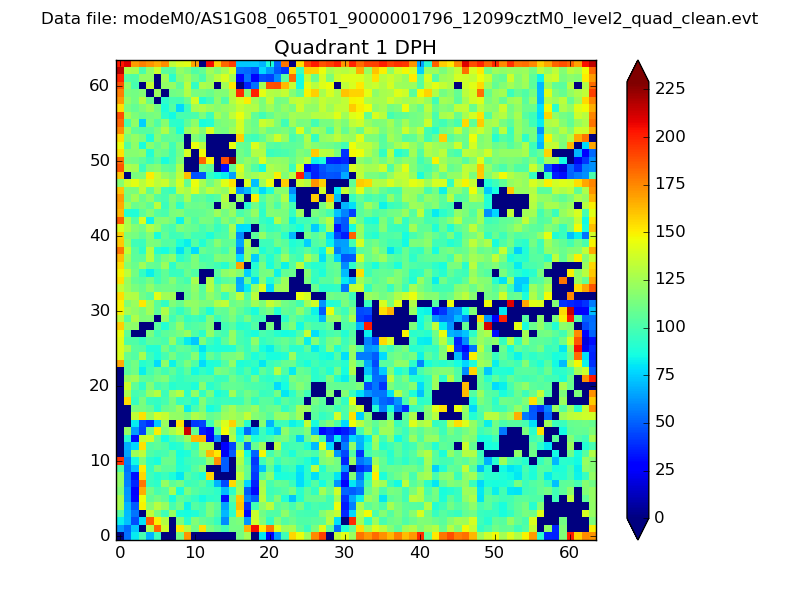 |
Quadrant B |
|---|---|---|---|
| Quadrant D | 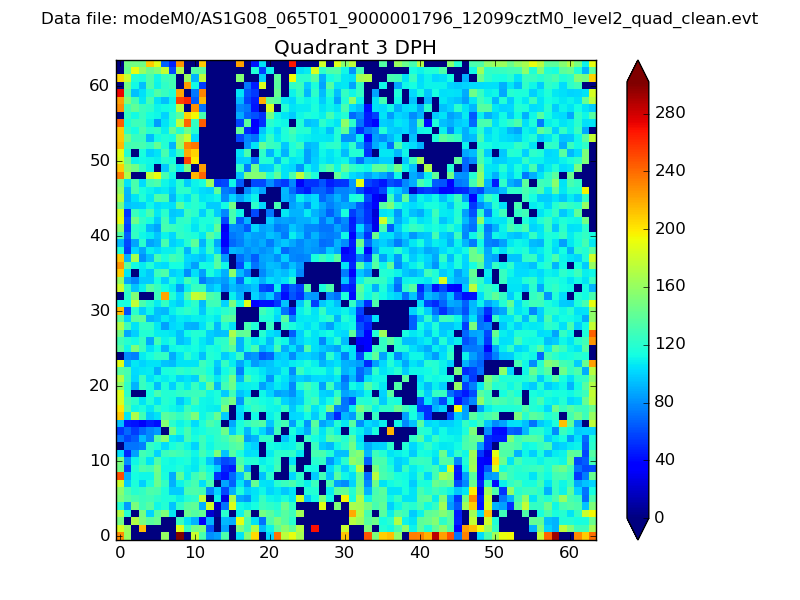 |
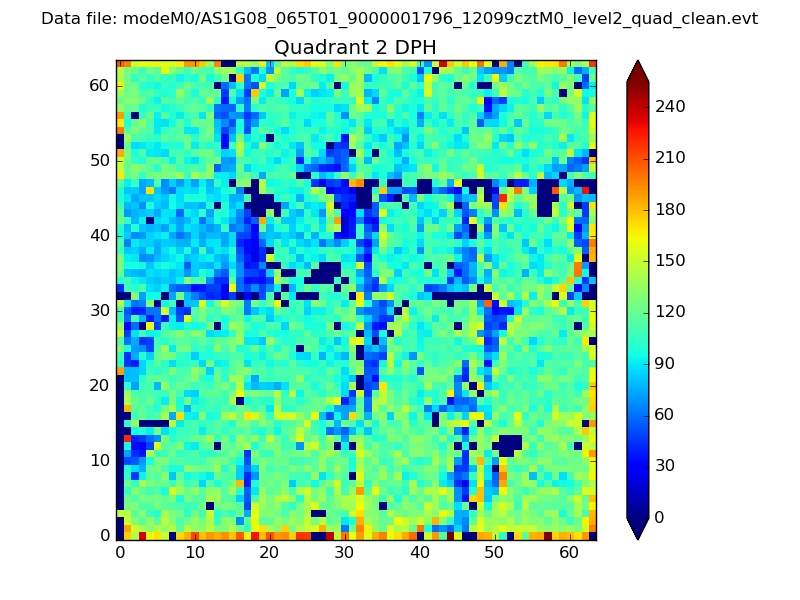 |
Quadrant C |
| Plot type | Count rate plots | Images |
|---|---|---|
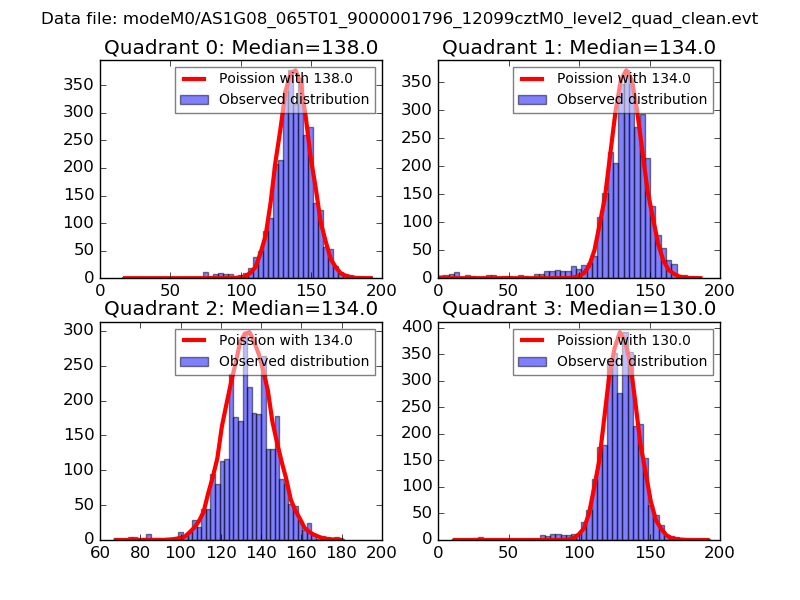
| Comparison with Poisson distribution Blue bars denote a histogram of data divided into 1 sec bins. Red curve is a Poisson curve with rate = median count rate of data. |
 |
 |
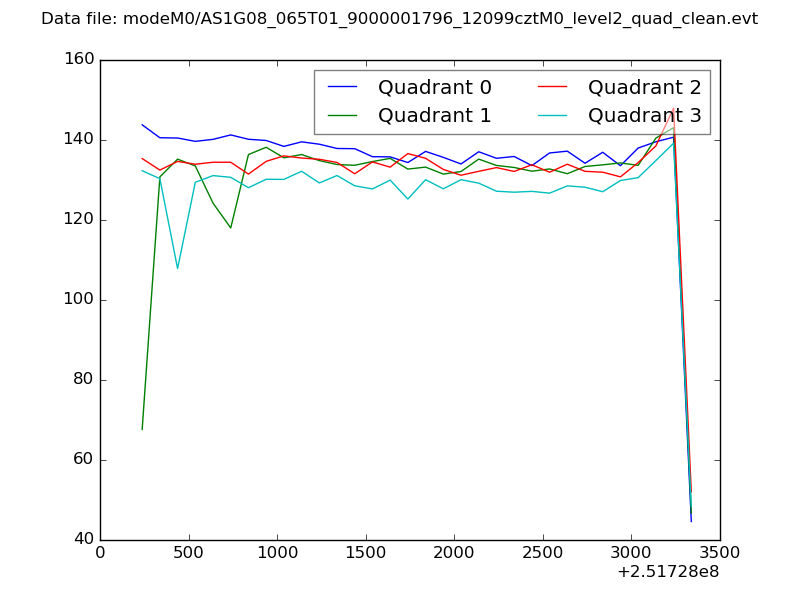
| Quadrant-wise count rates Data is divided into 100 sec bins |
 |
|
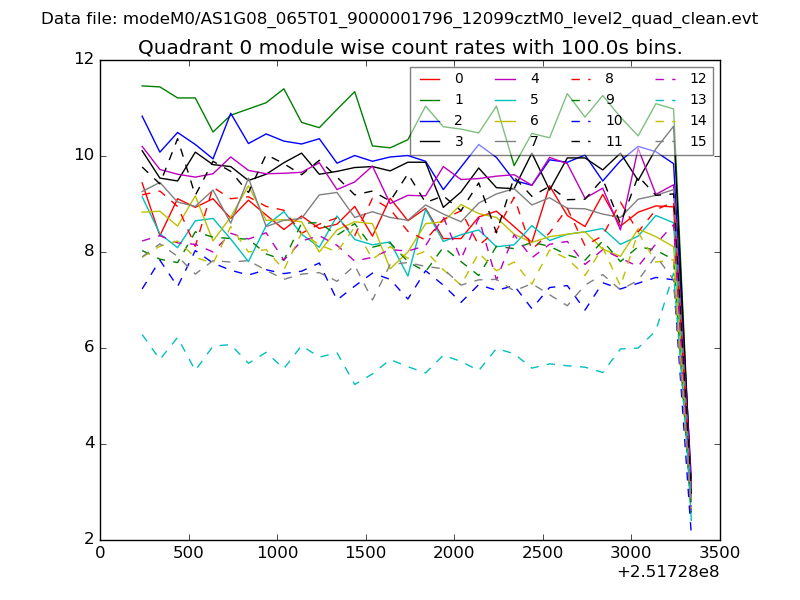
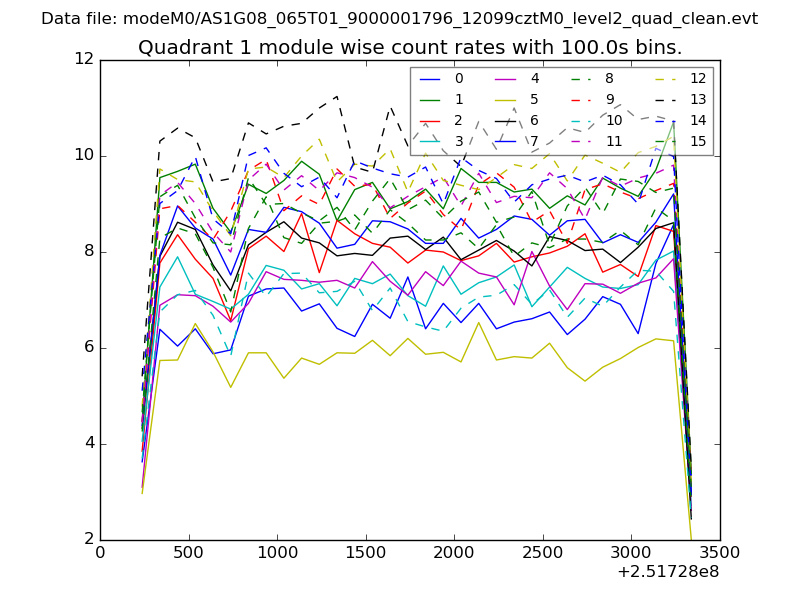
| Module-wise count rates for Quadrant A Data is divided into 100 sec bins |
 |
 |
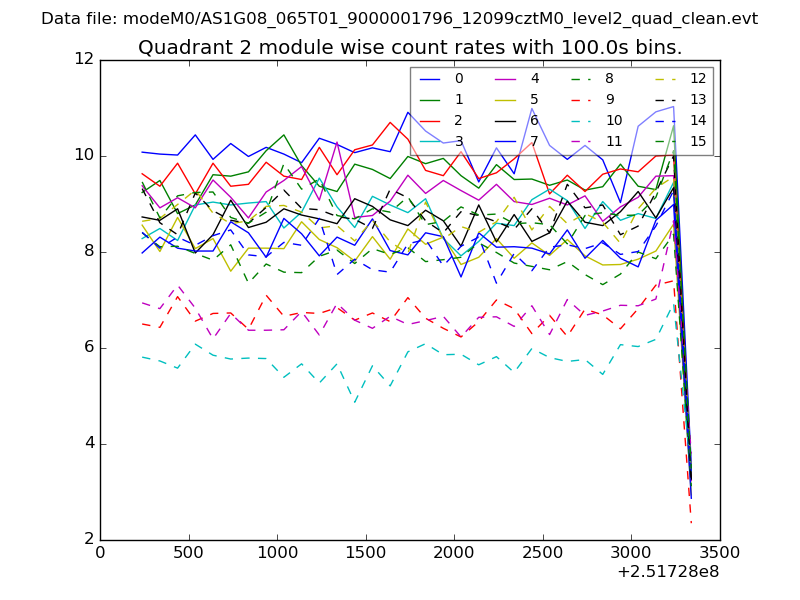
| Module-wise count rates for Quadrant B Data is divided into 100 sec bins |
 |
 |
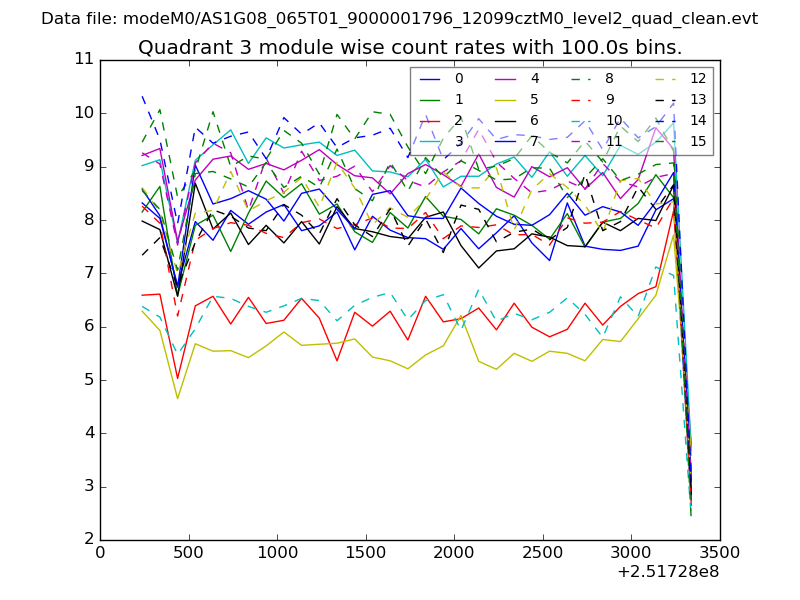
| Module-wise count rates for Quadrant C Data is divided into 100 sec bins |
 |
 |
| Module-wise count rates for Quadrant D Data is divided into 100 sec bins |
 |
 |
| Parameter | Plot |
|---|---|
| CZT HV Monitor | 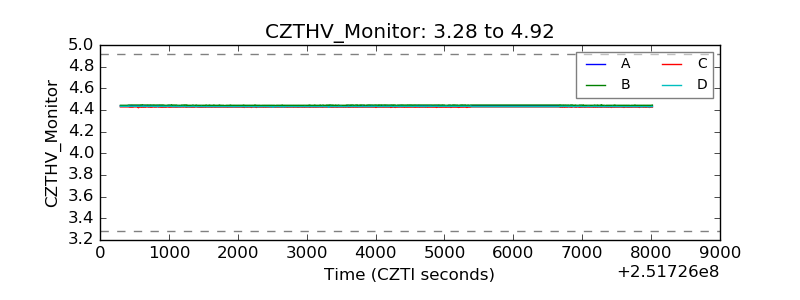 |
| D_VDD | 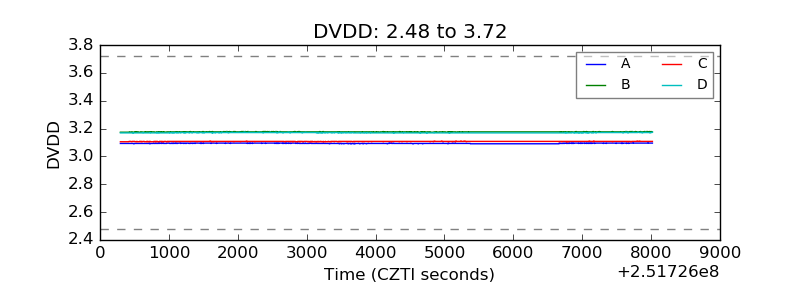 |
| Temperature 1 | 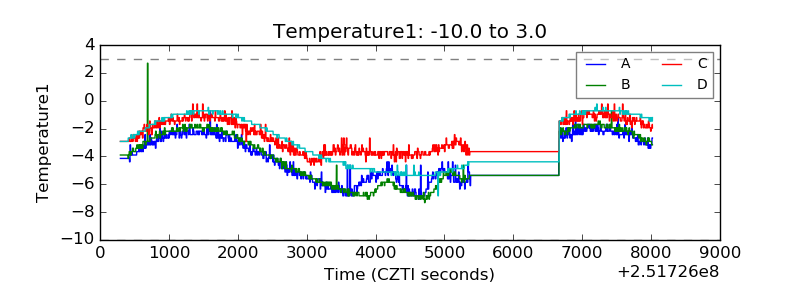 |
| Veto HV Monitor | 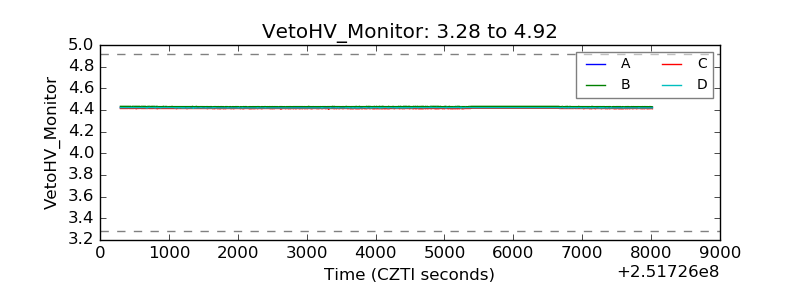 |
| Veto LLD | 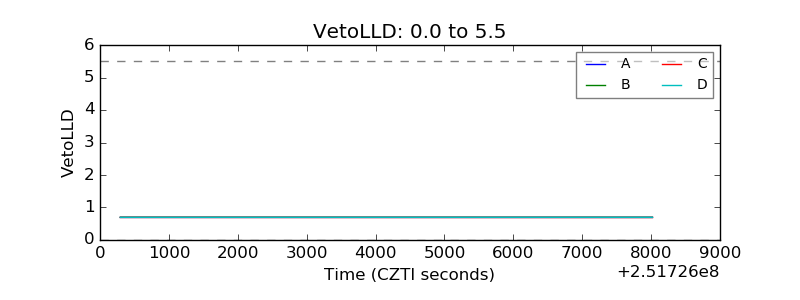 |
| Alpha Counter | 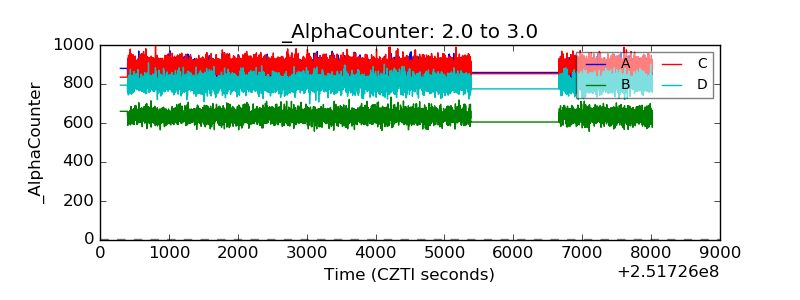 |
| _CPM_Rate | 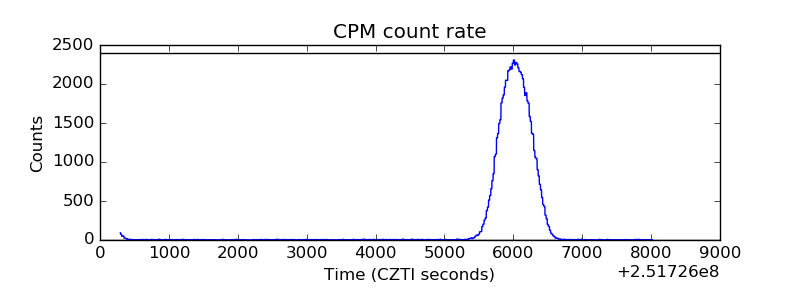 |
| CZT Counter | 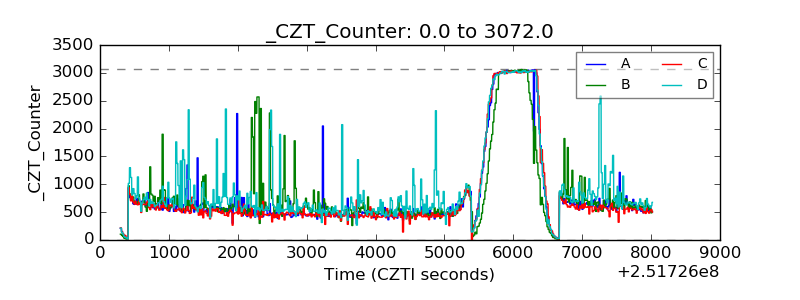 |
| +2.5 Volts monitor |  |
| +5 Volts monitor |  |
| _ROLL_ROT | 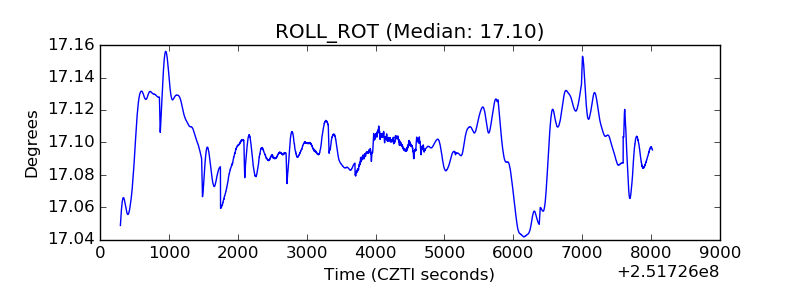 |
| _Roll_DEC | 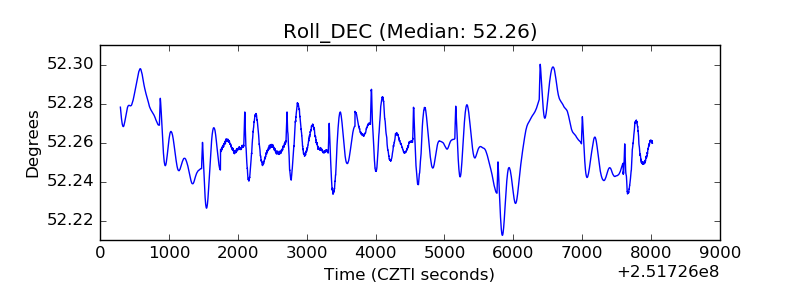 |
| _Roll_RA | 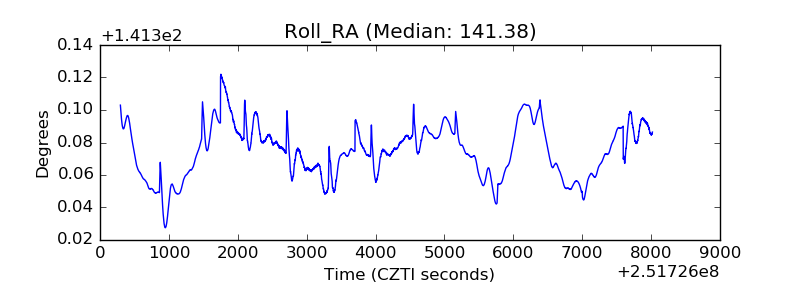 |
| Veto Counter | 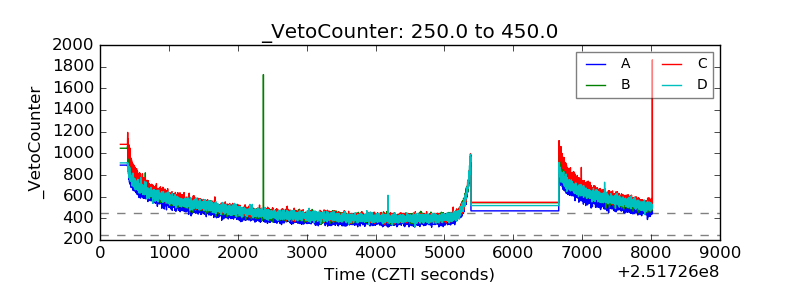 |