| Param | Original file | Final file |
|---|---|---|
| Filename | modeM0/AS1G08_065T01_9000001796_12100cztM0_level2.evt | modeM0/AS1G08_065T01_9000001796_12100cztM0_level2_quad_clean.evt |
| Size (bytes) | 585,463,680 | 83,332,800 |
| Size | 558.3 MB | 79.5 MB |
| Events in quadrant A | 3,564,486 | 541,866 |
| Events in quadrant B | 4,682,488 | 518,633 |
| Events in quadrant C | 3,247,950 | 534,941 |
| Events in quadrant D | 5,812,343 | 490,965 |
| Mode M0 | |||
|---|---|---|---|
| Quadrant | BADHDUFLAG | Total packets | Discarded packets |
| A | 0 | 14857 | 3 |
| B | 0 | 18215 | 2 |
| C | 0 | 13595 | 2 |
| D | 0 | 21700 | 2 |
| Mode M9 | |||
|---|---|---|---|
| Quadrant | BADHDUFLAG | Total packets | Discarded packets |
| A | 0 | 24 | 0 |
| B | 0 | 24 | 0 |
| C | 0 | 24 | 0 |
| D | 0 | 25 | 0 |
| Mode SS | |||
|---|---|---|---|
| Quadrant | BADHDUFLAG | Total packets | Discarded packets |
| A | 0 | 126 | 0 |
| B | 0 | 126 | 0 |
| C | 0 | 126 | 0 |
| D | 0 | 126 | 0 |
| Quadrant | Total seconds | Saturated seconds | Saturation percentage |
|---|---|---|---|
| A | 6263 | 109 | 1.740380% |
| B | 6263 | 458 | 7.312789% |
| C | 6263 | 67 | 1.069775% |
| D | 6263 | 574 | 9.164937% |
Noise dominated data is calculated using 1-second bins in cleaned event files. If a bin has >2000 counts, and if more than 50% of those come from <1% of pixels, then it is considered to be noise-dominated and hence unusable.
| Quadrant | # 1 sec bins | Bins with >0 counts | Bins with >2000 counts | High rate bins dominated by noise | Noise dominated (total time) | Noise dominated (detector-on time) | Marked lightcurve |
|---|---|---|---|---|---|---|---|
| A | 7614 | 6264 | 5 | 5 | 0.07% | 0.08% | 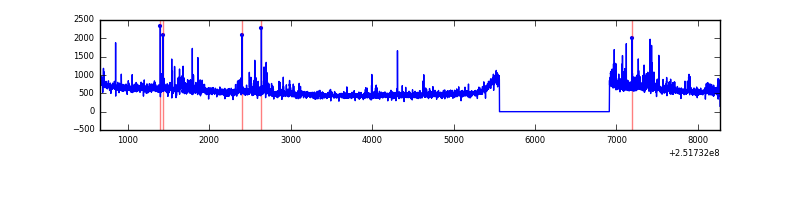 |
| B | 7613 | 6263 | 212 | 212 | 2.78% | 3.38% | 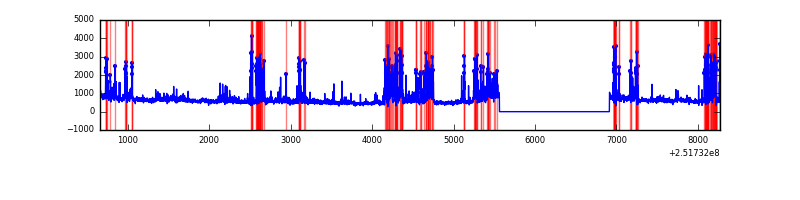 |
| C | 7614 | 6264 | 1 | 1 | 0.01% | 0.02% | 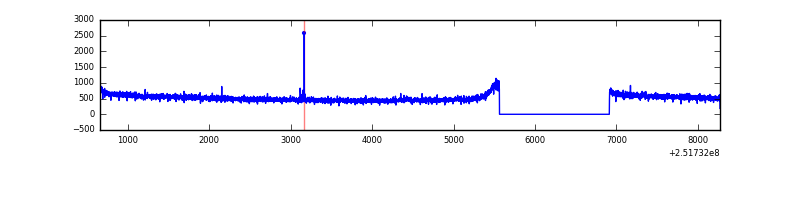 |
| D | 7614 | 6264 | 450 | 450 | 5.91% | 7.18% | 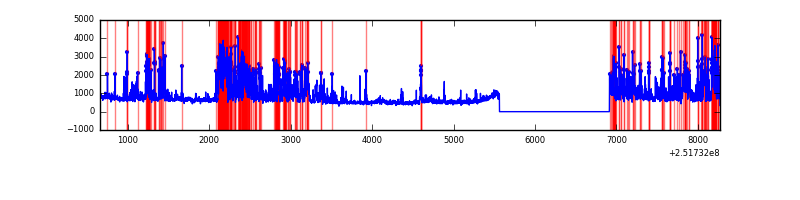 |
Top three noisy pixels from each quadrant. If the there are fewer than three noisy pixels in the level2.evt file, extra rows are filled as -1
| Pixel properties | Quadrant properties | ||||||
|---|---|---|---|---|---|---|---|
| Quadrant | DetID | PixID | Counts | Sigma | Mean | Median | Sigma |
| A | 14 | 63 | 75374 | 444.5 | 846 | 832 | 167.7 |
| A | 13 | 251 | 70100 | 413.05 | 846 | 832 | 167.7 |
| A | 1 | 162 | 50324 | 295.12 | 846 | 832 | 167.7 |
| B | 4 | 239 | 1148580 | 7591.85 | 821 | 805 | 151.2 |
| B | 11 | 51 | 134074 | 881.5 | 821 | 805 | 151.2 |
| B | 15 | 204 | 99683 | 654.02 | 821 | 805 | 151.2 |
| C | 5 | 252 | 10554 | 51.94 | 828 | 834 | 187.1 |
| C | 14 | 234 | 6364 | 29.55 | 828 | 834 | 187.1 |
| C | 13 | 61 | 6301 | 29.21 | 828 | 834 | 187.1 |
| D | 1 | 52 | 2019103 | 10673.61 | 802 | 783 | 189.1 |
| D | 8 | 195 | 420811 | 2221.26 | 802 | 783 | 189.1 |
| D | 14 | 34 | 123008 | 646.37 | 802 | 783 | 189.1 |
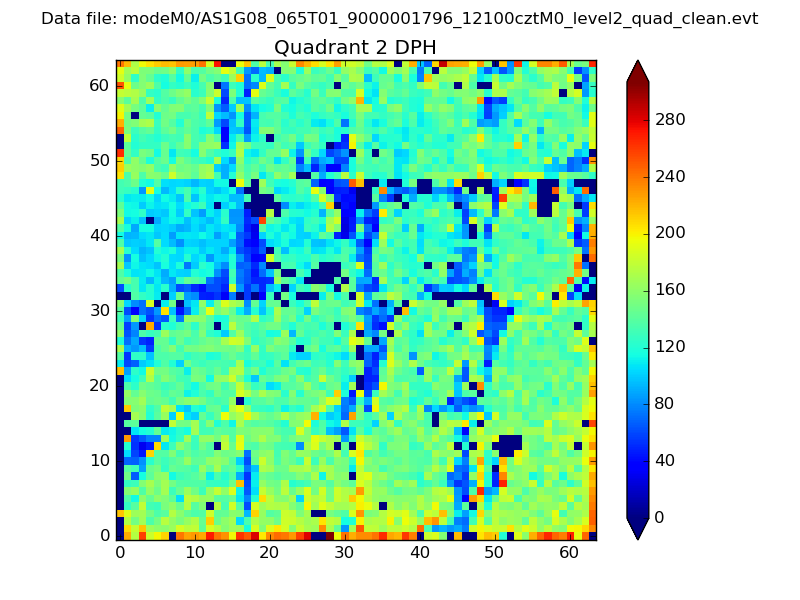
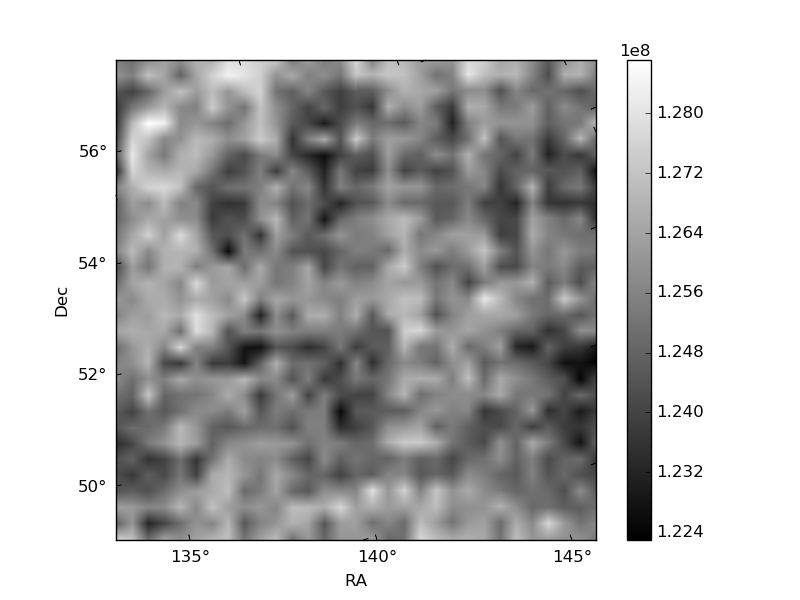
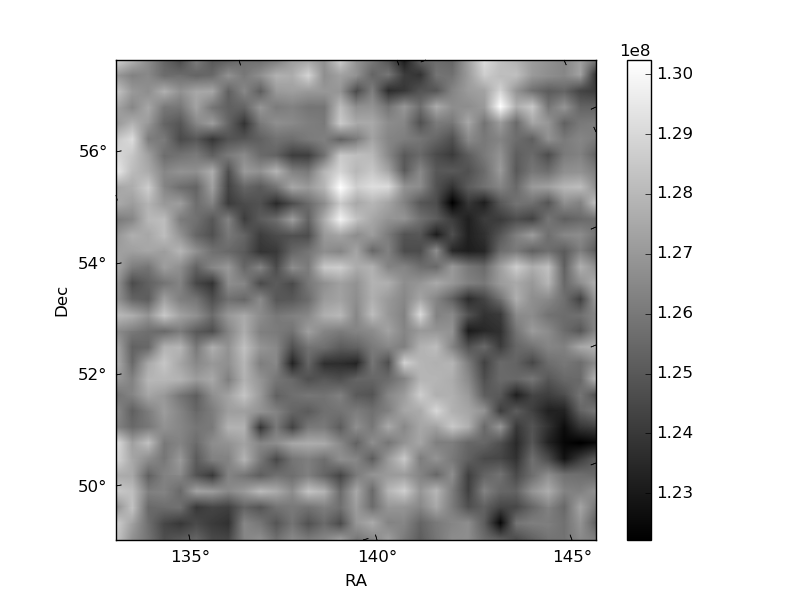
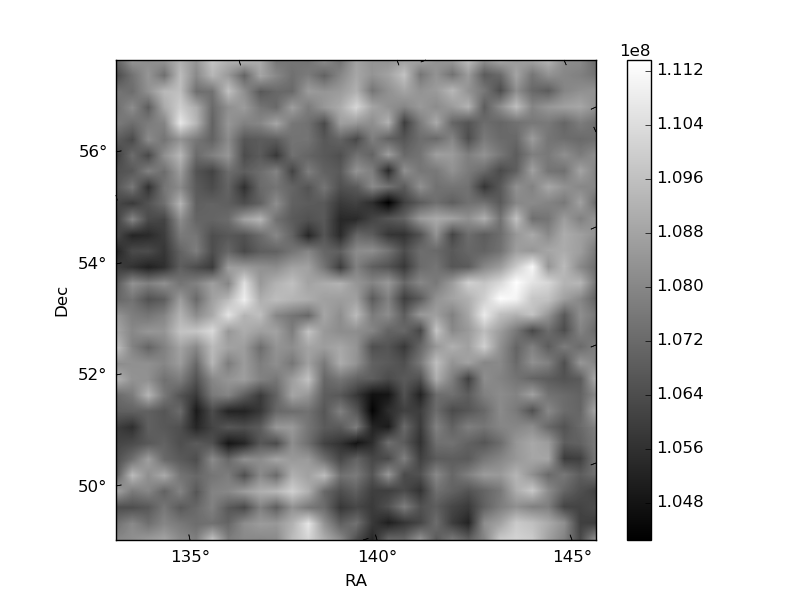
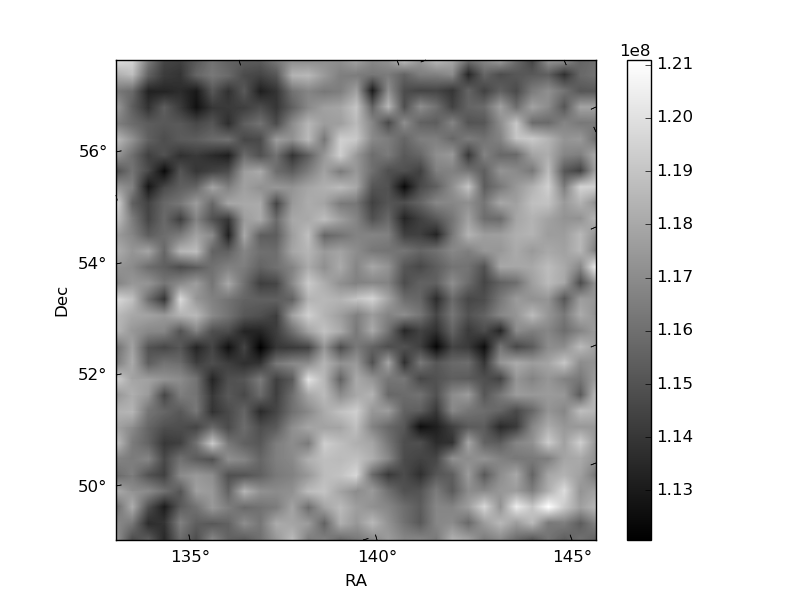
Histogram calculated using DETX and DETY for each event in the final _common_clean file
| Quadrant A | 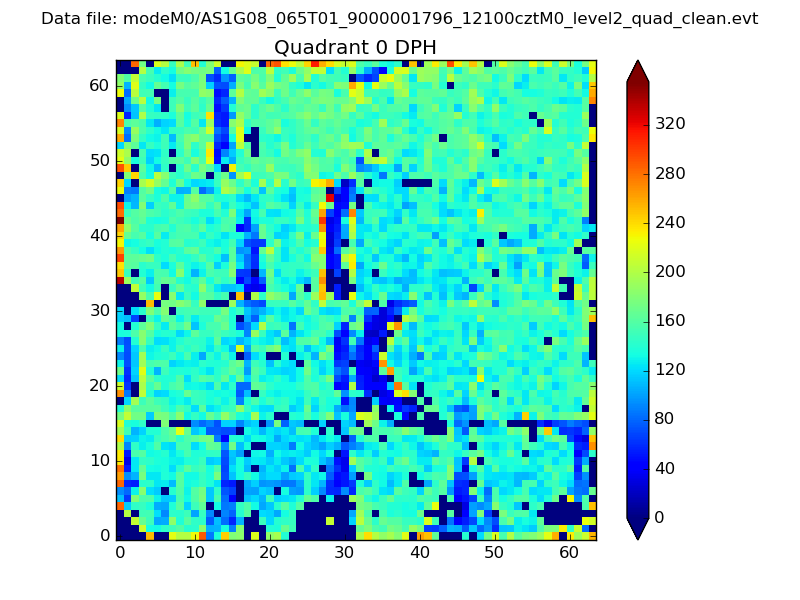 |
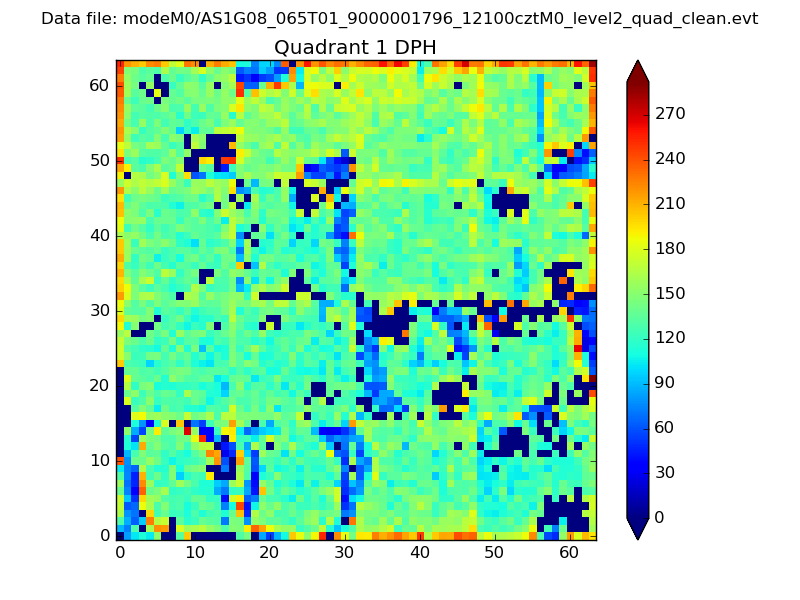 |
Quadrant B |
|---|---|---|---|
| Quadrant D | 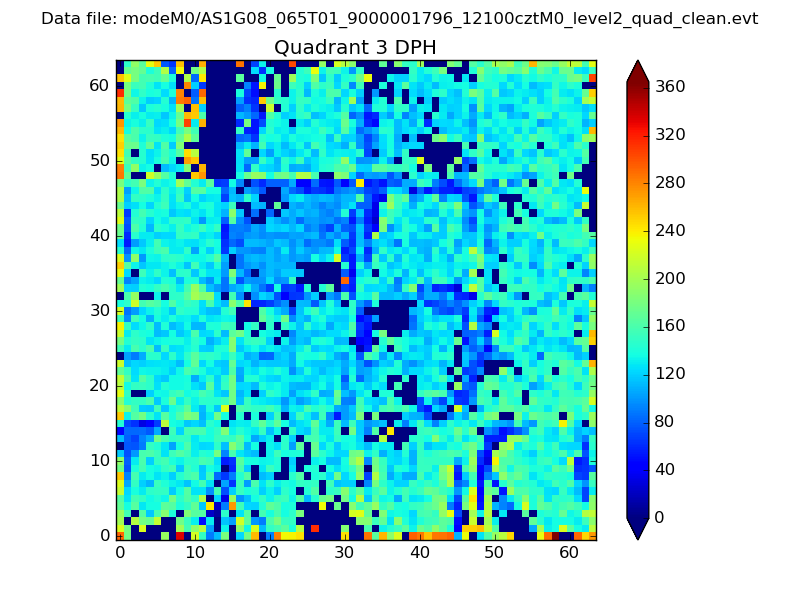 |
 |
Quadrant C |
| Plot type | Count rate plots | Images |
|---|---|---|
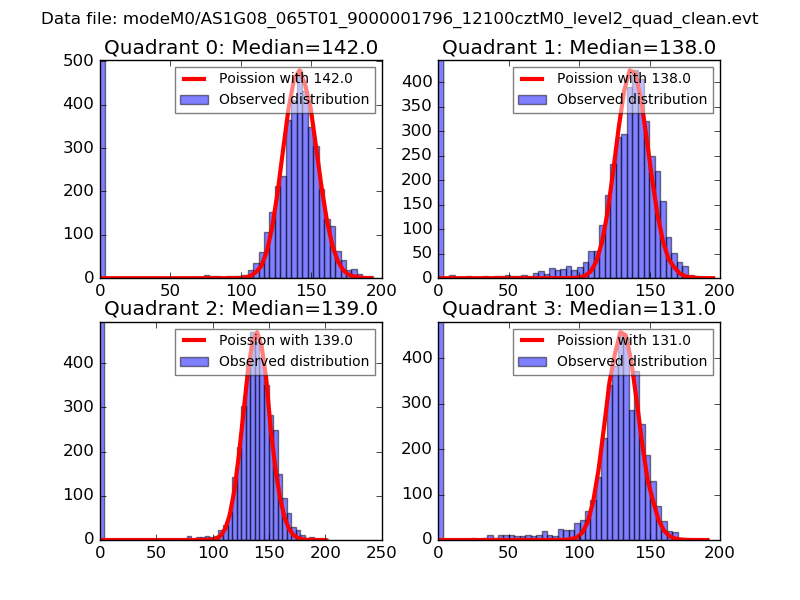
| Comparison with Poisson distribution Blue bars denote a histogram of data divided into 1 sec bins. Red curve is a Poisson curve with rate = median count rate of data. |
 |
 |
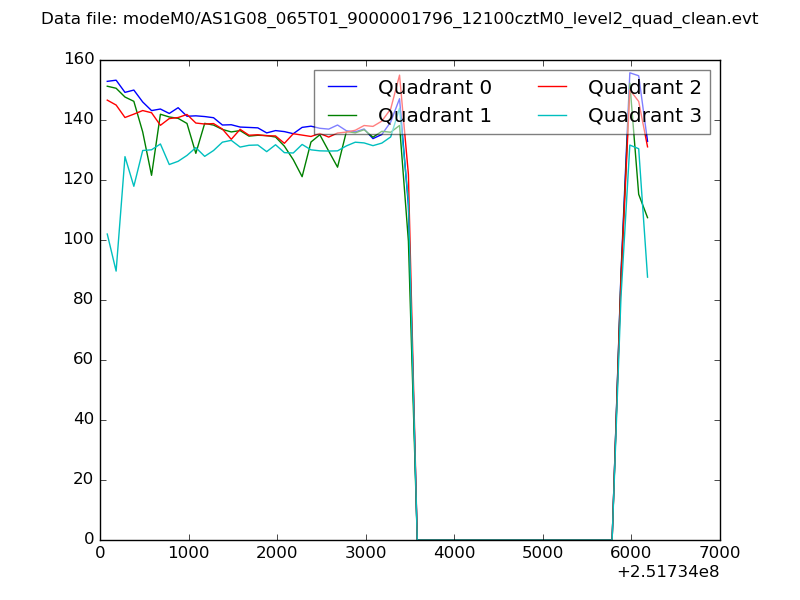
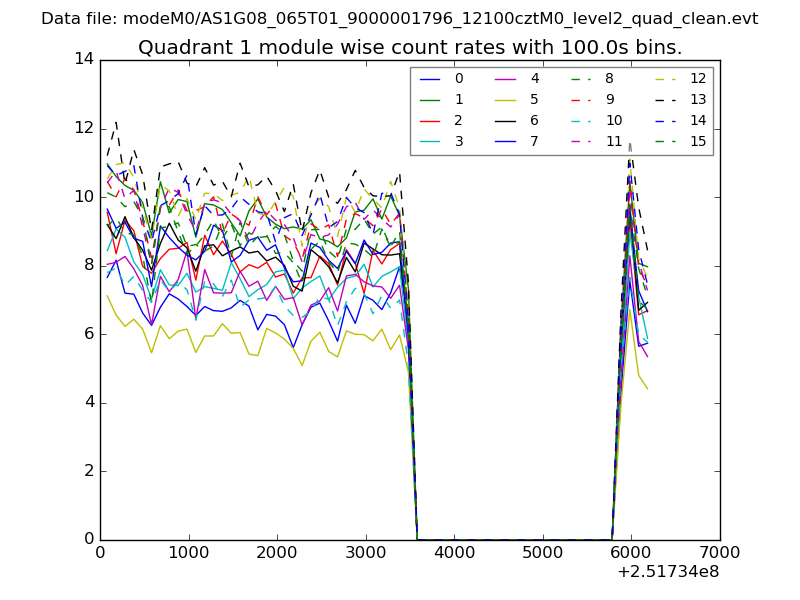
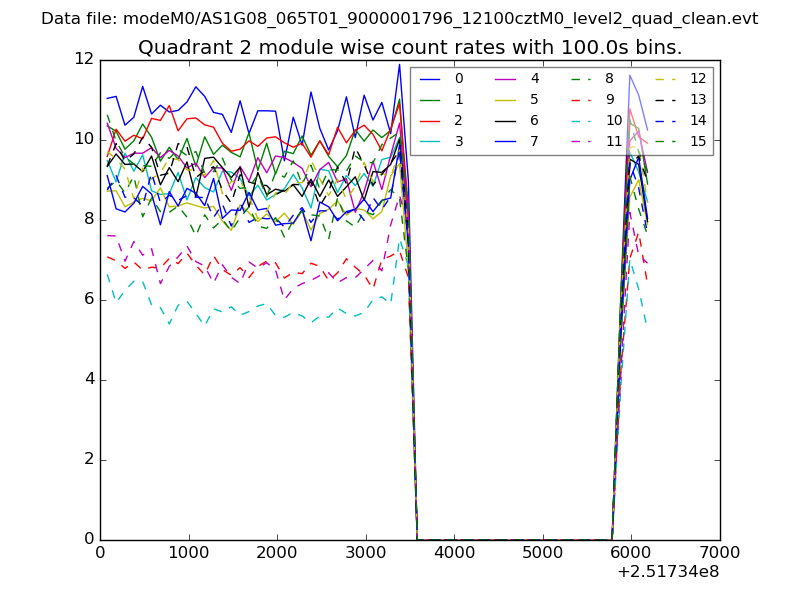
| Quadrant-wise count rates Data is divided into 100 sec bins |
 |
|
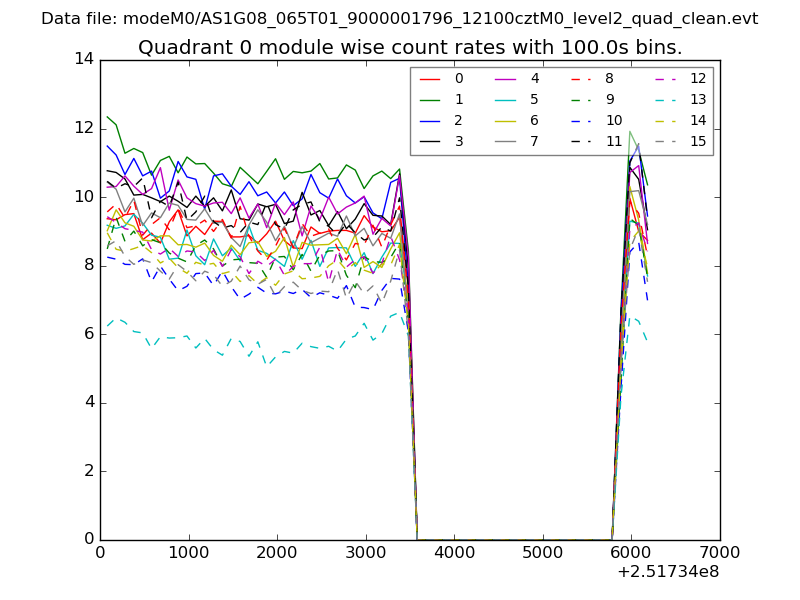
| Module-wise count rates for Quadrant A Data is divided into 100 sec bins |
 |
 |
| Module-wise count rates for Quadrant B Data is divided into 100 sec bins |
 |
 |
| Module-wise count rates for Quadrant C Data is divided into 100 sec bins |
 |
 |
| Module-wise count rates for Quadrant D Data is divided into 100 sec bins |
 |
 |
| Parameter | Plot |
|---|---|
| CZT HV Monitor | 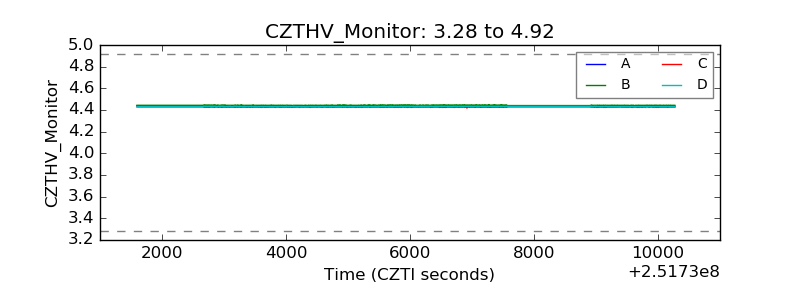 |
| D_VDD | 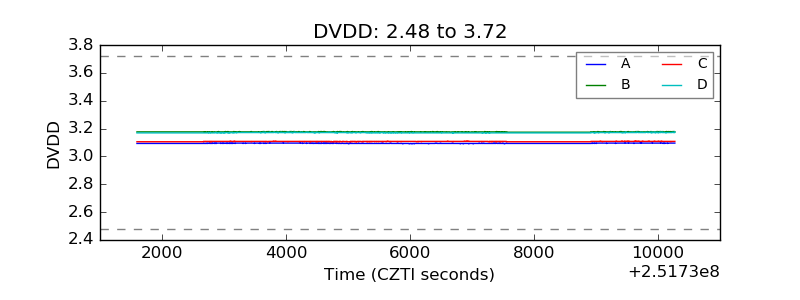 |
| Temperature 1 |  |
| Veto HV Monitor | 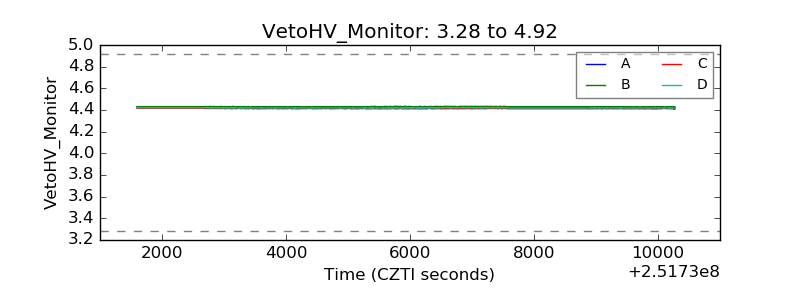 |
| Veto LLD |  |
| Alpha Counter | 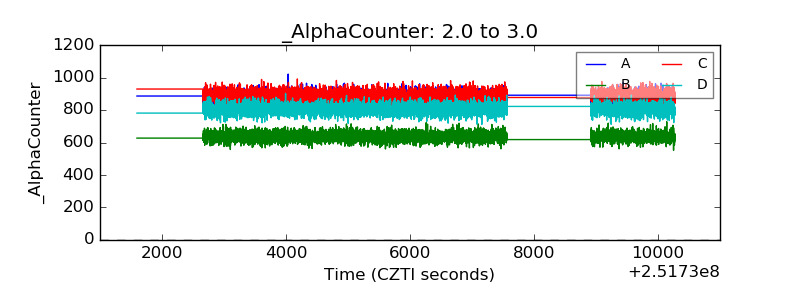 |
| _CPM_Rate | 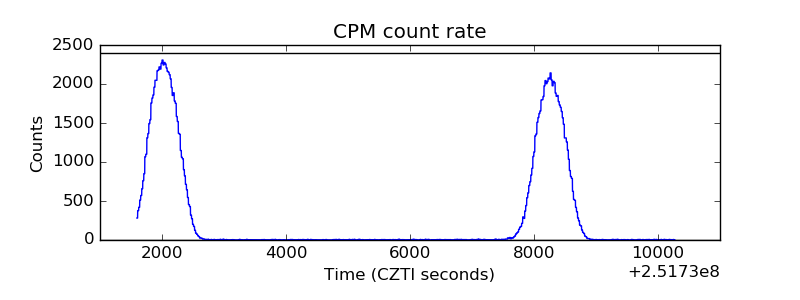 |
| CZT Counter | 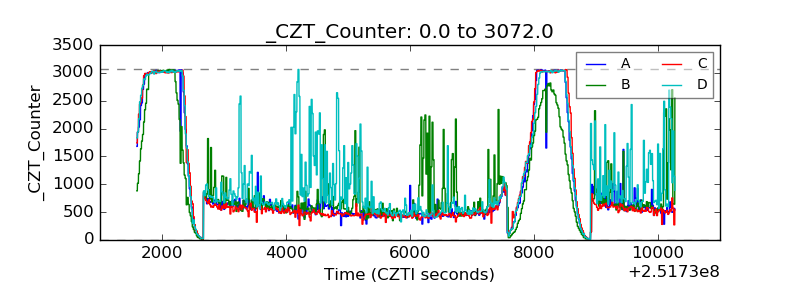 |
| +2.5 Volts monitor |  |
| +5 Volts monitor | 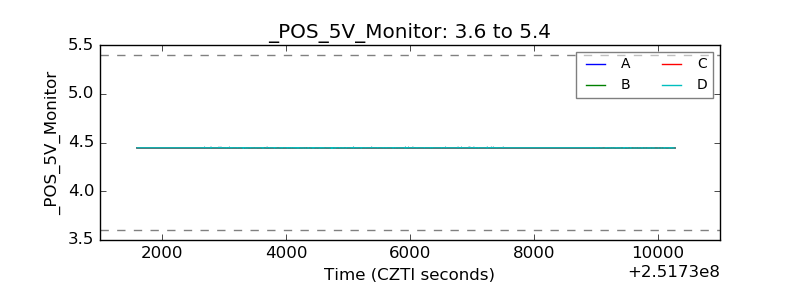 |
| _ROLL_ROT | 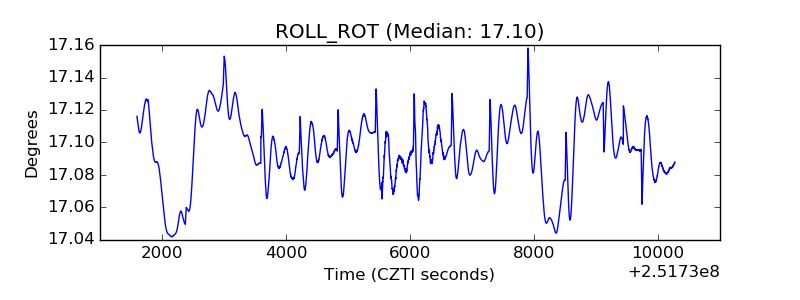 |
| _Roll_DEC | 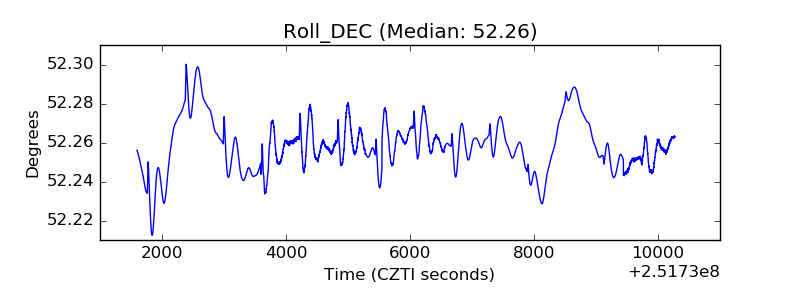 |
| _Roll_RA | 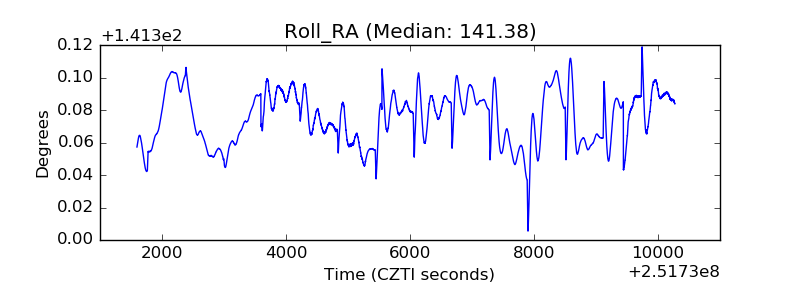 |
| Veto Counter | 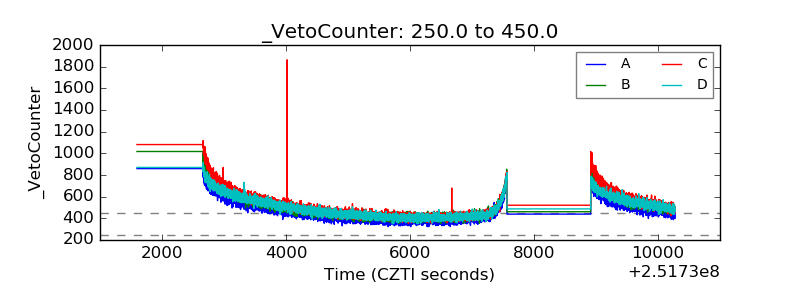 |