| Param | Original file | Final file |
|---|---|---|
| Filename | modeM0/AS1G08_065T01_9000001796_12101cztM0_level2.evt | modeM0/AS1G08_065T01_9000001796_12101cztM0_level2_quad_clean.evt |
| Size (bytes) | 528,912,000 | 95,803,200 |
| Size | 504.4 MB | 91.4 MB |
| Events in quadrant A | 3,423,322 | 631,572 |
| Events in quadrant B | 4,156,939 | 612,748 |
| Events in quadrant C | 3,125,957 | 630,062 |
| Events in quadrant D | 4,891,482 | 593,941 |
| Mode M0 | |||
|---|---|---|---|
| Quadrant | BADHDUFLAG | Total packets | Discarded packets |
| A | 0 | 14240 | 3 |
| B | 0 | 16517 | 2 |
| C | 0 | 13237 | 2 |
| D | 0 | 18819 | 2 |
| Mode M9 | |||
|---|---|---|---|
| Quadrant | BADHDUFLAG | Total packets | Discarded packets |
| A | 0 | 23 | 0 |
| B | 0 | 23 | 0 |
| C | 0 | 23 | 0 |
| D | 0 | 24 | 0 |
| Mode SS | |||
|---|---|---|---|
| Quadrant | BADHDUFLAG | Total packets | Discarded packets |
| A | 0 | 126 | 0 |
| B | 0 | 126 | 0 |
| C | 0 | 126 | 0 |
| D | 0 | 126 | 0 |
| Quadrant | Total seconds | Saturated seconds | Saturation percentage |
|---|---|---|---|
| A | 6200 | 142 | 2.290323% |
| B | 6200 | 412 | 6.645161% |
| C | 6200 | 80 | 1.290323% |
| D | 6200 | 417 | 6.725806% |
Noise dominated data is calculated using 1-second bins in cleaned event files. If a bin has >2000 counts, and if more than 50% of those come from <1% of pixels, then it is considered to be noise-dominated and hence unusable.
| Quadrant | # 1 sec bins | Bins with >0 counts | Bins with >2000 counts | High rate bins dominated by noise | Noise dominated (total time) | Noise dominated (detector-on time) | Marked lightcurve |
|---|---|---|---|---|---|---|---|
| A | 7486 | 6201 | 8 | 8 | 0.11% | 0.13% | 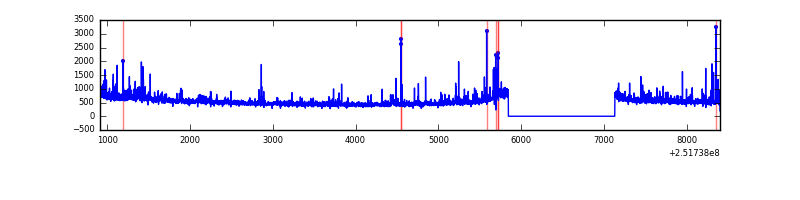 |
| B | 7486 | 6202 | 184 | 184 | 2.46% | 2.97% | 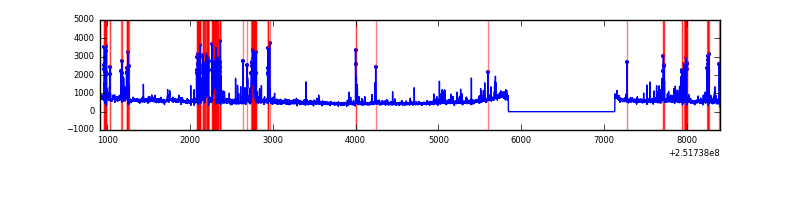 |
| C | 7486 | 6202 | 0 | 0 | 0.00% | 0.00% | 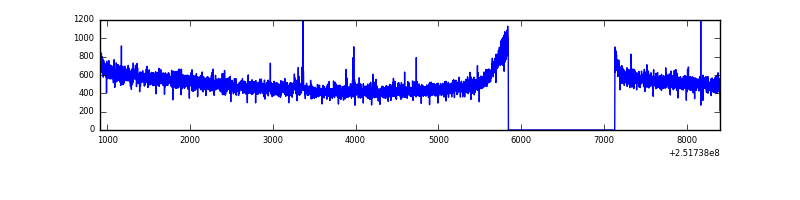 |
| D | 7486 | 6201 | 236 | 236 | 3.15% | 3.81% | 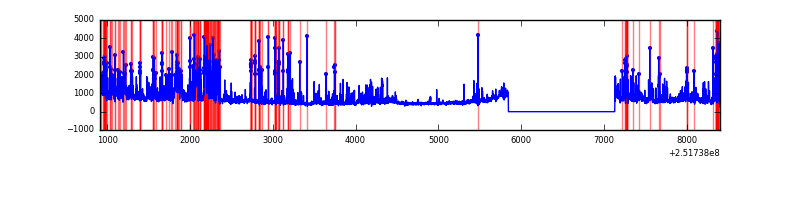 |
Top three noisy pixels from each quadrant. If the there are fewer than three noisy pixels in the level2.evt file, extra rows are filled as -1
| Pixel properties | Quadrant properties | ||||||
|---|---|---|---|---|---|---|---|
| Quadrant | DetID | PixID | Counts | Sigma | Mean | Median | Sigma |
| A | 1 | 162 | 94711 | 585.47 | 809 | 795 | 160.4 |
| A | 14 | 63 | 51579 | 316.59 | 809 | 795 | 160.4 |
| A | 1 | 178 | 38860 | 237.3 | 809 | 795 | 160.4 |
| B | 4 | 239 | 845656 | 5790.75 | 789 | 770 | 145.9 |
| B | 11 | 51 | 89981 | 611.44 | 789 | 770 | 145.9 |
| B | 15 | 204 | 76088 | 516.22 | 789 | 770 | 145.9 |
| C | 15 | 208 | 12751 | 65.65 | 798 | 804 | 182.0 |
| C | 13 | 61 | 6064 | 28.9 | 798 | 804 | 182.0 |
| C | 12 | 4 | 2085 | 7.04 | 798 | 804 | 182.0 |
| D | 1 | 52 | 1218699 | 6576.53 | 777 | 756 | 185.2 |
| D | 8 | 195 | 248214 | 1336.2 | 777 | 756 | 185.2 |
| D | 14 | 34 | 131564 | 706.32 | 777 | 756 | 185.2 |
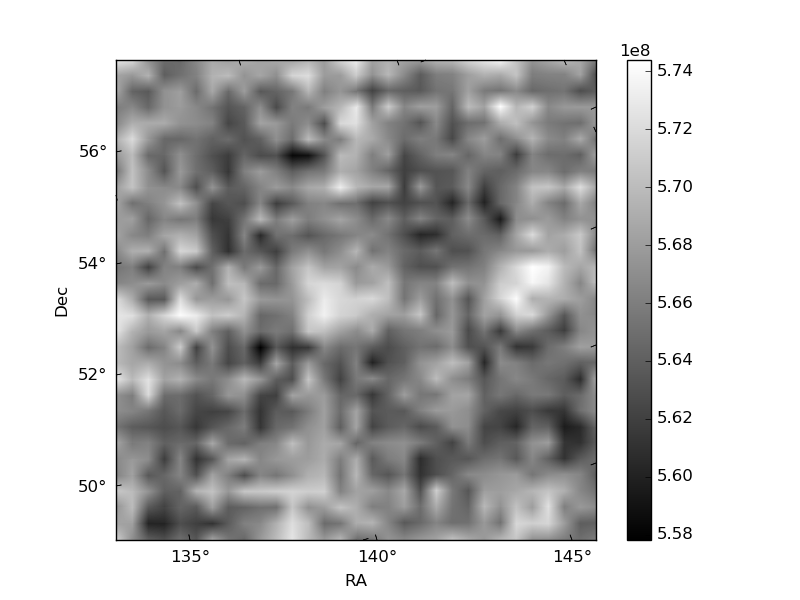
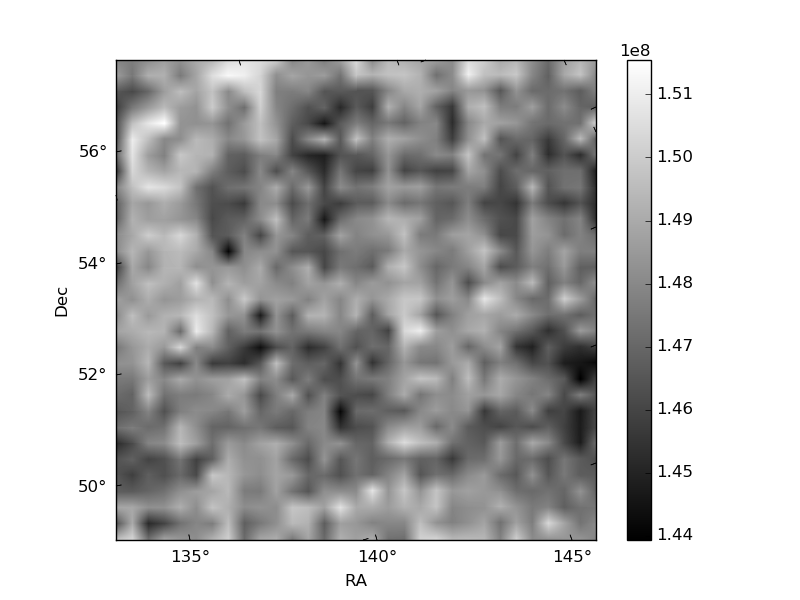
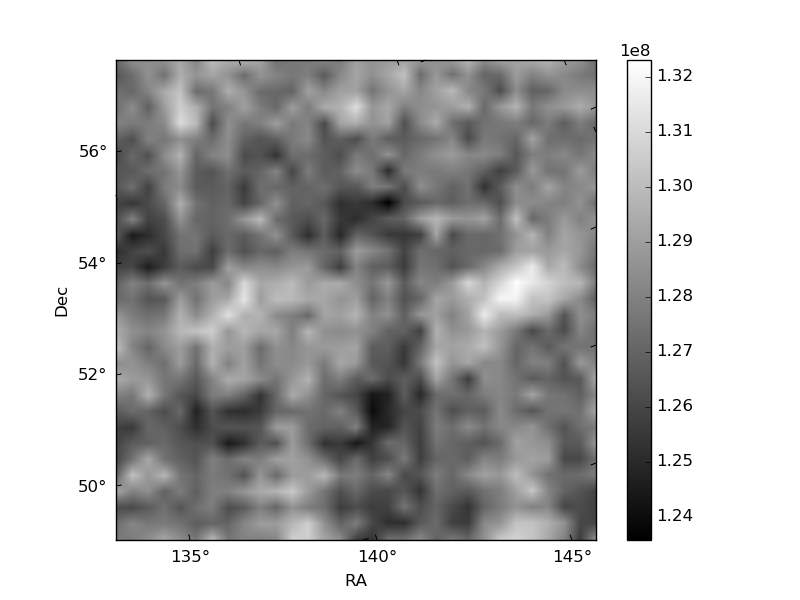
Histogram calculated using DETX and DETY for each event in the final _common_clean file
| Quadrant A | 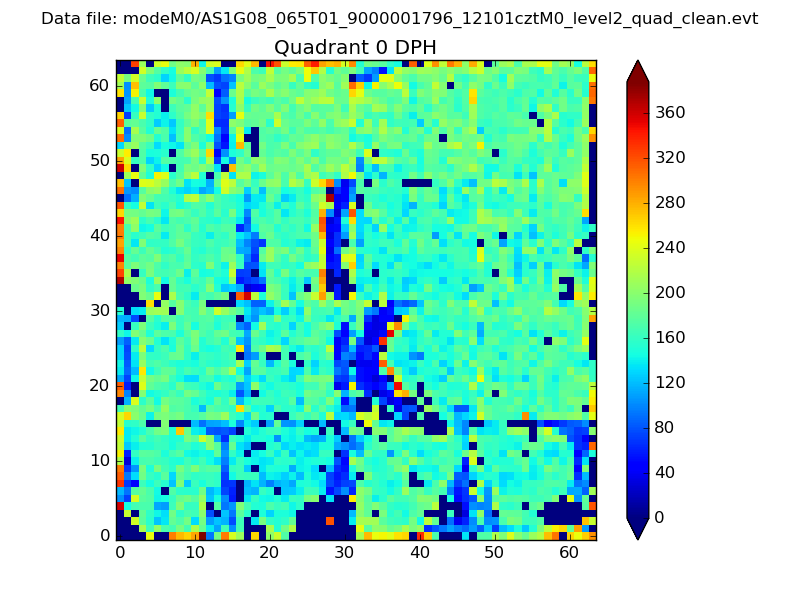 |
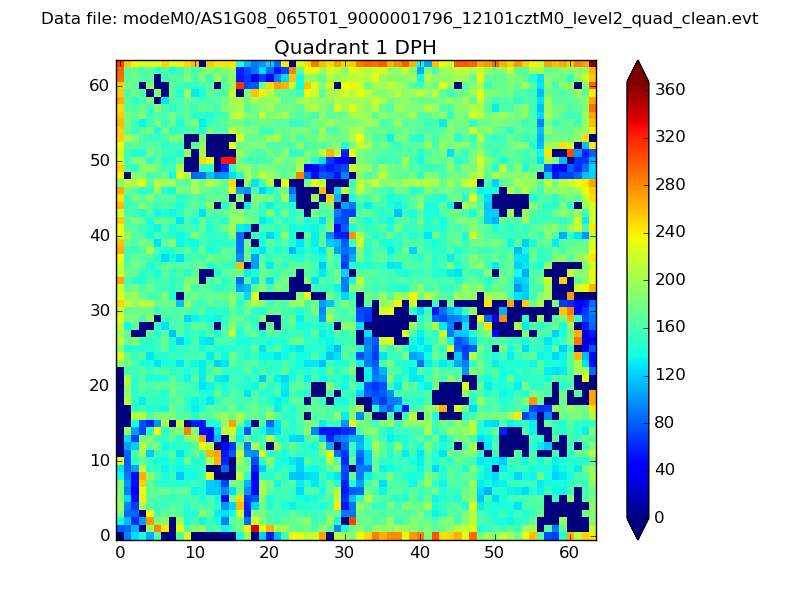 |
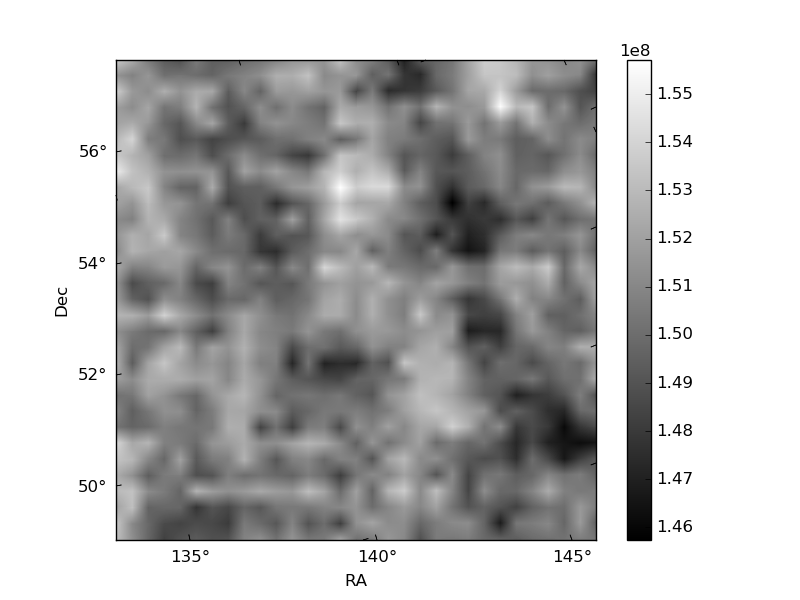
Quadrant B |
|---|---|---|---|
| Quadrant D | 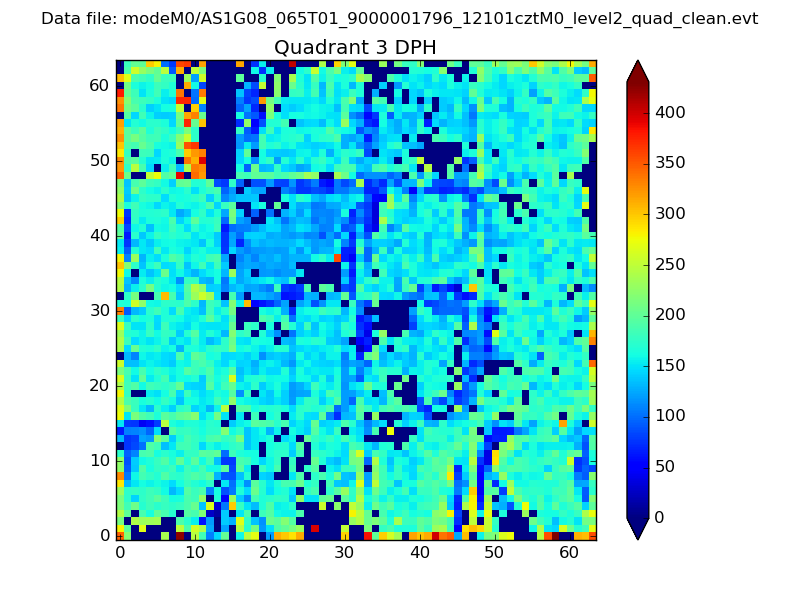 |
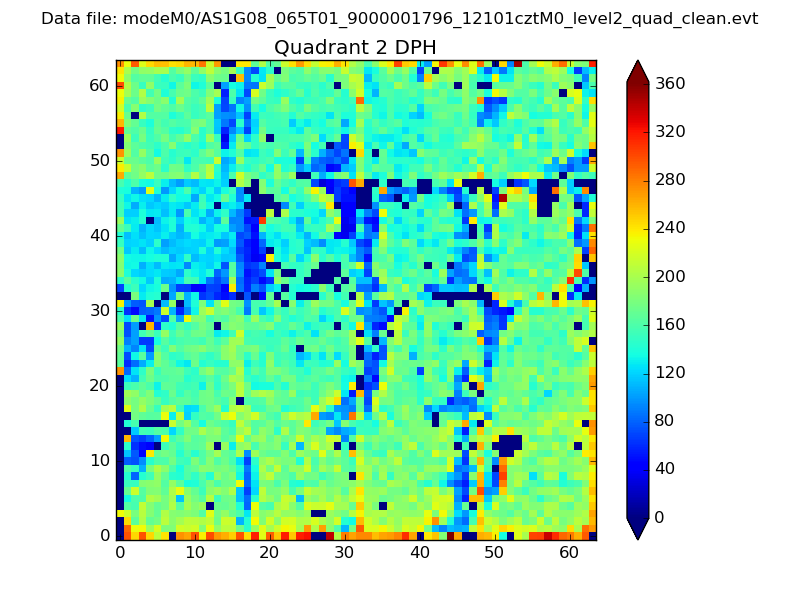 |
Quadrant C |
| Plot type | Count rate plots | Images |
|---|---|---|
| Comparison with Poisson distribution Blue bars denote a histogram of data divided into 1 sec bins. Red curve is a Poisson curve with rate = median count rate of data. |
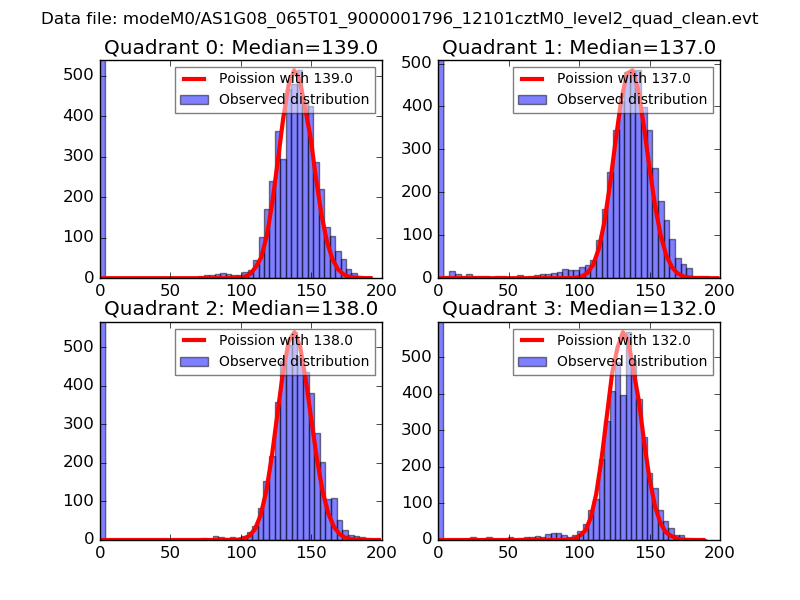 |
 |
| Quadrant-wise count rates Data is divided into 100 sec bins |
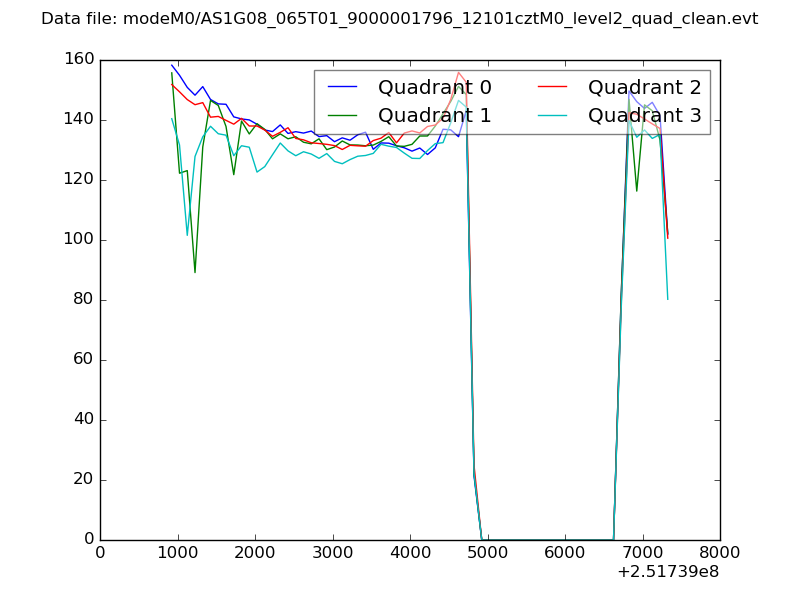 |
|
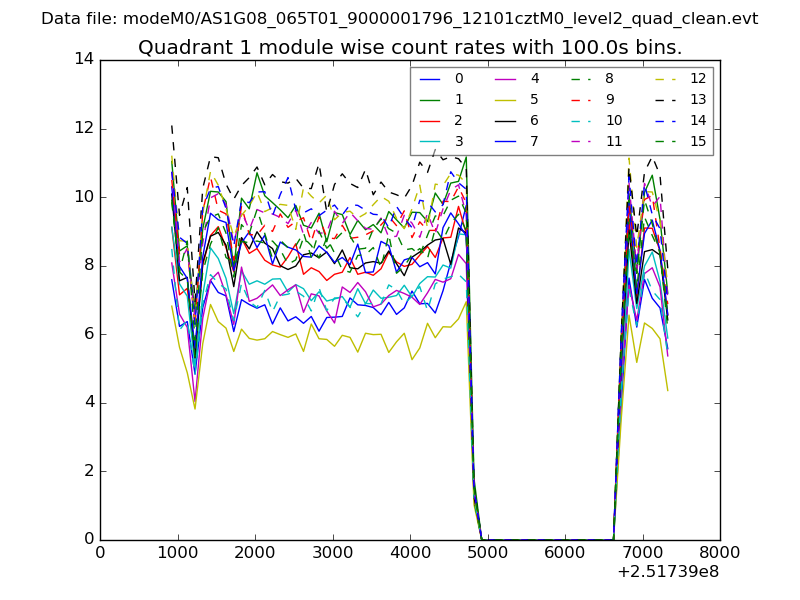
| Module-wise count rates for Quadrant A Data is divided into 100 sec bins |
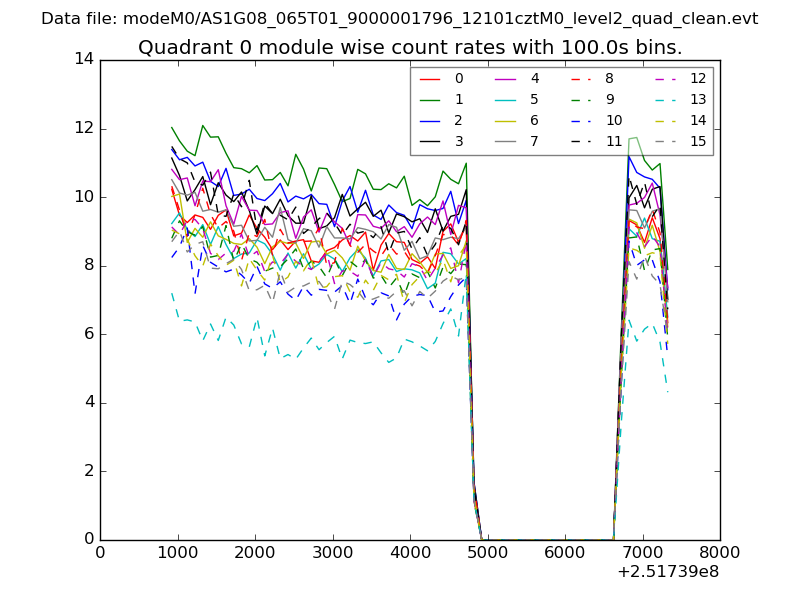 |
 |
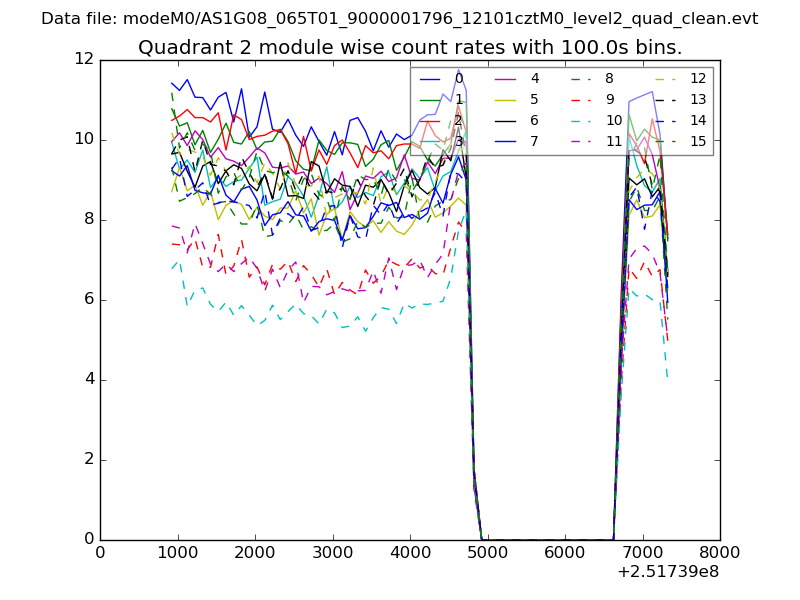
| Module-wise count rates for Quadrant B Data is divided into 100 sec bins |
 |
 |
| Module-wise count rates for Quadrant C Data is divided into 100 sec bins |
 |
 |
| Module-wise count rates for Quadrant D Data is divided into 100 sec bins |
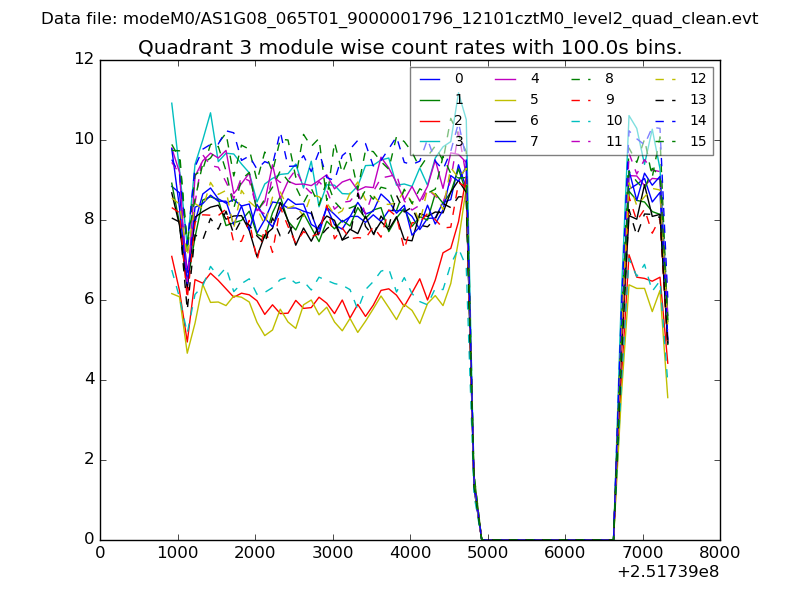 |
 |
| Parameter | Plot |
|---|---|
| CZT HV Monitor | 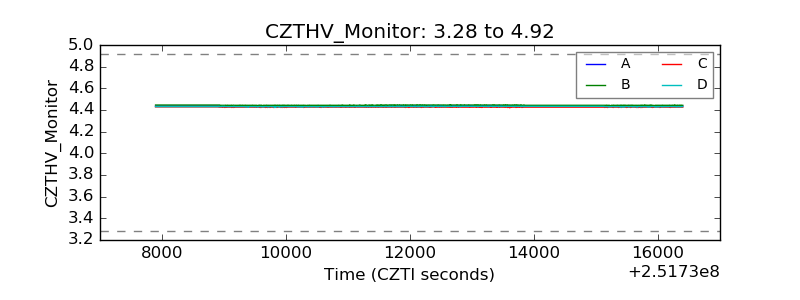 |
| D_VDD | 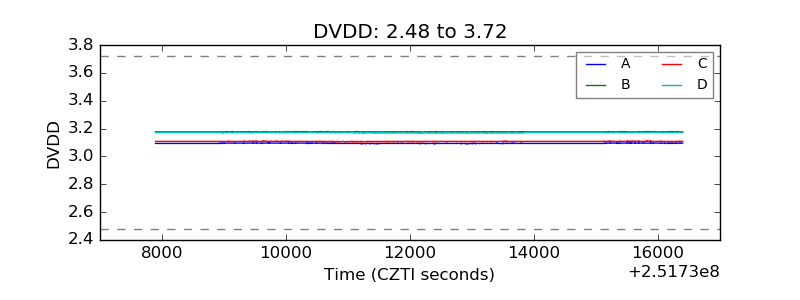 |
| Temperature 1 | 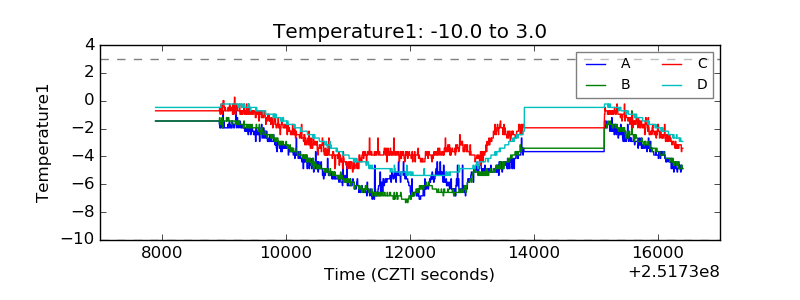 |
| Veto HV Monitor | 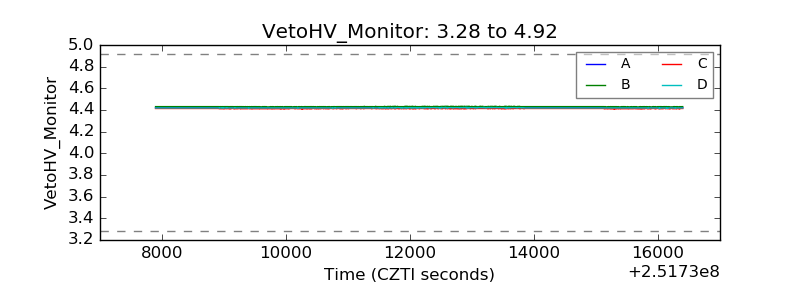 |
| Veto LLD | 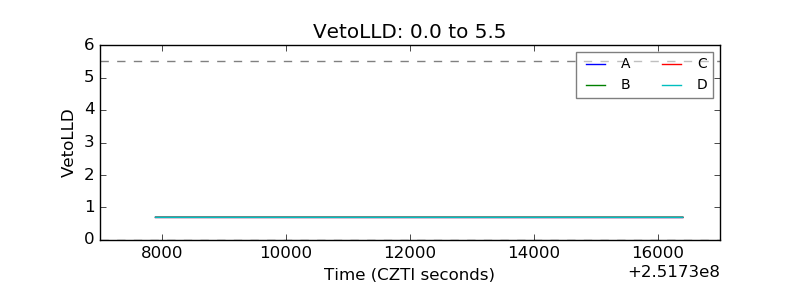 |
| Alpha Counter | 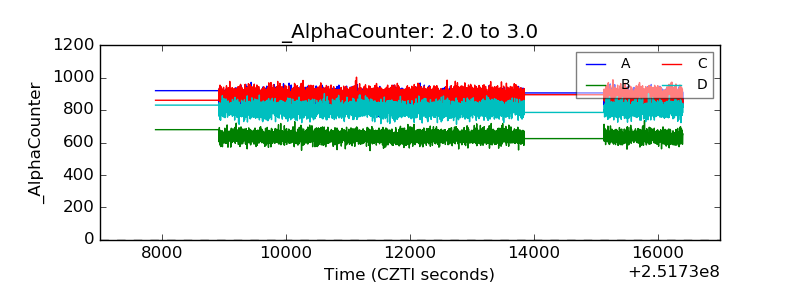 |
| _CPM_Rate | 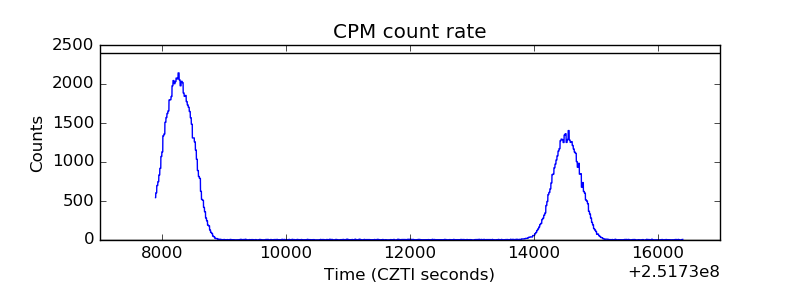 |
| CZT Counter | 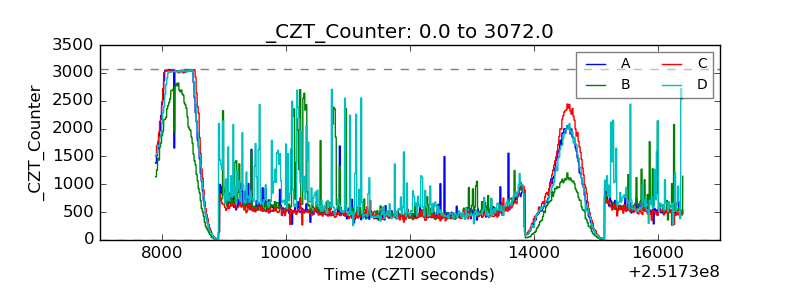 |
| +2.5 Volts monitor |  |
| +5 Volts monitor |  |
| _ROLL_ROT | 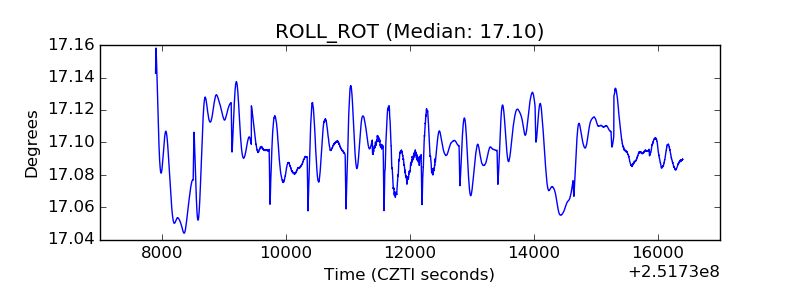 |
| _Roll_DEC | 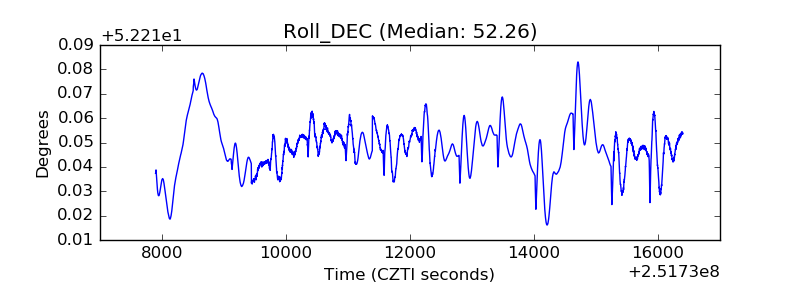 |
| _Roll_RA | 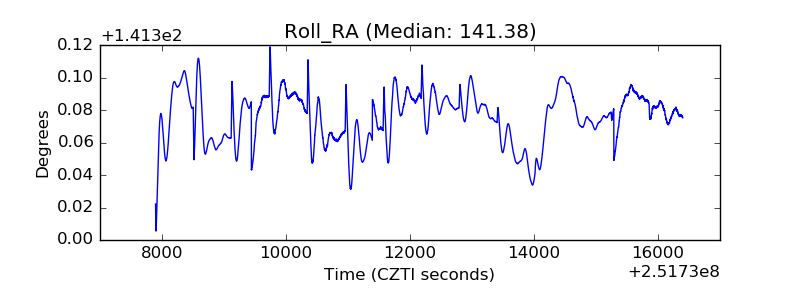 |
| Veto Counter | 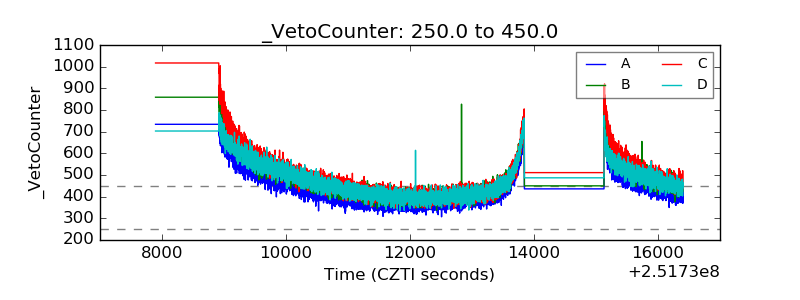 |