| Param | Original file | Final file |
|---|---|---|
| Filename | modeM0/AS1G08_065T01_9000001796_12102cztM0_level2.evt | modeM0/AS1G08_065T01_9000001796_12102cztM0_level2_quad_clean.evt |
| Size (bytes) | 501,356,160 | 103,544,640 |
| Size | 478.1 MB | 98.7 MB |
| Events in quadrant A | 3,772,798 | 678,550 |
| Events in quadrant B | 3,668,206 | 676,669 |
| Events in quadrant C | 3,136,775 | 678,334 |
| Events in quadrant D | 4,159,918 | 644,313 |
| Mode M0 | |||
|---|---|---|---|
| Quadrant | BADHDUFLAG | Total packets | Discarded packets |
| A | 0 | 15564 | 3 |
| B | 0 | 15292 | 2 |
| C | 0 | 13664 | 2 |
| D | 0 | 16807 | 2 |
| Mode M9 | |||
|---|---|---|---|
| Quadrant | BADHDUFLAG | Total packets | Discarded packets |
| A | 0 | 14 | 0 |
| B | 0 | 14 | 0 |
| C | 0 | 14 | 0 |
| D | 0 | 15 | 0 |
| Mode SS | |||
|---|---|---|---|
| Quadrant | BADHDUFLAG | Total packets | Discarded packets |
| A | 0 | 134 | 0 |
| B | 0 | 134 | 0 |
| C | 0 | 134 | 0 |
| D | 0 | 134 | 0 |
| Quadrant | Total seconds | Saturated seconds | Saturation percentage |
|---|---|---|---|
| A | 6566 | 209 | 3.183064% |
| B | 6566 | 164 | 2.497716% |
| C | 6566 | 57 | 0.868108% |
| D | 6566 | 237 | 3.609504% |
Noise dominated data is calculated using 1-second bins in cleaned event files. If a bin has >2000 counts, and if more than 50% of those come from <1% of pixels, then it is considered to be noise-dominated and hence unusable.
| Quadrant | # 1 sec bins | Bins with >0 counts | Bins with >2000 counts | High rate bins dominated by noise | Noise dominated (total time) | Noise dominated (detector-on time) | Marked lightcurve |
|---|---|---|---|---|---|---|---|
| A | 7667 | 6568 | 77 | 77 | 1.00% | 1.17% | 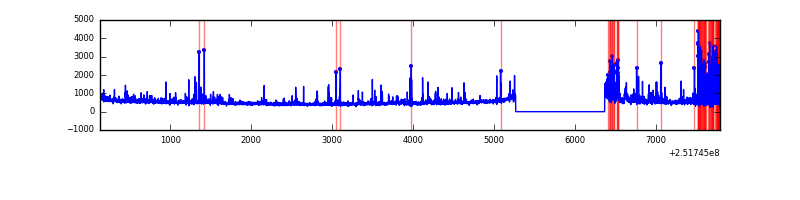 |
| B | 7667 | 6567 | 37 | 37 | 0.48% | 0.56% | 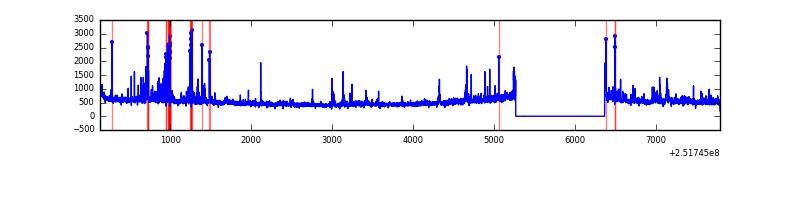 |
| C | 7667 | 6568 | 0 | 0 | 0.00% | 0.00% | 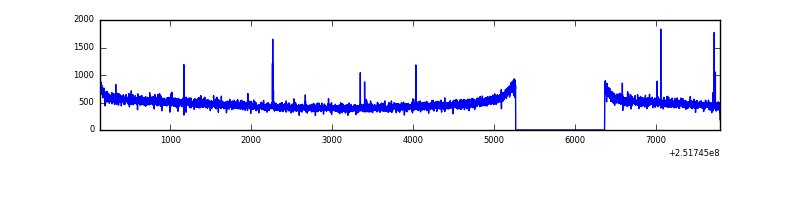 |
| D | 7667 | 6568 | 99 | 99 | 1.29% | 1.51% | 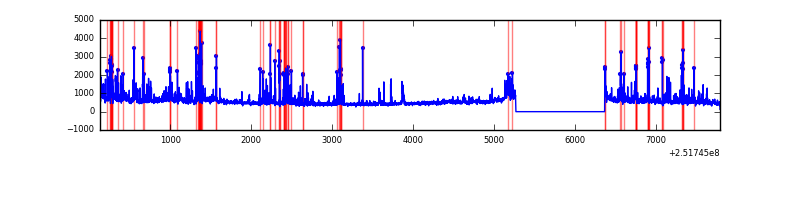 |
Top three noisy pixels from each quadrant. If the there are fewer than three noisy pixels in the level2.evt file, extra rows are filled as -1
| Pixel properties | Quadrant properties | ||||||
|---|---|---|---|---|---|---|---|
| Quadrant | DetID | PixID | Counts | Sigma | Mean | Median | Sigma |
| A | 13 | 248 | 198966 | 1219.59 | 809 | 793 | 162.5 |
| A | 14 | 63 | 185577 | 1137.19 | 809 | 793 | 162.5 |
| A | 1 | 162 | 121681 | 743.97 | 809 | 793 | 162.5 |
| B | 4 | 239 | 344520 | 2266.16 | 810 | 793 | 151.7 |
| B | 15 | 204 | 58204 | 378.51 | 810 | 793 | 151.7 |
| B | 11 | 51 | 41451 | 268.05 | 810 | 793 | 151.7 |
| C | 14 | 234 | 12044 | 60.91 | 800 | 803 | 184.6 |
| C | 13 | 61 | 5950 | 27.89 | 800 | 803 | 184.6 |
| C | 14 | 67 | 5142 | 23.51 | 800 | 803 | 184.6 |
| D | 1 | 52 | 454568 | 2424.28 | 787 | 765 | 187.2 |
| D | 8 | 195 | 184711 | 982.67 | 787 | 765 | 187.2 |
| D | 14 | 34 | 120470 | 639.48 | 787 | 765 | 187.2 |
Histogram calculated using DETX and DETY for each event in the final _common_clean file
| Quadrant A | 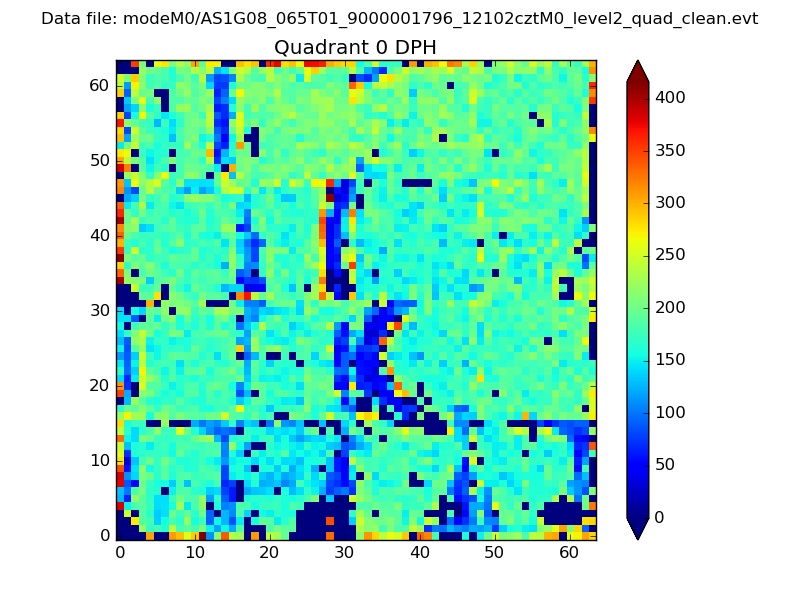 |
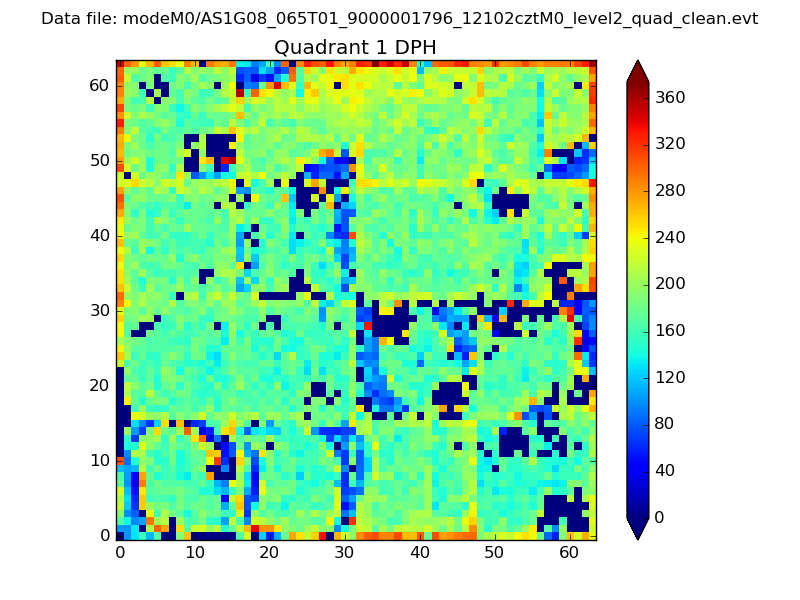 |
Quadrant B |
|---|---|---|---|
| Quadrant D | 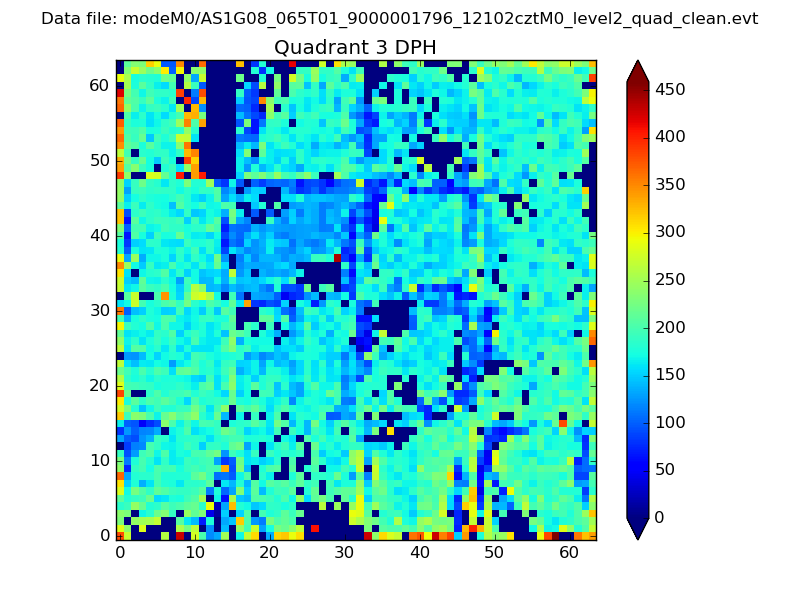 |
 |
Quadrant C |
| Plot type | Count rate plots | Images |
|---|---|---|
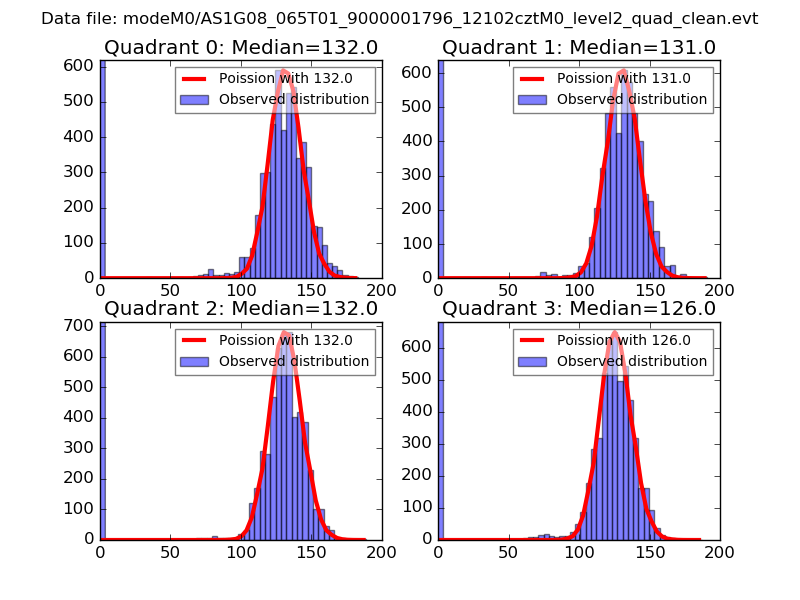
| Comparison with Poisson distribution Blue bars denote a histogram of data divided into 1 sec bins. Red curve is a Poisson curve with rate = median count rate of data. |
 |
 |
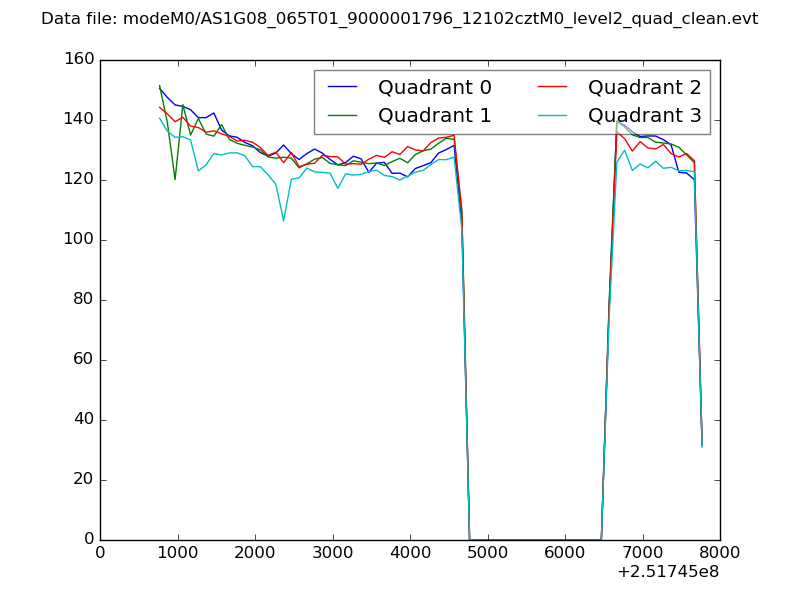
| Quadrant-wise count rates Data is divided into 100 sec bins |
 |
|
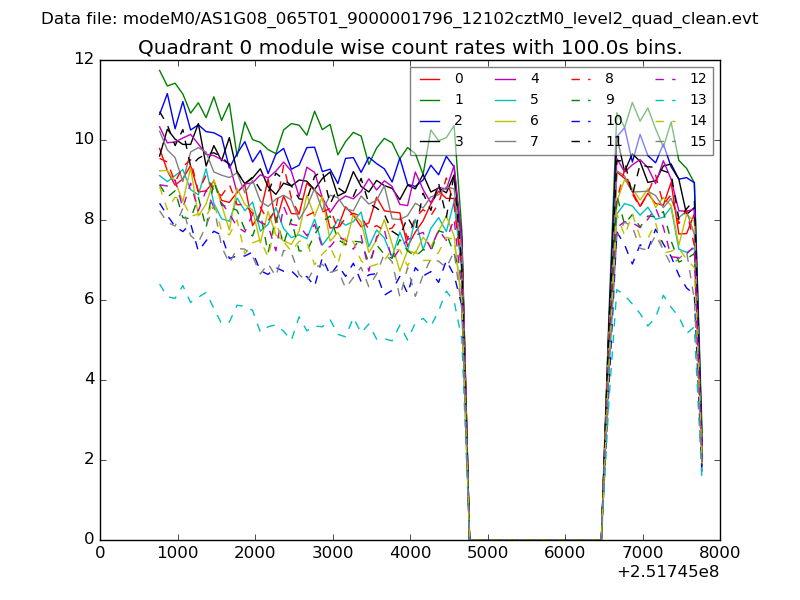
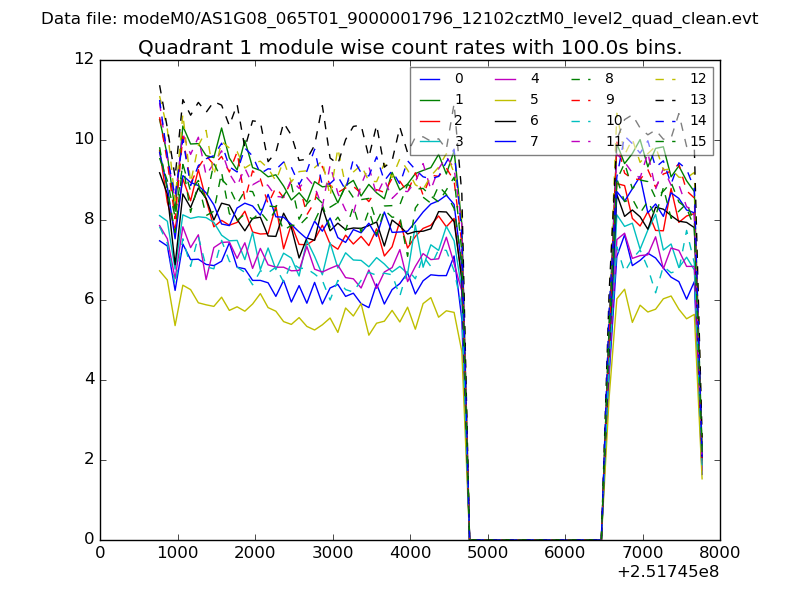
| Module-wise count rates for Quadrant A Data is divided into 100 sec bins |
 |
 |
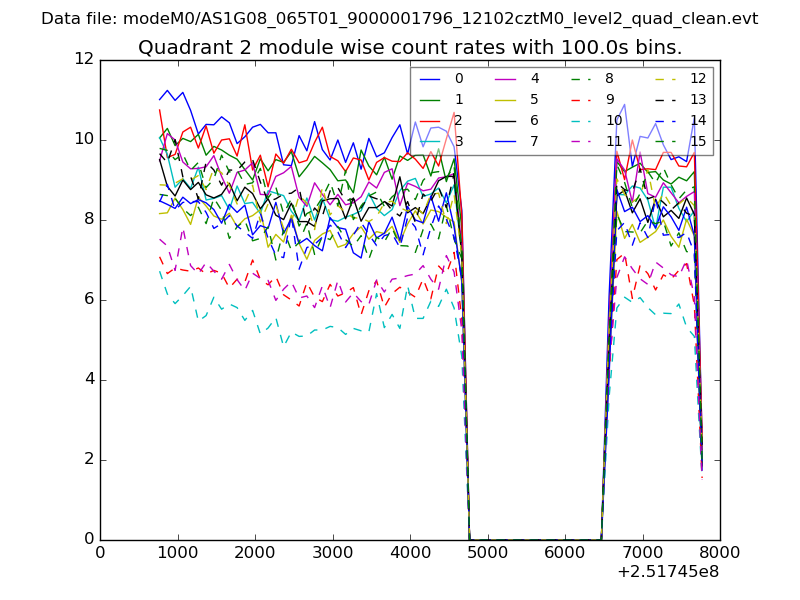
| Module-wise count rates for Quadrant B Data is divided into 100 sec bins |
 |
 |
| Module-wise count rates for Quadrant C Data is divided into 100 sec bins |
 |
 |
| Module-wise count rates for Quadrant D Data is divided into 100 sec bins |
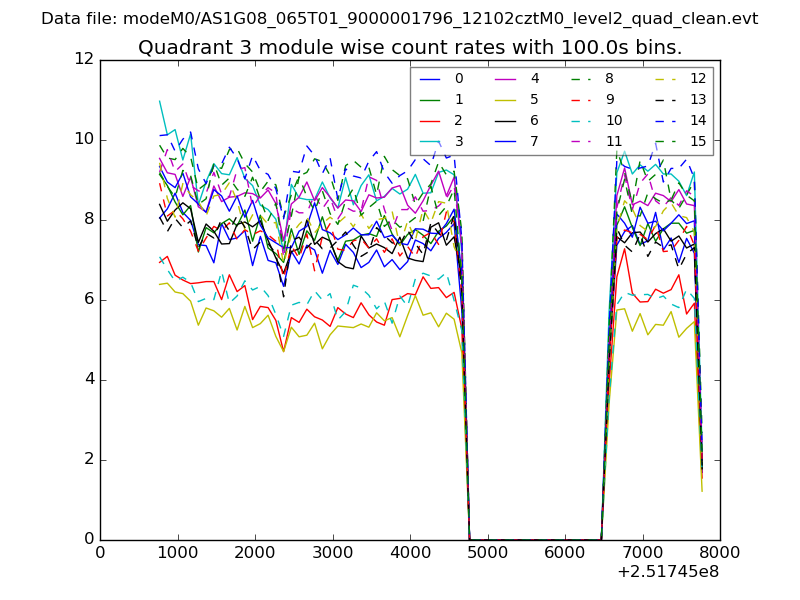 |
 |
| Parameter | Plot |
|---|---|
| CZT HV Monitor | 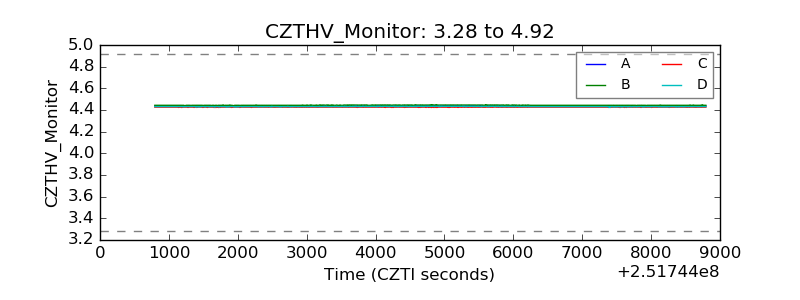 |
| D_VDD | 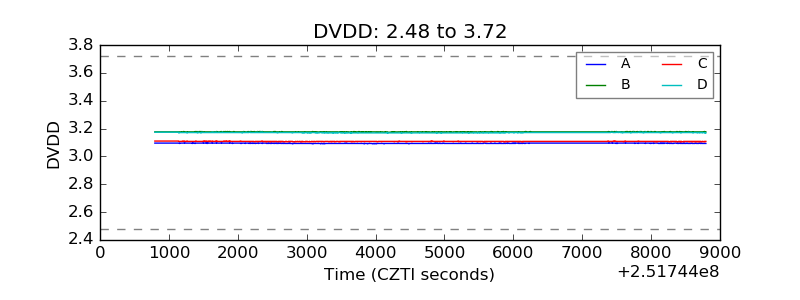 |
| Temperature 1 |  |
| Veto HV Monitor | 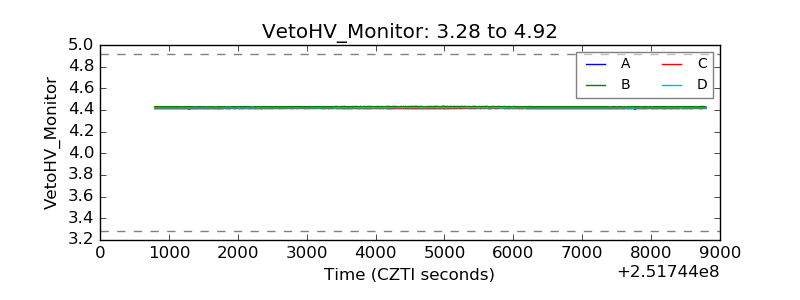 |
| Veto LLD | 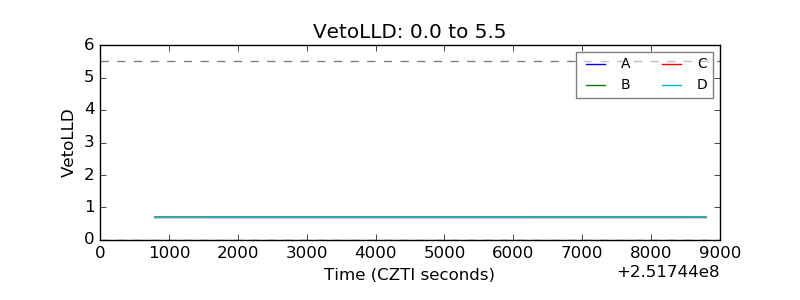 |
| Alpha Counter | 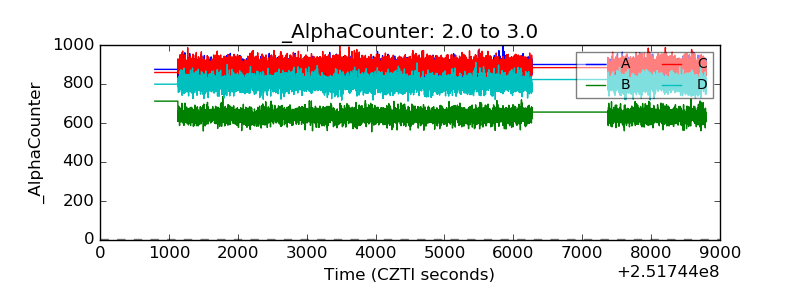 |
| _CPM_Rate | 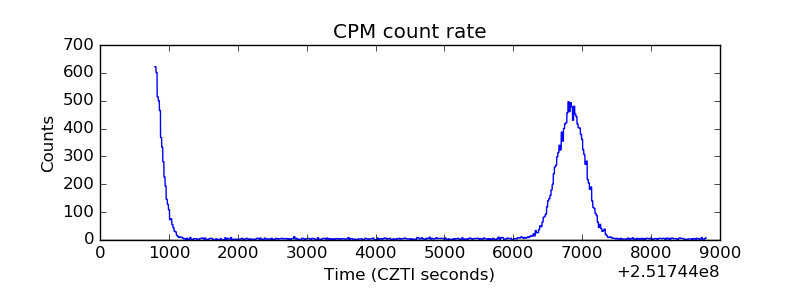 |
| CZT Counter |  |
| +2.5 Volts monitor |  |
| +5 Volts monitor |  |
| _ROLL_ROT | 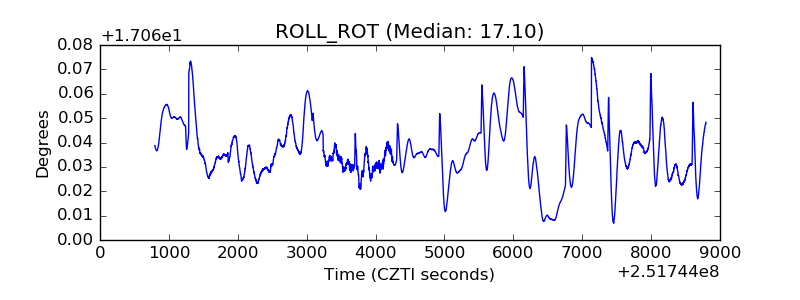 |
| _Roll_DEC | 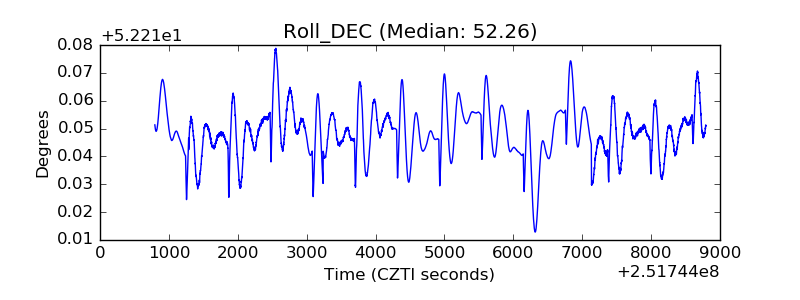 |
| _Roll_RA | 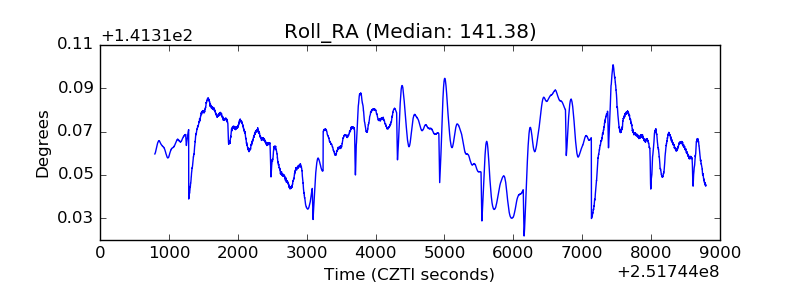 |
| Veto Counter | 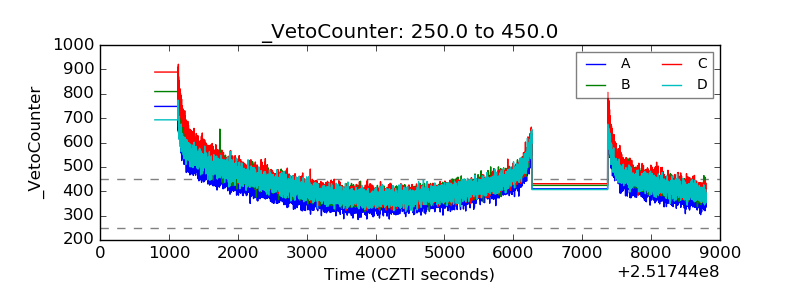 |